Indexed In
- Open J Gate
- Genamics JournalSeek
- Academic Keys
- JournalTOCs
- ResearchBible
- China National Knowledge Infrastructure (CNKI)
- Scimago
- Ulrich's Periodicals Directory
- Electronic Journals Library
- RefSeek
- Hamdard University
- EBSCO A-Z
- OCLC- WorldCat
- SWB online catalog
- Virtual Library of Biology (vifabio)
- Publons
- MIAR
- Scientific Indexing Services (SIS)
- Euro Pub
- Google Scholar
Useful Links
Share This Page
Journal Flyer

Open Access Journals
- Agri and Aquaculture
- Biochemistry
- Bioinformatics & Systems Biology
- Business & Management
- Chemistry
- Clinical Sciences
- Engineering
- Food & Nutrition
- General Science
- Genetics & Molecular Biology
- Immunology & Microbiology
- Medical Sciences
- Neuroscience & Psychology
- Nursing & Health Care
- Pharmaceutical Sciences
Research - (2020) Volume 11, Issue 5
Zirconium Interferences on the Detection of Silver Nanoparticles by Single Particle ICP-MS: Implications on Natural Water Analysis
Patrice Turcotte and Christian Gagnon*Received: 14-Jul-2020 Published: 31-Jul-2020, DOI: 10.35248/2157-7439.20.11.550
Abstract
The analysis of silver nanoparticle (NP Ag) by the single particle technique with argon plasma-coupled mass spectrometry (SPICP- MS) is an increasingly used analytical approach. The sensitive technique, distinguishing particle size distribution, allows working at concentrations similar to those found in environmental samples. The two natural Ag isotopes 107 and 109, with abundances of 52 and 48% respectively, have similar sensitivity in ICP-MS detection. However, it is common to encounter isobaric interferences in mass spectrometry, and the element silver is not an exception, as much with the 107 isotope as 109. For both isotopes, zirconium oxides present isobaric interferences, either 91Zr16O, 90Zr16O1H for the isotope 107 and the 92Zr16O1H for the 109. For surface water analysis by ICP-MS in regular technique, these interferences do not generally affect the analysis of total Ag concentrations as they can be then simply subtracted. On the other hand, detection of NP Ag was impacted by the interfering colloidal Zr. The analysis of Zr by the SP-ICP-MS technique of surface waters showed the presence of colloidal Zr, a random signal that cannot be simply subtracted from NP Ag signal. Our results showed that Zr colloids are effectively interfering with the NP Ag assays by SP-ICP-MS technique where interferences translated into a false positive. We proposed a calculation to evaluate a confidence threshold defining the maximum size that the false positives induced by Zr particles have on the silver particle detection. The analytical issue related to isobaric interferences from the naturally occurring colloidal Zr was attenuated by the use of the 109 isotope in the Ag particle detection, limiting false positive detections and improving the reliability of NP Ag measurements in natural waters. Therefore, more specific detection of NP Ag in surface waters that naturally contain Zr colloids can be accomplished.
Keywords
Nano-silver particles; Colloid Zr; Single particle detection; Isobaric interferences
Introduction
The occurrence of silver (Ag) in urban effluents is associated with the increasing use of silver nanoparticles (NP Ag) as an antiseptic agent frequently used in clothes and in food [1,2]. When municipal effluents are discharged into receiving streams, they are contaminated by both "dissolved Ag" and NP Ag forms. Such distinction among Ag forms must be taking into account in the assessment of exposure and toxicological effects to aquatic organisms [3]. Their environmental monitoring, both in effluents and aquatic ecosystems, requires a sensitive analytical approach that will allow the differentiation of NP Ag from dissolved Ag. Argon plasma-coupled mass spectrometry (ICP-MS) is commonly used for the analysis of total Ag at low levels. These sensitive instruments are also used with the single particle technique (SPICP- MS) to distinguish forms between NP Ag from the dissolved phase. This specific technique consists in the collection of a series of measurements passing in the order of the millisecond for at least one minute in the detector system [4,5]. The dissolved phase distributed evenly in the solution generates a constant signal, while the passage of a NP Ag into the plasma is characterized by an intense signal for a very short period of time (0.5 ms). The intensity of this signal is proportional to the particle size. A very short reading time of the order of the millisecond (ms) allows the SP-ICPMS to record this signal (Figure 1). A subsequent mathematical treatment of all the collected signals allows the separation and quantification of the two Ag forms [5,6].The analysis of Ag by ICP-MS presents isobaric interferences, both with the Ag isotopes 107 and 109, due to the presence of natural zirconium (Zr) in the sample. The isotope 107 is frequently used for the detection of Np Ag in various environmental samples [7-16]. For the isotope 107, the interfering elements are 91Zr16O and 90Zr16O1H, while the elements 92Zr16O1H for the isotope 109 [9,10]. In natural waters, the Zr concentration was not found as abundant and generally < 1.0 μg/L [11] so that the interferences with the total Ag analysis are weak. Zirconium is not considered as a highly soluble element [12] and is rather found in the form of a suspended particle or colloid in water. In ICP-MS analysis in regular mode, isobaric interferences can thus be subtracted from the total concentration measured if the total Zr concentration and its correction factor are known. In the natural water samples analyzed in our laboratories, the total Zr concentrations were generally <1.0 μg/L, and the interferences with the total Ag analysis are typically low and even below the detection limit. The analysis of particulate or colloidal Zr in natural waters by the SP-ICP-MS technique however has to generate signals of the same nature as Ag nanoparticles. In single particle (SP) analysis mode, the interfering in the dissolved form would be present throughout all the reading of signals and would be included in the background, which would be subtracted prior the size calculations of the particles different from background. For the assessment of the NP, the background signal is subtracted from the intensity of the peak generated by NP and is not involved in the calculation of the size. However, in SP-ICP-MS mode with the interfering in particulate form, the induced Zr interference would be similar to the signal of a Ag particle and could not simply subtracted since randomly distributed. The detection of NP 107Ag in significant concentrations in natural waters compared to wastewater effluents may raise questions about their occurrence and interferences from natural suspended particles [7]. In this study, we thus propose to determine the interference of particulate and colloidal Zr on the detection of NP Ag in natural waters by SP-ICP-MS using both natural 107 and 109 Ag isotopes.
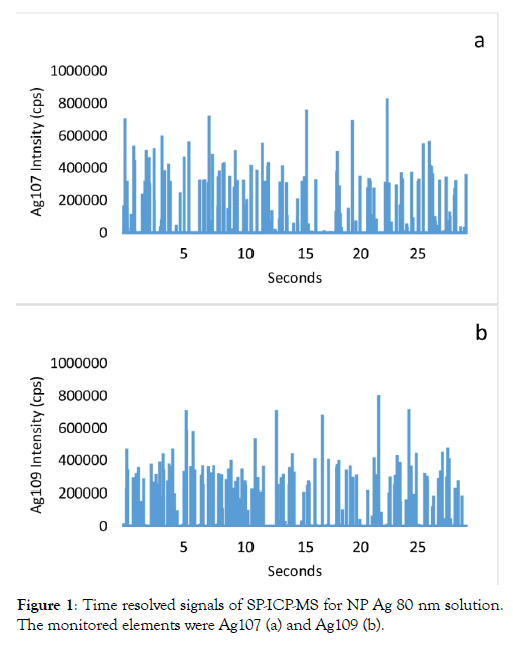
Figure 1: Time resolved signals of SP-ICP-MS for NP Ag 80 nm solution. The monitored elements were Ag107 (a) and Ag109 (b).
Materials and Methods
General information
The NP-ZrO2 was purchased from Sigma Aldrich (643122). The particle sizes are less than 100 nm and the concentration is 5 wt%. A solution of 100 ng Zr/L in Milli-Q water was prepared by a series of successive dilutions. This solution was analyzed three times for Zr, with 90 isotope, and for the both natural silver isotopes, 107 and 109, with SP-ICP-MS mode. Before analysis, samples were sonicated in ultrasound bath. The stock solutions of NP-Ag 80 nm were purchased from TED PELLA (84050-80) and were in solution of sodium citrate (1 mM) as citrate allows for much longer storage of NP-Ag. The particle size was 78 ± 9 nm. The initial total Ag concentration of the solution was 21 000 μg Ag total/L. By serial dilutions, a 4.2 ng/L working solution was prepared. All prepared, sonicated NP-Ag solution was in sodium citrate (1 mM) solution and analyzed for Np-Ag content using 107 and 109 silver natural isotopes. The natural proportion of 107 and 109 silver isotope was respectively 51.8 and 48.2%. The Ag and Zr 10000 mg/L ionic standard were purchased from SCP Science (Baie-d’Urfée, Montréal, Canada). By serial dilutions, solutions of 0.1 μg/L, 0.5 μg/L and 1.0 μg/L were prepared in 1 % HNO3 (Baseline grade, SeaStar Vancouver, Canada).
Nanoparticle determination
The nanoparticles were measured by ICP-MS using the single particle technique (SP-ICP-MS) with a Thermo Scientific™ instrument (ICAP™-RQ). The transport evaluation, used for the size calculation [6], was done with the NP-Quant software provided by Thermo Scientific™®. The acquisition, time per event (dw) was set to 2.5 ms, for the three isotopes, for a total time of 90 s. The data processing, background and size calculation, was carried out with the Excel software. Before the nanoparticle analysis, the instrument was optimized with tune solution (1μg/L: Ba, Bi, Ce, Co, In, Li, U in 2.5 % HNO3 and 0.5 % HCl) to obtain the maximum sensitivity, the ratios Ba++/Ba+ < 3% and the CeO/Ce < 2%.
Isobaric interferences evaluation
For the determination of zirconium-induced polyatomic ion levels on silver 107 and 109 isotope signals, we prepared and analyzed an ionic Zr solution (10 μg Zr/L). The intensity measurements, expressed in cps unit, of isotopes 90 of Zr and 107 and 109 of Ag were evaluated. The intensity ratio 107Ag/90Zr and 109Ag/90Zr correspond to the contribution of formed Zr oxide and hydroxide ions to silver 107 and 109 isotope signals, respectively.
Natural water analysis
A series of analyses (n=10) were performed on surface water samples taken on May 18, 2018 in the St. Lawrence River in front of Quebec city and Nicolet River the August 11, 2017. Those samples presented contrasting values for their suspended particulate matter (SPM) contents: 27 mg/L vs. 4.0 mg/L. The SP-ICP-MS technique (for NPs) was carried out for the determination of the Zr isotope 90 and the Isotopes 107 and 109 of the silver. The three elements were alternately analyzed during a single sample aspiration for each replica. Simultaneous analyses of Zr and both Ag isotopes were performed at same time to minimize the sedimentation effect in test tube during the analysis. The total Ag and Zr concentrations (i.e., intensities of dissolved + particulate) and the particle size were calculated with Excel software. For Zr90, 107Ag and 109Ag intensities, we have calculated the equivalent spherical size with the equation described in previous studies [5,6]. Total concentrations of each isotope element were evaluated by the intensity summation for each replica and comparison with ionic standard.
Results and Discussion
Evaluation of isobaric interferences of Zr on silver isotopes 107 and 109
The intensities of the Ag109, Ag107, and Zr90 isotopes were measured in the ionic Zr solution (10 ug/L). The intensity (cps) ratio of Ag107/Zr90 and Ag109/Zr90, respectively 0.18 and 0.02% indicated the rate of Zr interference on silver measurements. Calculated ratios should not be considered constant, as they are strongly associated with the instrument optimization, specifically regarding the cerium oxide formation. In this study, ICP-MS parameters were optimized according to the manufacturer's specifications: CeO/Ce ratio below 2%. The detection of isotope Ag107 was thus much more interfered by Zr than the 109 isotope as indicated by Guo and al. [10] for the determination of total Ag concentrations by ICP-MS in regular mode. Given that the two natural isotopes of silver are in similar proportions, 52% for the 107 and 48% for 109, we thus benefited from using the isotopes choice as shown in Figure 1 for the analysis of NP Ag standards. The 107 isotope is rather recommended and frequently used for both routine analyses in regular and single particle (SP) ICP-MS modes [7,8,13,14,16]. In SP mode for NP analysis, the selection of Ag isotope should however be investigated with respect to the Zr interferences.
Analysis of a solution of NP-ZrO2 by the technique of SP-ICPMS Figure 2 shows the analysis of a solution of NP-ZrO2 using the isotope 90 of the Zr and the two Ag isotopes, 107 and 109, by the technique SP-ICP-MS. A study by Deguelde et al. [4] showed the feasibility of the analysis of colloidal ZrO2 by the SP-ICP-MS technique using its isotope 90. Analysed in triplicate, size distributions were provided for each isotopes (Figure 2). The Figure 2a shows the distribution of NP ZrO2 analyzed in suspension solution (100 ng/L) by SP-ICP-MS technique using the isotope 90. The Figure 2b reveals the analysis of this NP ZrO2 solution using rather the isotope Ag 107 while Figure 2c was for the Ag109. Figure 2b shows a series of “fooling” peaks appearing similarly to signals for Ag particles. In contrast, the peaks with the 109 isotope of silver were much less intense (Figure 2c). If the solution was contaminated with NP Ag, the SP-ICP-MS analysis would have been able to measure similar intensities with the two Ag isotopes that typically occur in similar proportions. The Figure 1a and 1b shows the analysis of NP Ag solutions by SPICP- MS with the two natural silver isotopes. The pulse intensities are similar with the two isotopes. NPs ZrO2 interfered with the detection of Ag particles by inducing false positives, especially with the isotope 107 (Figure 2b). For each of these peaks in the NP ZrO2 solution analysis triplicate, size values were calculated for the three isotopes using the equations from Paces et al (6). All the calculated sizes have been then sorted by classes and presented in the form of histograms. For each isotope, the three distributions were very similar for the majority sizes and varied within 15%. The particle size detection limit for these analyzes was evaluated at 20 nm for ZrO2 particles and 14 nm for the two silver isotopes. The sizes of NP ZrO2 mainly varied between 20 and 140 nm, with an estimated modal size of 60nm (Figure 3a). The analysis of NP ZrO2 was also accompanied by the formation of Zr oxides which interfere with the measurements of the two silver isotopes. Since these interferences originate from a nanoparticle, they appear in the form of a pulse (Figures 2b & 2c). For each of these intensities of these two silver isotopes, the equivalent sizes were calculated. Figure 3 shows size distribution histograms for the two silver isotopes. For isotope 107, the predominantly detected size was 14 nm and these extended up to 35 nm. For the silver isotope 109, the majority detection size was also 14 nm with no significant other detection. All sizes combined, almost 5 times more false silver particles were detected with the isotope 107, and passed the 17 nm size, the detections were almost exclusively with the isotope 107. If the solution of NP ZrO2 was contaminated with silver particles, we would have substantially the same particle reading of these for each of the two isotopes of silver. It can be concluded that false positives were detected with the isotope 107 and to a lesser extent with the isotope 109.
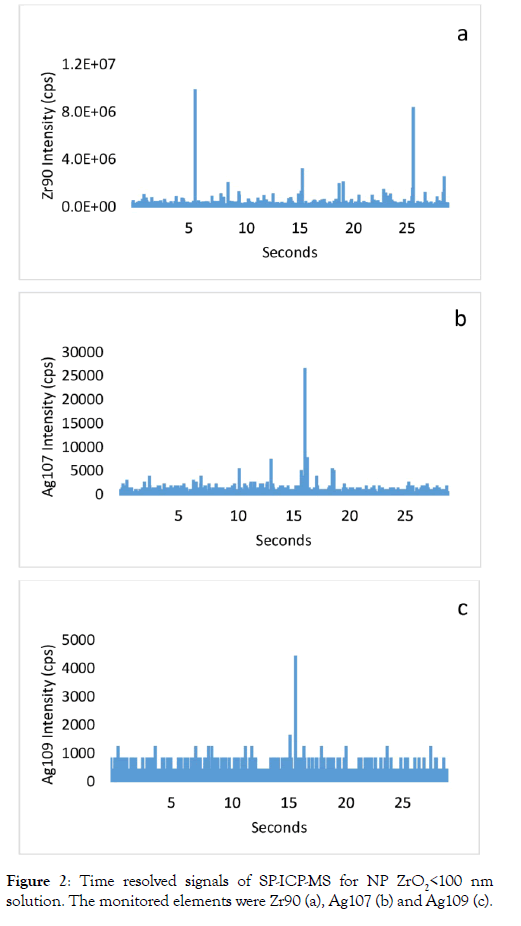
Figure 2: Time resolved signals of SP-ICP-MS for NP ZrO2<100 nm solution. The monitored elements were Zr90 (a), Ag107 (b) and Ag109 (c).
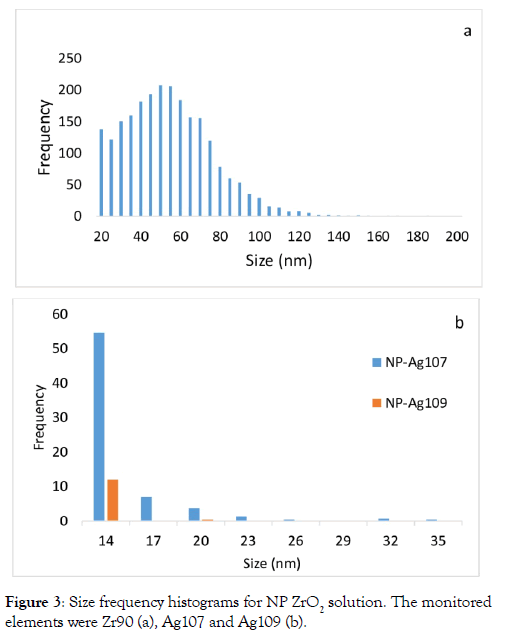
Figure 3: Size frequency histograms for NP ZrO
Natural water analysis
As previously mentioned, Zr interferes with the analysis of Ag and can overestimate the concentration of NP Ag, especially if the isotope 107 of Ag is used for measurements by ICP-MS. Total Ag concentrations were measured with the two isotopes of Ag and Zr with isotopes 90 in the natural waters used (Table 1). The difference in silver concentration measured with the two isotopes is small and less than the detection limit (1 ng / L), despite the presence of 720 and 420 ng / L of Zr in the samples. It was therefore concluded that the contribution of Zr interferences is marginal on the determination of total silver concentration in these natural waters.
Table 1: Total concentration of Ag, measured with the isotope 107 and 109, and Zr in the St-Lawrence and Nicolet Rivers. (n=10).
| Total concentration (ng/L) | ||||||
|---|---|---|---|---|---|---|
| St-Lawrence | Nicolet | |||||
| Ag107 | Ag109 | Zr | Ag107 | Ag109 | Zr | |
| Avg. | 5.0 | 4.2 | 721 | 2.5 | 2.1 | 422 |
| STDS. | 1.5 | 0.2 | 39 | 0.1 | 0.3 | 46 |
Zirconium is naturally present in surface waters and mainly associated with the particulate and colloidal phase rather than the dissolved phase [11,12,15]. A regular analysis by ICP-MS does not allow differentiating these two forms, while one by SP-ICP-MS allows. The analysis of Zr90 in water from the St. Lawrence River by the SP-ICP-MS technique (Figure 4a) shows a strong pulse of particulate Zr and this same water analyzed by the same technique for the two isotopes of silver also has strong pulses (Figure 4b and 4c). In the previous section, we showed that NP-ZrO2 positively interferes with the detection of NP-Ag, especially if the isotope 107 is used.
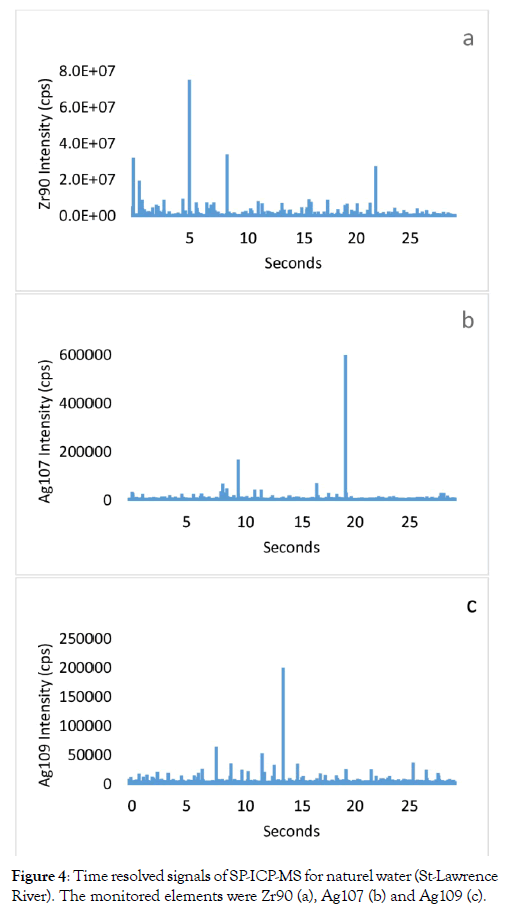
Figure 4: Time resolved signals of SP-ICP-MS for naturel water (St-Lawrence River). The monitored elements were Zr90 (a), Ag107 (b) and Ag109 (c).
In the two an aquatic system under natural erosion processes, significant concentrations of suspended particles are typical in these waters. The concentration of particulate Zr follows this same trend. Considering that to have an interference, a false positive, on the detection of a nanoparticle it is necessary that the interference comes from the particulate phase. The analysis of particulate Zr in two different natural waters in term of particulate load, Saint- Lawrence (27 mg/L) and Nicolet River (4 mg/L) by the SP ICP-MS technique would thus produce signals that can be confused with silver nanoparticles; so there is a likelihood of false positives. For each pulse, larger than the background signal, we calculated the spherical size of the particle [6]. The size detection limit was 15 nm for silver particles and 50 nm for those of ZrO2. The results, for each of the silver isotopes, were grouped into five classes: >15, >25, >35, >45, >55 nm. For Zr, classes were also grouped as followed: > 50, > 100, > 200, > 300, > 400 nm (Tables 2 & 3). A quick analysis of the two tables shows that numbers of particles of Ag and Zr are greater in the St. Lawrence River than in the Nicolet River. The ratio 107:109 particle counts showed much more detection with isotope 107 in the St. Lawrence River. A comparison of these differences using a t-test shows that they are significant, with a confidence level of 95%, for all classes. These results are similar to those obtained with the NP-ZrO2 solution: the detection number being higher with the Ag isotope 107 than 109. This difference is due to the formation of zirconium oxide pulse, produced during the atomization of Zr particles that are present in the St. Lawrence River (Table 3), interfering with the detection of NP-Ag. Therefore, for the analysis of silver particles in natural waters, it is recommended to use the Ag isotope 109 instead of the isotope 107. On the other hand, the analysis of Nicolet River samples, which contained fewer suspended particles and less Zr particles than the St. Lawrence River, showed lower number of detections and the ratio 107/109 were then slightly greater than 1 only for the first three detection fractions of NP-Ag. This difference between the NP-Ag detections with both silver isotopes was only significant when particles are larger than 15 nm.
Table 2: Size frequency for NP-Ag detected by analysis (30 sec) in the St-Lawrence and Nicolet Rivers. Measurements with the isotope 107 and 109. (n=10).
| NP-Ag107 (nm) | NP-Ag109 (nm) | |||||||||
|---|---|---|---|---|---|---|---|---|---|---|
| >15 | >25 | >35 | >45 | >55 | >15 | >25 | >35 | >45 | >55 | |
| St-Lawrence | ||||||||||
| Avg. | 237.9 | 30.1 | 9.7 | 4.4 | 2.4 | 203.8 | 20.3 | 5.3 | 1.9 | 0.9 |
| STDS. | 12.3 | 5.8 | 3.4 | 2.1 | 1.2 | 19.1 | 3.4 | 2.1 | 1.3 | 0.7 |
| Ratio (107/109) | 1.2 | 1.5 | 1.8 | 2.3 | 2.7 | |||||
| t-test (107>109) | 0.0001 | 0.0002 | 0.0015 | 0.0031 | 0.0019 | |||||
| Nicolet | ||||||||||
| Avg. | 73.0 | 11.4 | 3.4 | 1.5 | 0.5 | 65.1 | 10.4 | 3.1 | 1.5 | 0.7 |
| STDS. | 9.2 | 2.9 | 2.3 | 1.4 | 0.7 | 6.7 | 2.3 | 1.1 | 1.2 | 0.8 |
| Ratio (107/109) | 1.1 | 1.1 | 1.1 | 1.0 | 0.7 | |||||
| t-test (107>109) | 0.0218 | 0.2000 | 0.3589 | 0.3679 | 0.2837 | |||||
Table 3: Size frequency for NP-ZrO2 detected by analysis (30 sec) in the St-Lawrence and Nicolet Rivers. Measurements with the isotope 90 (n=10).
| NP-ZrO2 (nm) | |||||
|---|---|---|---|---|---|
| >50 | >100 | >200 | >300 | >400 | |
| St-Lawrence | |||||
| Avg. | 1307.7 | 195.2 | 28.6 | 8.5 | 3.0 |
| STDS | 56.0 | 20.2 | 5.5 | 2.9 | 1.4 |
| Nicolet | |||||
| Avg. | 580.1 | 76.5 | 11.3 | 3.1 | 1.4 |
| STDS | 105.7 | 5.6 | 2.5 | 1.4 | 0.8 |
If it would have been only silver particles, the number of detection should have been similar between the two isotopes utilized. Measurements with isotope 107 thus have false positives due to detection of 91Zr16O and 90Zr16O1H originating from particulate Zr. Thereby, because of higher detection specificity, the isotope 109Ag was selected for NP-Ag analysis in water samples. In regular ICP-MS detection mode (ie., for total Ag concentrations), the Zr isobaric interferences have minor impacts on measured concentrations and could be simply subtracted from the total concentration as long as the Zr concentration and its correction factor are known. On the other hand, in the case of analysis by SP-ICP-MS (i.e., for NP analysis), this signal correction procedure is not possible since the signal generated by a particle is random in time. With this technique, the results are expressed as a number of NP/ml. The interference generated by the particulate Zr would thus be read as a false positive. In order to assess the maximum size of false positives, a calculation was performed based on the average of the 5 most intense pulses of Zr measured in each analysis and the rate of formation of Zr oxides determined from a solution of ionic Zr. By multiplying the average intensity by the interference factors, the intensity of the oxides was estimated for each isotope. From this, estimates of the maximum size of false positives were calculated. The thresholds were calculated for the series (n=10) of analysis performed on each sample. The means of the confidence thresholds for water in the St. Lawrence River was 56 ± 5 nm with the silver isotope 107 compared to 29 ± 2 nm for the isotope 109. In this case the error can be considerable and remember that the difference in frequency of detection of this water between the two isotopes of silver, 107 and 109, is significant (confidence level of 95%). It is advantageous to make the measurements with isotopes 109 and for this sample to consider only the measurements larger than 29 nm. In the case of the Nicolet River, the thresholds are much lower than those of the St. Lawrence River and are 38 ± 6 for the silver isotope 107 and 17 ± 3 nm for 109. The latter evaluated for the isotope 109 is near the size detection limit, 15 nm, and the Zr particles should have little impact on the analysis if the isotope 109 is selected.
Conclusions
For accurate detection of NP Ag (i.e., avoiding false positives), it is necessary to take into account the abundance of particulate Zr and to consider the likelihood of a false positive. The analysis of surface water samples by SP-ICP-MS confirmed the presence of Zr particles. This particulate Zr phase would interfere with the analysis of Ag nanoparticles and may overestimate the number and concentration of Ag particles. In order to increase the reliability of the analysis of Ag nanoparticles, the particulate Zr interference were verified for both Ag isotopes. Our results showed that for a given Zr particle the interference on the 107Ag is greater than that on 109 isotope. For greater reliability of the analysis, the isotope 109 Ag was thus selected for the analysis of NP Ag in natural water samples. The analysis of Zr by the SP-ICP-MS technique provided the maximum size of false positives to be calculated from the intensity of Zr peaks. Based on intensities of Zr pulses measured in SP-ICP-MS mode and the calculated Zr oxide content, a silver nanoparticle detection confidence limit size was estimated. Using the 109 isotope, a confidence size threshold was set as a particle size of 29 nm for the Saint-Lawerence River and 17nm for Nicolet River, river waters containing different particle load. All signals of particulate forms below this size have a probability for false positive and should not considered in final results as confirmed nanoparticulate forms. We suggest that for silver particle analysis in natural water samples by SP-ICP-MS, silver isotope 109 be preferred. In addition, a solution of Zr should be analyzed to calculate the level of interference on isotope 109 of Ag while natural waters should be analyzed for the 90Zr by SP-ICP-MS mode to determine maximum of intensities from 90Zr. Although these Zr interferences do not have potential impacts on the determination of total Ag concentrations in the two natural waters used in this study, false positive detection using SPICP- MS must be considered in the measurement of NP Ag
Acknowledgements
This work was supported by the Chemicals Management Plan (CMP) of Environment and Climate Change Canada. We appreciated the feedback and comments from M-C Sauvé, CMP Nanotechnology.
Authors’ Contributions
PT and CG designed the research. PT performed the research. PT and CG analyzed the data. PT and CG contributed the reagent/ material/analysis tools. PT and CG wrote the paper. All authors read and approved the final manuscript.
Funding
This work was supported by the Government of Canada’s Chemical Management Plan program.
Availability of Data and Materials
All data and material analyzed or generated during this investigation are included in this manuscript. The raw data can be requested by emailing: Christian.gagnon@canada.ca
Competing Interests
The authors declare that they have no competing interests.
REFERENCES
- Dale AL, Casman EA, Lowry GV, Lead JR, Viparelli E. Modeling Nanomaterial Environmental Fate in Aquatic Systems. Environ Sci Technol 2015;49(5):2587-2593.
- Musee N, Thwala M, Nota N. The antibacterial effects of engineered nanomaterials: implications for wastewater treatment plants. J Environ Monit 2011;13(5):1164-1183.
- Bruneau A, Turcotte P, Pilote M, Gagné F, Gagnon C. Fate and immunotoxic effects of silver nanoparticles on rainbow trout in natural waters. Nanomed Nanotechnol 2015; 6:3.
- Deguelde C, Favarger PY, Bitea C. Zirconia colloid analysis by single particle inductively coupled plasma–mass spectrometry. Chim Acta 2004;518:137-142.
- Tuoriniemi J, Cornelis G, Hassellöv M. Size discrimination and detection capabilities of single-particle ICP-MS for enviromental analysis of silver nanoparticles. Anal Chem 2012;84:3965-3972.
- Pace HE, Rogers NJ, Jarolimek C, Coleman VA, Higgins CP. Determining transport efficiency for the purpose of counting and sizing nanoparticles via single particle inductively coupled plasma mass spectrometry. Chemosphere 2011;83:9361–9369.
- Yang Y, Long CL Li HP, Wang W, Yang Z-G. Analysis of silver and gold nanoparticles in environmental water using single particle-inductively coupled plasma-mass spectrometry. Sci Total Environ 2016;563-564:996-1007.
- Peters RJB, Rivera ZH van Bemmel G, Marvin HJP Weigel S. Development and validation of single particle ICP-MS for sizing and quantitative determination of nano-silver in chicken meat. Anal Bioanal Chem 2014;406:3875-3885.
- May TW, Wiedmeyer RH. A table of polyatomic interferences in ICP-MS. Atomic spectroscopy 1998;19:150-155.
- Guo W, Shenghong H, Jiangyi Z, Hongfei Z. Elimination of oxide interferences and determination of ultra-trace silver in soils by ICP-MS with ion-molecule reactions. Science of the Total Environ 2011;409:2981-2986.
- Gobeil C, Rondeau B, Beaudin L. Contribution of municipal effluents to metal fluxes in the St. Lawrence river. Sci Technol 2005;39:456-464.
- Pokrovsky OS, Viers J, Shirokova VP, Filipov AS, Dupré B. Dissolved, suspended and colloidal fluxes of organic carbon, major and trace elements in the Severnaya Dvina river and its tributary. Chemical Geology 2010;273:136-149.
- APHA, AWWA, WEF, DE. Standard Methods for the Examination of Water and Waste Water. 3-45, 20th Ed. American public Health Association, American water work Association and Water Environmental Federation Washington, DC 1998.
- Mitrano DM, Lesher EK, Bednar A, Monserud J, Higgins CP. Detecting nanoparticle silver using single-particle inductively coupled plasma-mass spectrometry. Environmental Toxicology and Chemistry 2012;31(1):115-121.
- Godfrey LV, Field MP, Sherrel RM. Estuarine distributions of Zr, Hf and Ag in the Hudson River and the implication for their continental and anthropogenic sources to seawater. Geophys Geosystem 2008;9(12):Q12007.
- Lee S, Bi X, Reed RB, Rainville JF, Herckes. Nanoparticle size detection limits by single particle ICP-MS for 40 elements. Environ Sci Technol 2014;48:10291-10300.
Citation: Turcotte P, Gagnon C (2020) Zirconium Interferences on the Detection of Silver Nanoparticles by Single Particle Icp-Ms: Implications on Natural Water Analysis. J Nanomed Nanotech. 11:550. doi: 10.35248/2157-7439.20.11.550
Copyright: © 2020 Turcotte P, et al. This is an open-access article distributed under the terms of the Creative Commons Attribution License, which permits unrestricted use, distribution, and reproduction in any medium, provided the original author and source are credited.
