PMC/PubMed Indexed Articles
Indexed In
- Open J Gate
- The Global Impact Factor (GIF)
- Open Archive Initiative
- VieSearch
- International Society of Universal Research in Sciences
- China National Knowledge Infrastructure (CNKI)
- CiteFactor
- Scimago
- Ulrich's Periodicals Directory
- Electronic Journals Library
- RefSeek
- Directory of Research Journal Indexing (DRJI)
- Hamdard University
- EBSCO A-Z
- Publons
- Google Scholar
Useful Links
Share This Page
Journal Flyer
Open Access Journals
- Agri and Aquaculture
- Biochemistry
- Bioinformatics & Systems Biology
- Business & Management
- Chemistry
- Clinical Sciences
- Engineering
- Food & Nutrition
- General Science
- Genetics & Molecular Biology
- Immunology & Microbiology
- Medical Sciences
- Neuroscience & Psychology
- Nursing & Health Care
- Pharmaceutical Sciences
Original Research Article - (2021) Volume 11, Issue 6
Water Quality Assessment of Groundwaters (Hand-Dug Wells) in Abeokuta North Local Government, Nigeria
Falola TO1*, Adetoro IO and Idowu OA32Student at Federal University of Technology, Akure, Nigeria
3Nigeria Department of Biological Sciences, University of Agriculture, Abeokuta, Nigeria
Received: 29-May-2021 Published: 28-Jun-2021, DOI: 10.35248/2252-5211.21.11.414
Abstract
Groundwater is the major source of water for municipal use in the AbeokutaNorth Local Government of Nigeria. However, there is a tendency for its quality to deviate from recommended standards as most groundwater sources are close to regions prone to erosion and most well are not usually covered. The tragedy is that the adverse effect might creep into the ecosystem and affects humanity if a regular check on the quality is not been made. The Geographical location and altitude of each well location were taken using Global Positioning System (GPS). The moderate PH range (6.30-7.36) can be linked to low values of TDS (352 mg/L) and EC (695 ms/cm) which are within the standard recommended for drinking- indicate a low concentration of salt contents. The relationship between the parameters shows a direct trend with the hydraulic head. Hence, groundwater sources (wells) in Abeokuta North Local Government are good for drinking.
Keywords
Groundwater; Abeokuta North; Global Positioning System; PH; Total DissolvedSolid; Electrical conductivity; Hydraulic head; W.H.O
Introduction
Water is essential for sustainability of life; its continuous supply is important to improvise for the fluid lost during respiration, perspiration, and urination [1]. Among other places water can be found is beneath the soil, which is known as groundwater. Groundwater refers to water found in rocks and fractures beneath the earth. It includes all water found beneath the earth’s surface. It is part of the earth’s natural hydrological cycle. It is the body of water derived primarily from percolation and contained in pore spaces of a permeable rock [2].
It could be formed via natural precipitation from infiltration or indirectly from rivers, and it represents the water in the rocks and fissures of a particular geological formation [3]. The traditional method of obtaining groundwater in rural areas of the developing world, and still the most common, is by means of hand-dug wells. However, because they are dug by hand, their use is restricted to suitable types of ground such as clays, sands, gravels, and mixed soils where only small boulders are encountered. Some communities use the skill and knowledge of local well-diggers, but often the excavation is carried out, under supervision, by the villagers themselves. Also, leaching from waste dumps and industries makes them susceptible to contamination due to run offs into groundwater [4].
Water quality describes the physical, chemical, and microbiological characteristics of water. These properties collectively determine the overall water quality and the fitness of the water for a specific use. These properties are either intrinsic to the water or are the result of substances that are dissolved or suspended in the water. According to Annan [5], we cannot live without water and municipal activities can impact its quality and quantity. Fresh groundwater is associated with recharge areas, whilst groundwater is more mineralized.
The United Nation goal of access to safe drinking water especially in developing countries is frequently under threat due to an occurrence of pollutants such as radionuclides in drinking water which do pose a serious health hazard [6]. PH is one of the most important water quality parameters, although, it has no direct impact on consumers. Lower-PH water is likely to be corrosive. Corrosion can contaminate water and have adverse effects on its taste and appearance [7].
The PH in the range 6.5-8 is usually acceptable, although the nature of the construction materials used in the distribution system as well as the composition of the water both lower and increase this parameter [8]. In an extreme case, a surge the PH value could be because of accidental spills, treatment breakdowns and insufficiently cured cement mortar pipe linings, among others [9].
In the same vein, over-mineralization of groundwater lowers water quality giving an objectionable taste, odor and excessive hardness [10]. Water contamination needs to be avoided because the quality of the water of the aquifer would be difficult to restore, afterward [11]. Aquifer source depth plays an important role in determining the thermal buffering capacity and waters quality ofgroundwater [12]. The depth and shallowness of groundwater also play important roles in land-use changes and surface contamination [13]. That said, the two factors tend to have different chemical properties [14].
Although, groundwater is naturally referring to as been safe for drinking. However, the quality does vary due to differences in associated rock type and within aquifers along groundwater flow paths [15]. Also, human activities might have effect on the water source overtime. Furthermore, according to UNDESA [16], the quality of surface or groundwater is depending on either or both the natural and human influences.
Therefore, periodic checking of the quality of groundwater is important to develop a strong database for future water resources strategic planning and development [17]. Many researchers have reported the quality of groundwater in different parts of Nigeria. However, no study has been conducted on the groundwater quality in Abeokuta North Local Government.
Well water is one of the major sources of water supply to the entire populace of Abeokuta North Local government and its environ, owing to the fact that, there is inadequate supply of pipe-borne water from the water works and boreholes. The boreholes found there are very scarce because it is expensive to construct when compared to the average standard of living of people living in the area. The geology formation of this Local government is the Basement Complex which is very difficult to drill due to the rocks beneath this formation.
This study, therefore, became necessary to ascertain the quality of the wells and Invariably its suitability for various purposes, to ensure the protection of the health of Users and determine liable sources of pollution. The information will be of great importance to relevant authorities. This study will serve as database for future research works in water quality assessment of Hand-dug wells in the Study area and influence decision making with regards to future groundwater development.
The wells located are not properly maintained due to lack of information of maintenance procedures like consistent closing of the cover, rinsing of the drawers before dipping inside wells, et cetera. Also, most wells in the study area are sited close to regions prone to erosion because of poor drainage system. The aim of this Novel research work is to measure and determine the Relationship between Electrical Conductivity (EC), Total Dissolved Solids (TDS), PH and Temperature in wells in Abeokuta North Local Government Area so as to ascertain whether or not the quality of water in this area is within standard recommended by World Health Organization.
Materials and Methods
Materials Used: Rope,Distilled water, Toilet Roll, drawer, TDS/ PH meter
Data Collection
Groundwater samples were collected and analysed in-situ (on site) from thirty-six (36) hand-dug wells around Abeokuta North Local government area. The Geographical location of all the wells was obtained using a GPS, the areas of location of each well was also recorded, and the time it was recorded was also obtained. The altitude of each location of the wells was also obtained using the GPS. The depth of the wells was obtained and the height of apron (ring above the ground surface). The depth of the well was gotten by immersing a Water drawer (rubber) inside the well and a pin is used to spot the location when the rope attached to the drawer starts sagging. The sagging of the rope indicates that the drawer has reached the bed. The measuring tape was then used in measuring the point located on the rope to the drawer and the readings taken and recorded.
The Temperature of the samples of water collected from the well was also obtained and this was done using the pH/TDS meter. The value obtained was recorded immediately after insertion to know the actual temperature of the water in that location because it varies depending on the location.
Groundwater samples taken from the wells were tested and analysed immediately after collection. The samples were analysed for explained below.
Method of Analysing Physicochemical Parameters
PH
This is the measure of acidity/alkalinity of water. The Instrument for pH determination is PH/TDS meter. The water in the well was drawn and the pH meter to be used was first cleaned with distilled water to remove particles that may be have remained after the previous use. It was inserted inside the drawer with the water. Immediately after insertion there appears a clockon the surface of the meter indicating that the water is still been tested. The result obtained is being recorded immediately the clock disappears which shows that is the required result.
Electrical Conductivity
It is the measure of the dissolved ionic component in water, the latter which signifies the electrical properties[18]. The measurement was taken with the help of pH/TDS meter. The water in the well was drawn and the pH meter to be used was first cleaned with distilled water to remove particles that may have remained after the previous use. It was inserted inside the drawer with the water and immediately after insertion there appears a clock on the surface of the meter indicating that the water is still been tested. The result obtained is being recorded immediately the clock disappears which shows that is the required result.
Total Dissolved Solids
This represents the dissolved minerals or substances in water. It was measured with the help of PH/TDS meter. The water in the well was drawn and the pH meter to be used was first cleaned with distilled water to remove particles that may have remained after the previous use. It was inserted inside the drawer with the water and immediately after insertion there appears a clock on the surface of the meter indicating that the water is still been tested. The result obtained is being recorded immediately the clock disappears which shows that is the required result.
Study Area
The Study Area is Abeokuta North Local government which lies on latitude 7°10´N and longitude 3°40´E and it has a landed area of 808 km2 (312 square miles). Its Headquarters is in the town of Akomoje near Abeokuta. It is bounded to the west by Yewa North Local government and to the east by Abeokuta South Local government and to the North by Odeda Local government and to the South by Ewekoro Local government. The average temperature and precipitation are 27.1 °C and 1238mm respectively (Figures 1 and 2) [19,20].
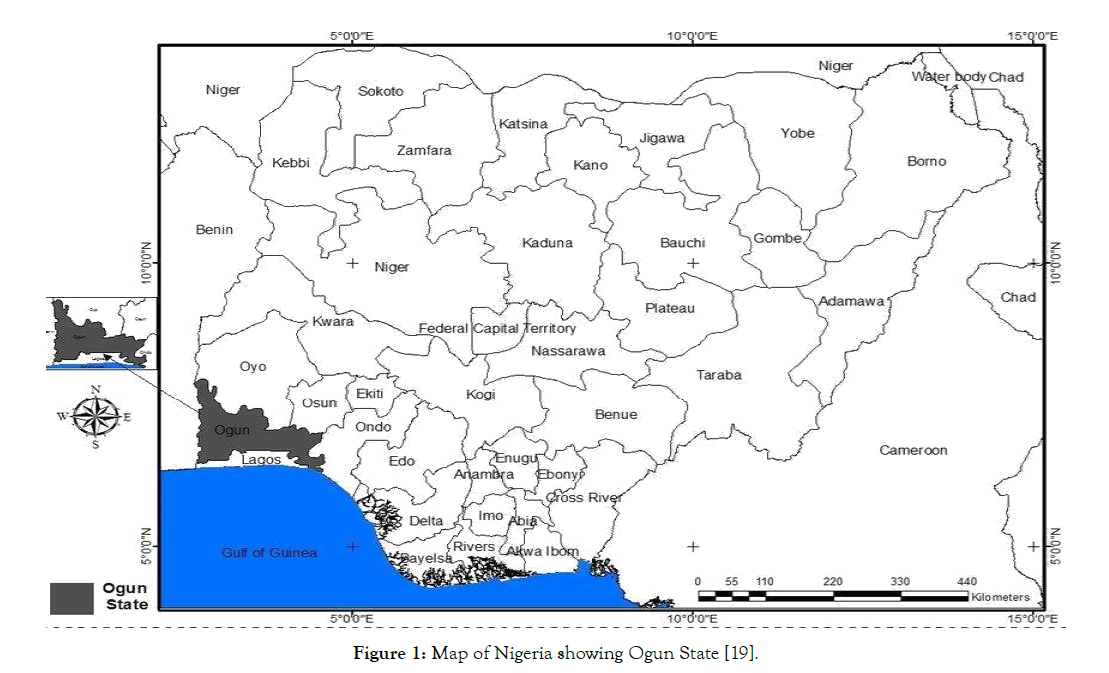
Figure 1: Map of Nigeria showing Ogun State [19].
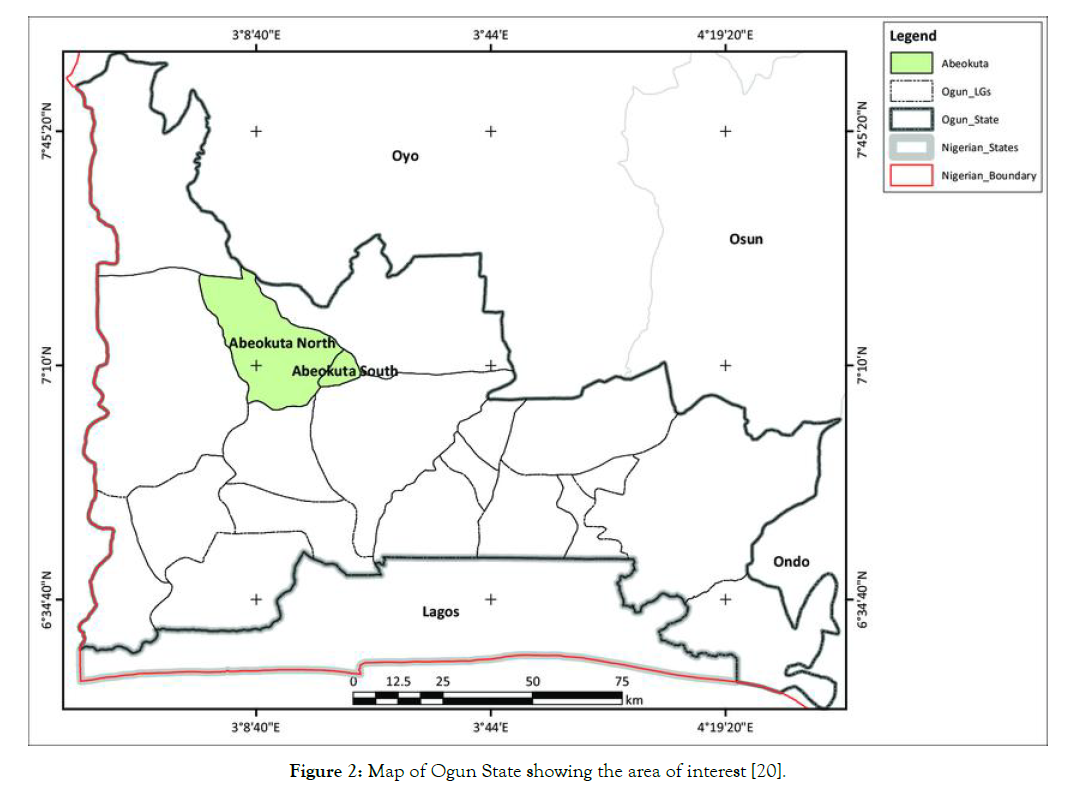
Figure 2: Map of Ogun State showing the area of interest [20].
Results and Discussions
The Table 1 represents the values obtained for the parameters under study for wells present in each subunit of the local government. The number of well varies from one region to the other (Figures 3-6).
| S/N | X | LAT | LONG | ALT(m) | PH | TDS(ppm) | EC(ms/cm) | TEMP (‘c) | SWL (m) | TD (m) | H (m) | (Alt - SWL) (m) |
|---|---|---|---|---|---|---|---|---|---|---|---|---|
| 1 | SABO | 3’19’ | 7’09’’ | 64 | 6.53 | 480 | 953 | 26.8 | 2.41 | 5.5 | 1.2 | 61.59 |
| ’467 | 455 | |||||||||||
| 2 | 3’19’ | 7’09’’ | 64 | 6.35 | 394 | 798 | 28.5 | 3.42 | 3.5 | 0.46 | 60.58 | |
| ’416 | 450 | 2 | ||||||||||
| 3 | 3’19’ | 7’09’’ | 64 | 6.74 | 466 | 932 | 27.3 | 1.56 | 2.9 | 0.14 | 62.44 | |
| ’410 | 418 | 4 | ||||||||||
| 4 | 3’19’ | 7’9’’4 | 64 | 6.76 | 321 | 641 | 27.2 | 2.17 | 6.6 | 0.79 | 61.83 | |
| ’408 | 22 | 0 | ||||||||||
| 5 | 3’19’ | 7’09’’ | 64 | 6.89 | 499 | 996 | 27.2 | 5.87 | 7.9 | 0.71 | 58.13 | |
| ’423 | 399 | 2 | ||||||||||
| 6 | 3’19’ | 7’09’’ | 64 | 6.92 | 575 | 114 | 27 | 1.29 | 2.1 | 0.18 | 62.71 | |
| ’419 | 417 | 9 | 1 | |||||||||
| 7 | LAFE | 3’19’ | 7’09’’ | 64 | 7.08 | 558 | 111 | 27.3 | 2.34 | 3,2 | 0.5 | 61.66 |
| NWA | ’524 | 183 | 5 | 6 | ||||||||
| 8 | 3’19’ | 7’09’’ | 64 | 7.20 | 360 | 722 | 27.2 | 0.73 | 5.4 | 0.37 | 63.27 | |
| ’530 | 170 | 3 | ||||||||||
| 9 | 3’19’ | 7’09’’ | 64 | 7.15 | 503 | 100 | 27.8 | 2.81 | 4.3 | 0.72 | 61.19 | |
| ’528 | 148 | 5 | 7 | |||||||||
| 10 | 3’’19 | 7’09’’ | 64 | 7.10 | 496 | 987 | 28.6 | 1.12 | 3.2 | 0.19 | 62.88 | |
| ’’530 | 144 | 1 | ||||||||||
| 11 | 3’19’ | 7’09’’ | 64 | 7.00 | 472 | 945 | 27.4 | 1.38 | 4.5 | 0.75 | 62.62 | |
| ’520 | 085 | 4 | ||||||||||
| 12 | 3’19’ | 7’09’’ | 64 | 7.19 | 381 | 757 | 27.8 | 3.24 | 4.3 | 0.52 | 60.76 | |
| ’598 | 144 | 1 | ||||||||||
| 13 | TOTO | 3’19’ | 7’09’’ | 64 | 6.86 | 421 | 841 | 27.4 | 1.8 | 1.1 | 0.65 | 62.20 |
| RO | ’978 | 272 | 8 | |||||||||
| 14 | 3’19’ | 7’09’’ | 64 | 7.13 | 333 | 666 | 27.4 | 3.15 | 4.6 | 0.67 | 60.85 | |
| ’923 | 356 | 0 | ||||||||||
| 15 | GBAG | 3’20’ | 7’’09’ | 64 | 7.05 | 430 | 857 | 26.8 | 1.12 | 2.0 | 0.18 | 62.88 |
| URA | ’035 | ’356 | ||||||||||
| 16 | IKER | 3’19’ | 7’09’’ | 64 | 6.93 | 432 | 866 | 27.3 | 2.34 | 3.4 | 0.58 | 61.66 |
| EDU | ’770 | 331 | 5 | |||||||||
| IDAN | ||||||||||||
| 17 | 3’19’ | 7’09’’ | 64 | 6.87 | 449 | 899 | 28.7 | 3.14 | 5.4 | 1.43 | 60.86 | |
| ’772 | 348 | 1 | ||||||||||
| 18 | ITA- | 3’18’ | 7’08’’ | 64 | 7.25 | 253 | 504 | 27.6 | 1.66 | 3.4 | 0.37 | 62.34 |
| OSHI | ’307 | 139 | 4 | |||||||||
| N | ||||||||||||
| 19 | 3’18’ | 7’08’’ | 64 | 7.36 | 152 | 300 | 26.2 | 1.52 | 2.5 | 0.22 | 62.48 | |
| ’339 | 083 | 5 | ||||||||||
| 20 | 3’18’ | 7’08’’ | 64 | 6.91 | 202 | 407 | 27.4 | 1.33 | 3.7 | 0.64 | 62.67 | |
| ’358 | 047 | 5 | ||||||||||
| 21 | 3’18’ | 7’08’’ | 64 | 6.92 | 301 | 596 | 27.0 | 1.33 | 4.0 | 0.86 | 62.67 | |
| ’374 | 033 | 7 | ||||||||||
| 22 | 3’18’ | 7’08’’ | 64 | 7.13 | 318 | 337 | 28.8 | 7.25 | 7.5 | 0.55 | 56.75 | |
| ’409 | 008 | 6 | ||||||||||
| 23 | 3’18’ | 7’07’’ | 64 | 7.29 | 140 | 280 | 27.4 | 2.97 | 13. | 0.61 | 61.03 | |
| ’355 | 936 | 05 | ||||||||||
| 24 | 3’18’ | 7’07’’ | 64 | 7.04 | 212 | 425 | 27.4 | 0.29 | 3.3 | 0.72 | 63.71 | |
| ’325 | 934 | 1 | ||||||||||
| 25 | 3’18’ | 7’07’’ | 64 | 7.21 | 157 | 314 | 27.2 | 1.64 | 6.2 | 0.30 | 62.36 | |
| ’295 | 935 | 4 | ||||||||||
| 26 | IBER | 3’20’ | 7’11’’ | 62 | 6.95 | 389 | 773 | 26.0 | 2.74 | 4.0 | 0.00 | 59.26 |
| EKOD | ’298 | 031 | 0 | |||||||||
| O | ||||||||||||
| 27 | 3’20’ | 7’11’’ | 60 | 7.16 | 379 | 759 | 26.4 | 2.46 | 4.1 | 1.04 | 57.54 | |
| ’438 | 013 | 0 | ||||||||||
| 28 | 3’20’ | 7’11’’ | 60 | 7.17 | 350 | 696 | 26.9 | 2.65 | 4.2 | 1.25 | 57.35 | |
| ’438 | 013 | 8 | ||||||||||
| 29 | 3’20’ | 7’11’’ | 69 | 7.12 | 150 | 314 | 28.6 | 0.32 | 0.9 | 0.05 | 68.68 | |
| ’511 | 110 | 8 | ||||||||||
| 30 | 3’20’ | 7’11’’ | 63 | 7.09 | 242 | 485 | 28.4 | 1.11 | 2.1 | 0.82 | 61.89 | |
| ’508 | 130 | 4 | ||||||||||
| 31 | 3’20’ | 7’11’’ | 55 | 7.12 | 205 | 412 | 28.6 | 2.48 | 4.1 | 0.70 | 52.52 | |
| ’365 | 215 | 0 | ||||||||||
| 32 | AKO | 3’20’ | 7’11’’ | 49 | 7.10 | 250 | 506 | 27.8 | 2.12 | 3.2 | 1.21 | 46.88 |
| MOJE | ’350 | 293 | 5 | |||||||||
| 33 | 3’20’ | 7’10’’ | 65 | 7.08 | 456 | 914 | 29.2 | 5.00 | 5,0 | 1.49 | 60.00 | |
| ’510 | 826 | 4 | ||||||||||
| 34 | ELEG | 3’20’ | 7’11’’ | 94 | 7.16 | 340 | 680 | 28.7 | 3.70 | 4.8 | 1.00 | 89.13 |
| A | ’800 | 024 | 7 | |||||||||
| 35 | AGO- | 3’20’ | 7’10’’ | 57 | 7.20 | 364 | 730 | 28.5 | 5.67 | 7.3 | 1.00 | 49.70 |
| ODO | ’284 | 271 | 0 | |||||||||
| 36 | 3’20’ | 7’10’’ | 42 | 7.12 | 255 | 450 | 28.2 | 2.23 | 2.5 | 0.78 | 39.49 | |
| ’382 | 401 | 1 |
Lat= Latitude; Long=Longitude; Alt= Altitude; TDS: Total Dissolved Solid; EC= Electrical Conductivity; SWL= Shallow Depth Length; TD= Total Depth; (Alt-SWL) = Hydraulic head; H= Height of Apron.
Table 1: The results obtained for the water quality parameters.
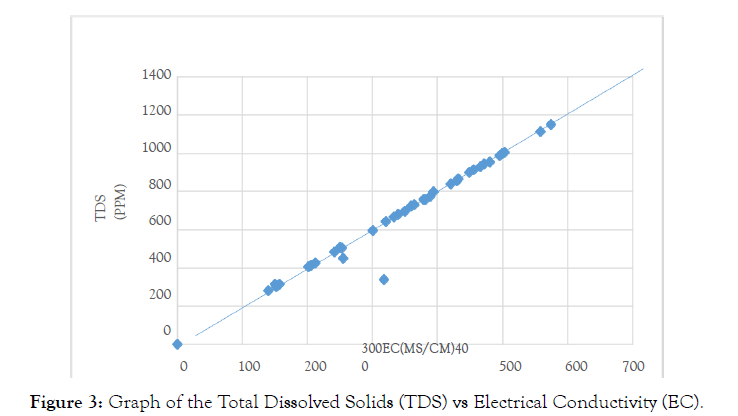
Figure 3: Graph of the Total Dissolved Solids (TDS) vs Electrical Conductivity (EC).
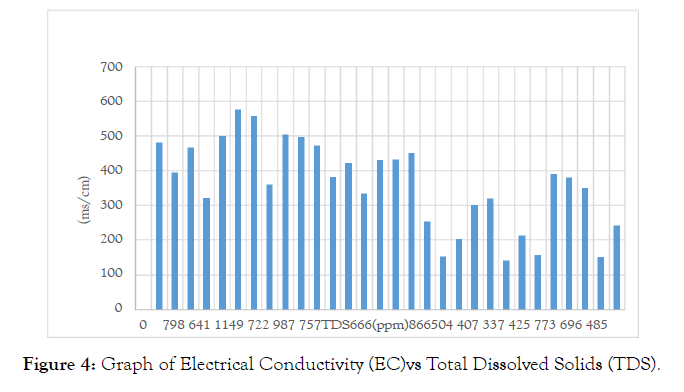
Figure 4: Graph of Electrical Conductivity (EC)vs Total Dissolved Solids (TDS).
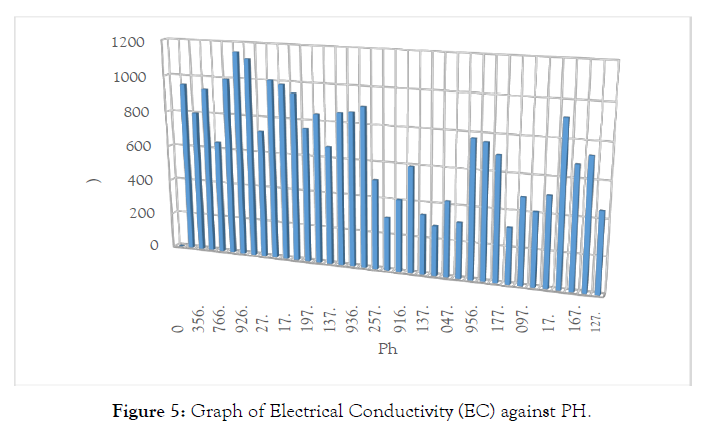
Figure 5: Graph of Electrical Conductivity (EC) against PH.
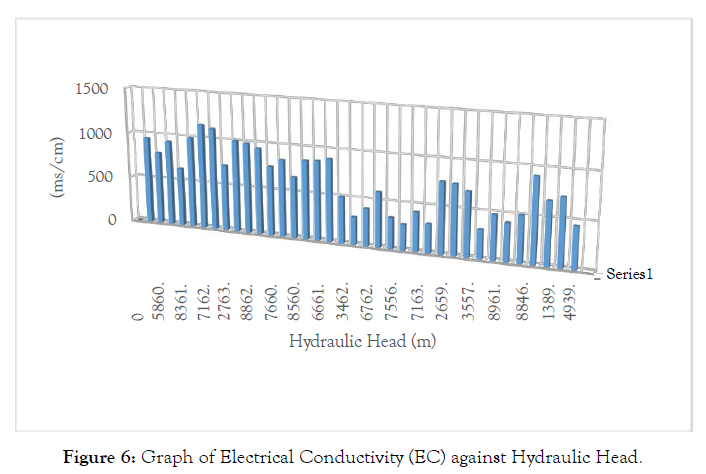
Figure 6: Graph of Electrical Conductivity (EC) against Hydraulic Head.
Discussion
From the results obtained the relationship between conductivity and total dissolved solid TDS are observed as follows.
Temperaturevalues is not beyond what is expected of a tropical rain-forest region. It ranges from 26.0 to 29.2°C with an average of 27.6°C. This ambient temperature is good for consumption. It is important that the temperature is not too high, to prevent microbial growth, which might lead to unpleasant taste, odor, color, and corrosion issues [21].
It was observed that a straight-line graph was obtained; that is, increase in the Electrical conductivity led to an increase in the Total Dissolved solids found in the area. However, both the Total Dissolved Solid and Electrical Conductivity are within the World Health Organization's recommendation of 300-1200 mg/L and 500-1000 ms/cm respectively. The average values are approximately 352 mg/L and 695 ms/cm, in the same sequence. As a result, the water in the surveyed region can be said to have a relatively low salt concentration. This suggest a very minute solute dissolution, quick ion-exchange between the water and soil, or probably due to the presence of an insoluble rock and minerals [18]. The low value of TDS can be attributed to the mountainous characteristics of the area under study. Hence, it is for good for both human and animal consumption. The water samples meet the requirement of "fresh water" and can be used for irrigation purposes as this would not affect the osmotic pressure of soil solution, [22].
From the results obtained and shown in the graph it was discovered that relationship between EC and the hydraulic head shows a direct trend likewise with the PH.
The PH range from the results (6.30-7.36) is within the WHO recommendation for drinking water of 6.5-8.5. At 8.0 and above, might be of a disadvantage when an attempt to disinfect and treat such water source is made [21].
It shows and identifies that an increase in the EC gives rise to an increase in the PH and the hydraulic head. It was discovered that there was more increase in the Hydraulic head at a specific EC values in the area. This was also shown in the EC against the PH values obtained and Plotted [23-26].
The graph above certifies that there is a direct link between the PH, EC, TDS, and the Hydraulic head. The relationship and the evaluation conclude these parameters have a significant determination about quality of water that is available in an area. In the light of this, the above values correspond with World Health Organization recommendation for groundwater.
Conclusion
The quality of water obtained from the sampled wells in the study area does not differ significantly among themselves. This might be attached to the fact that the samples were taken in the same geographical locations and are prone to similar contaminations. Graph plotted shows that the relationship between the EC, TDS, PH, Hydraulic-Head parameters shows an insignificant Positive correlation indicating increase in the parameters as the other increases, but all are within the recommendation of WHO standards for water quality. This can be interpreted to mean that groundwater sources (wells) in Abeokuta North Local Government are good for drinking.
Recommendations
From the study, the following recommendations could be prescribed for safe and healthy delivery of potable water.
• The well users should be conscious of adequate sanitation of the well and its environment like covering of the well and proper casing to improve the physical and chemical properties of the water.
• An impervious apron should be constructed around the well mouth to prevent seepage and intrusion of surface water from entering the well to provide a comparatively dry platform for the well users.
• Activities such washing, cooking must not be done around the well to prevent contamination.
• Stable and constant fetching equipment for abstraction must be assigned to every well to prevent contamination that occurs because of different fetching equipment being used by Individuals on the same well.
Competing Interests
The authors declare no competing interest
REFERENCES
- Murray CJ, Lauer JA, Hutubessy RC, Niessen L, Tomijima N, Rodgers A, et al. Effectiveness and costs of interventions to lower systolic blood pressure and cholesterol: a global and regional analysis on reduction of cardiovascular-disease risk. The Lancet. 2003;361(9359):717-725.
- Adekunle AA, Badejo AO, Oyerinde AO. Pollution studies on ground water contamination: water quality of Abeokuta, Ogun State, southwest Nigeria. J Environ Earth Sci. 2013;3(5):161-166.
- Saeed TU, Khan D. Assessment and conservation of groundwater quality: A challenge for agriculture. Current Journal of Applied Science and Technology. 2014;1256-1272.
- Mahananda HB, Mahananda MR, Mohanty BP. Studies on the physico-chemical and biological parameters of a fresh water pond ecosystem as an indicator of water pollution. Ecology environment and conservation. 2005;11(3/4):537-541.
- Annan KA. Message on world Environment Day“Water:Two Billion PeopleAre Dying for It!” -– highlights the centrality of water to human survival and sustainable development. World health Organization secretary general of the unitednations. Press Release SG/SM/8707; OBV/348. 2003.
- Damla N, Çevik UĞ, Karahan GK, Kobya AI. Gross α and β activities in tap waters in Eastern Black Sea region of Turkey. Chemosphere. 2006;62(6):957-60.
- Jimmy DH, Sundufu AJ, Malanoski AP, Jacobsen KH, Ansumana R, Leski TA, et al. Water quality associated public health risk in Bo, Sierra Leone. Environmental monitoring and assessment. 2013;185(1):241-51.
- WHO. PH in Drinking-water Revised background document for development of WHO Guidelines for Drinking-water Quality. 2007.
- WHO. Guidelines for drinking water quality: Recommendation, 3rd Edition, WHO, Geneva Switzerland.2006.
- Bhatia SC. Environmental Pollution and Control in the chemical process.2009.
- Aljaradin M, Persson KM. Municipal Landfilling Practice and Its Impact on the Water Resources-Jordan. World Environment. 2014;4(5):213-218.
- Hare DK, Helton AM, Johnson ZC, Lane JW, Briggs MA. Continental-scale analysis of shallow and deep groundwater contributions to streams. Nature communications. 2021 Mar 4;12(1):1-0.
- Thompson TJ, Briggs MA, Phillips PJ, Blazer VS, Smalling KL, Kolpin DW, Wagner T. Groundwater discharges as a source of phytoestrogens and other agriculturally derived contaminants to streams. Science of The Total Environment. 2021;755:142873.
- Zhi W, Li L. The shallow and deep hypothesis: Subsurface vertical chemical contrasts shape nitrate export patterns from different land uses. Environmental Science & Technology. 2020;54(19):11915-28.
- MacDonald AM, Calow RC. Developing groundwater for secure rural water supplies in Africa. Desalination. 2009;248(1-3):546-56.
- UNDESA. Water quality: International decade for action 'water for life' 2005-2015. United Nations Department of Economics and Social Affairs, New York, USA.2001.
- Al-Harbi OA, Hussain G, Khan MM, Moallim MA, Al-Sagaby IA. Evaluation of groundwater quality and its recharge by isotopes and solute chemistry in WadiMalal, Al-Madinah Al-Munawarah, Saudi Arabia. 2006.
- Oyem HH, Oyem IM, Ezeweali D. Temperature, pH, electrical conductivity, total dissolved solids and chemical oxygen demand of groundwater in Boji-BojiAgbor/Owa area and immediate suburbs. Research Journal of Environmental Sciences. 2014 ;8(8):444.
- Oladehinde GJ, Olayiwola LM, Popoola KO. Land accessibility constraints of migrants in rural border settlements of Ogun State, Nigeria. Environmental & Socio-economic Studies. 2018;6(1):46-56.
- Baloye DO, Palamuleni LG. Modelling a critical infrastructure-driven spatial database for proactive disaster management: A developing country context. Jàmbá: Journal of Disaster Risk Studies. 2016;8(1).
- UNICEF. UNICEF Handbook on Water Quality. United Nations Children's Fund (UNICEF), New York, USA.2008: 179.
- Shahidullah SM, Hakim MA, Alam MS, Shamsuddoha AT. Assessment of groundwater quality in a selected area of Bangladesh. Pakistan J Biol Sci (Pakistan). 2000.
- Adeyemi O, Oloyede OB, Oladiji AT. Physicochemical and microbial characteristics of leachate-contaminated groundwater. Asian J Biochem. 2007;2(5):343-348.
- Gupta JJ, Bardoloi RK, Reddy PB, Anubrata D. Performance of crossbred pigs fed on raw and boiled sweet potato tuber at various levels at different stages of growth. Indian Journal of Animal Sciences. 2009;79(7):696-9.
- Rajankar PN, Gulhane SR, Tambekar DH, Ramteke DS, Wate SR. Water quality assessment of groundwater resources in Nagpur Region (India) based on WQI. E-J Chemistry. 2009;6(3):905-8.
- UNEP Global Environment outlook. GEO Data Portal- UNEP/GEO Core Indicators.2006.
Citation: Falola TO, Adetoro IO, Idowu OA (2021) Water Quality Assessment of Groundwaters (Hand-Dug Wells) in Abeokuta North Local Government, Nigeria, Int J Waste Resour 11: 414. doi: 10.35248/2252-5211.21.11.414
Copyright: © 2021 Falola TO, et al. This is an open access article distributed under the terms of the Creative Commons Attribution License, which permits unrestricted use, distribution, and reproduction in any medium, provided the original work is properly cited.
