Indexed In
- Genamics JournalSeek
- RefSeek
- Hamdard University
- EBSCO A-Z
- OCLC- WorldCat
- Publons
- Euro Pub
- Google Scholar
Useful Links
Share This Page
Journal Flyer

Open Access Journals
- Agri and Aquaculture
- Biochemistry
- Bioinformatics & Systems Biology
- Business & Management
- Chemistry
- Clinical Sciences
- Engineering
- Food & Nutrition
- General Science
- Genetics & Molecular Biology
- Immunology & Microbiology
- Medical Sciences
- Neuroscience & Psychology
- Nursing & Health Care
- Pharmaceutical Sciences
Research - (2024) Volume 13, Issue 5
Topological Machine Learning and Chaotic Attractors Decomposition–An Application to Sunspot Chaos
Carlos Pedro Gonçalves*Received: 06-Aug-2024, Manuscript No. SIEC-24-26704; Editor assigned: 08-Aug-2024, Pre QC No. SIEC-24-26704 (PQ); Reviewed: 22-Aug-2024, QC No. SIEC-24-26704; Revised: 29-Aug-2024, Manuscript No. SIEC-24-26704 (R); Published: 05-Sep-2024, DOI: 10.35248/2090-4908.24.13.387
Abstract
We apply new empirical methods from chaos theory, aimed at dealing with stochastic chaos, employing adaptive topological artificial intelligence and topological data analysis to sunspots’ data for attractor reconstruction analysis and dynamical process decomposition. Applying these methods to sunspots’ data we uncover not one but two low-dimensional chaotic attractors, a first dominant attractor that is linked to a strongly persistent process with self-organized criticality and multifractal signatures, and a second chaotic attractor that exhibits intermittent turbulence and anti-persistent multifractal signatures, also present is a third process with an autoregressive moving average structure and an Independent and Identically Distributed (IID) noise component. In this way, the main emergent dynamics associated with the sunspots’ data are researched in detail down to the IID noise component.
Keywords
Adaptive topological artificial intelligence; Machine learning; Chaos theory; Synergetics; Stochastic chaos; Self- organized criticality
Introduction
Sunspots result from localized rises in solar magnetic activity leading to a decrease in the surrounding atmospheric pressure of these localized regions and a decrease in temperature, the strong magnetic field effectively inhibits the flow of hot gas from the sun’s interior to the surface leading to a localized decrease in the relative temperature of these regions which show up as what we call “sunspots”, comprised of a localized darker region in the sun’s photosphere, called the umbra, surrounded by a lighter region, called the penumbra [1,2].
Sunspots are of particular interest not only for understanding solar dynamics but also because the interaction between the localized high intensity magnetic field and the plasma may lead to mass ejections and solar flares occurring near sunspots, with potential consequences for space-based assets and Earth’s communications [1-4].
Two dynamics have been identified as present in the sunspots’ data, one is Self- Organized Criticality (SOC), which is characterized by power law scaling in the power spectra and by power law scaling in the frequency of events’ distributions, the other dynamics identified in sunspots’ data is low-dimensional chaos [5-10].
While the early theory of SOC conjectured that chaos could not lead to SOC, this conjecture was found not to hold as shown in [11], where chaos was identified in a self- organized critical system, other works since then have showed evidence both in theoretical models and in empirical works of the markers and process of chaos- induced SOC, in both high-dimensional and low-dimensional attractors [11-16].
A formal point, regarding the mathematical models, needs, however, to be raised, specifically, flows described by differential equations cannot lead to SOC because the trajectories of the state variables exhibit smooth differentiable curves, while fractal and multifractal signals are not differentiable, which means that, mathematically, fractal and multifractal signals, associated with chaotic dynamics, either results from discrete time equations, that is, nonlinear maps or, in the case of continuous time models, it can only occur for stochastic chaos, which means that one would need to work with stochastic differential equations.
Empirically, chaos-induced SOC in complex systems corresponds to dynamics where the markers of SOC result from the emergent chaotic dynamics itself [15,16].
In complex systems that are open, nonlinearly interacting and sustained far-from- equilibrium, attractors with different dynamics can emerge as a consequence of self- organization far-from- equilibrium in the thermodynamic sense, in this case, dynamical attractors can emerge at the macro level, with specific geometric and topological properties, sustained by the micro level dynamics, a phenomenon that has been extensively addressed within synergetics [6,17].
Our main point of the present work, while focused on the sunspots’ data, is a methodological one, namely, to address the need for research beyond a reconstructed attractor when dealing with chaos in empirical research involving complex systems, since such systems can exhibit multiple emergent attractors and complex noise processes for the same time series, in particular, if fractal or multifractal signatures are found in the residuals after a filtering out a chaotic attractor, one must research whether these signatures are induced by another underlying chaotic dynamics or are the result of a stochastic process characterized by fractal or multifractal scaling.
In the case of emergent strange chaotic attractors, either low or high- dimensional, the phase space dimensionality for these attractors corresponds to a number of emergent macroscopic degrees of freedom that can be addressed as macro level order parameters in Haken’s sense [17].
While the emergence of low-dimensional chaotic attractors as dominant in an open complex system’s dynamics constitutes an example of Haken’s slaving principle, there is a specific feature of chaos that is important to consider, indeed, the principle no longer holds with respect to those lower number of degrees of freedom themselves, this point is addressed by Haken in [17], when the author recognizes that, while the Lorenz equations result from the slaving principle, one can no longer apply that same principle in the chaotic regime for the Lorenz equations themselves.
In this case, Haken identified that, when the steady-state solution for these equations becomes unstable, there are two unstable modes and one stable mode, however, in the chaotic regime, the stable mode is destabilized and cannot be slaved so that the slaving principle fails with respect to those equations, a point argued and demonstrated by Haken in [17].
This is a major point that has two implications regarding the emergence of chaotic attractors in complex systems, the first implication is that there is an emergence of a few macroscopic “order parameters” that are effectively sustained by the system’s dynamics, and that correspond to the number of active macroscopic degrees of freedom.
The second implication is that there is a limit to the adiabatic reduction method employed in synergetics, namely, the emergent order parameters, associated with the chaotic attractor, are irreducible with respect to the above-mentioned adiabatic reduction method, leading to a failure of the slaving principle’s methodological application to the emergent active degrees of freedom associated with the chaotic attractors themselves.
Thus, while an emergent low-dimensional chaotic attractor in a complex system’s dynamics can be addressed in the context of Haken’s principle as an example of that principle, a point made by Haken in [17] and also argued in [6] in regards to the emergence of a chaotic attractor in sunspots’ dynamics, Haken’s analysis of chaos in [17], as reviewed above, shows that the dimensionality of chaotic dynamics, in terms of number of emergent macroscopic order parameters that span the geometric space for the attractor, is irreducible.
The application of the conceptual and methodological basis of synergetics to chaos leads to a major point of chaos regarding systems’ dynamics: To emergent chaotic attractors there corresponds an irreducible dimensional order in the systems’ dynamics so that changes in attractor dimensionality can only occur as a structural change in that dimensional order. The number of order parameters are thus as structural as the fractal dimension and Lyapunov exponents of strange chaotic attractors.
In this way, as comes out of the synergetics research on chaos reviewed above, strange chaotic attractors are fractal geometric structures in a geometric space spanned by an irreducible number of emergent macro-level degrees of freedom, irreducible in the sense of Haken’s slaving principle [17].
Finding these attractors in empirical data such as sunspots’ numbers, without knowing the dynamical equations and only having available a signal falls in the context of attractor reconstruction. The main method employed, when only a time series is available, is delay embedding, in this case, one must find an appropriate lag and dimension and build, from the corresponding series, a sequence of tuples where each element of the tuple contains lagged values of the series and the number of elements of the tuple corresponds to the embedding dimension.
The main problem for attractor reconstruction is to find an embedding lag and dimension that allows for the reconstruction of the attractor. Ideally the embedding dimension should allow one to uncover the main topological and geometric order of the attractor and correspond to the number of order parameters, in [15,16] Topological Data Analysis (TDA) employing adaptive Artificial Intelligence (AI) with topological machine learning and using a sliding window for relearning was employed in order to find an embedding that would allow for attractor reconstruction, this AI system corresponds to what in [15,16] is called an adaptive topological agent, used to drive the process of attractor reconstruction and the subsequent analysis of the chaotic dynamics.
Methodologically, the current work is developed within the context of Smart Topological Data Analysis (STDA) involving a combination of methods from machine learning, chaos theory and topological data analysis.
The main point is that emergent attractors have specific geometric and topological signatures that can be exploited for prediction, in particular, when, underlying a time series, there is a dynamical attractor, this underlying “hidden” attractor can be uncovered by finding the embedding lag and dimension that allows for an adaptive topological AI system to find the link between the topological structure of the attractor and the time series.
In the case of chaotic attractors, the topological order is linked to a periodic skeleton that is associated with the attractor and that leads to recurrence signatures that can be used for prediction.
The search for embedding parameters, in this context, corresponds to a search for the attractor reconstruction that leads to the capturing of the topological order that allows for the adaptive AI system, equipped with a topological machine learning unit, to predict the target series.
In this way, the reconstruction of the attractor is achieved by finding the embedding, from a set of alternative embeddings, that best captures the topological order allowing for the prediction of the target series.
Now, when searching for the dynamics behind a specific signal, the main assumption is that the dynamics factors into a sum of a deterministic component plus a random noise term. In this way, when chaotic attractors are found, the assumption is usually that the remaining dynamics is noise.
In the present work, we follow a different route, our main point is that once an attractor is found one should study the corresponding residuals’ dynamics in order to characterize it. Working from the sunspots’ data this approach led us to uncover not one low- dimensional chaotic attractor but two low-dimensional chaotic attractors plus an Autoregressive Integrated Moving Average (ARIMA) component with a final stochastic residual that is indistinguishable from IID noise.
The first attractor, which is dominant, is linked to the long-wave sunspots’ dynamics and, as we show, is responsible for the major SOC markers in the sunspots’ data, including a power law scaling in the power spectrum and in the frequency distribution and a multifractal scaling in the signal, with strong persistence.
The topological order of this attractor, which has a clear fractal dimension, contains exploitable topological information that allows for an adaptive topological AI system equipped with a k nearest neighbors’ learning unit, to predict more than 80% of the variability of the sunspots’ number series.
In a single decomposition approach, one would conclude that a strange chaotic attractor was present as “the” dynamics associated with the sunspots, with the remaining residuals being assumed as corresponding to noise.
Such an approach would not uncover further structure in the sunspots’ dynamics, namely the second chaotic attractor would be left undiscovered, a discovery that effectively shows that the conjecture that the residuals correspond to a noise process is incorrect, namely, as we will find out those residuals are in fact characterized by a noisy chaotic component, therefore, we are, in fact, dealing with stochastic chaos.
Therefore, using the adaptive topological agent’s predictions as a filtered signal, we characterize in more detail the main attractor responsible for the sunspots’ long-wave dynamics and then we study the residuals from the adaptive agent’s predictions, to research in detail the dynamics of that which was not captured by the adaptive agent in terms of exploitable topological order.
Decomposing the embedded trajectory of the sunspots’ numbers in the predicted and the residuals’ tuples we find that the main properties of the long-wave attractor are kept in the embedded trajectory from the adaptive topological agent’s predictions, but then studying the resulting residuals’ trajectory in phase space we uncover the presence of another fractal attractor with positive but lower Lyapunov exponent with multifractal signatures characterized by anti-persistent dynamics and intermittent turbulence.
This second attractor actually compensates for the high persistence of the long- wave dynamics’ attractor and leads to a lower persistence than what would hold if only the long-wave attractor was present.
Researching the properties of this second chaotic attractor, which is a noisy attractor, we apply wavelet denoising and research the properties of the embedded denoised trajectory, which reinforces the findings of chaos in sunspots’ data [6-10].
By studying the filtered-out noise, we find the presence of a final Auto Regressive Integrated Moving Average (ARIMA) (1,0,1) process with Independent and Identically Distributed (IID) residuals. This allows us to decompose the sunspots’ dynamics into its two attractors plus a stochastic process with an ARIMA component and IID residuals, so that the final evidence is that we uncovered the main dynamical components down to the point where no further low-dimensional deterministic components are left and are able to confirm the presence of stochastic chaos in the sunspots’ dynamics, furthermore, all of the markers of SOC are not found in the stochastic component but, instead, in the chaotic one, which supports the hypothesis of chaos-induced SOC.
Arguably, in general, the analysis should only stop, as shown in the present work, when a final IID component is found, which means that we have captured all the major elements that drive a specific dynamics.
The work is divided into three sections. In Section 2, we review the materials and methods. In Section 3, we present the results for the sunspots data. In Section 4, we conclude by reflecting on the methodological aspects of the article and their implications for the empirical methods of chaos theory.
Materials and Methods
The dataset on the sunspot counts’ time series that we use is from the sunspots’ data from the World Data Center SILSO, Royal Observatory of Belgium, Brussels, the specific data is the daily total sunspot number. The period that we selected for analysis is from 1 January, 1900 to 31 December, 2023.
For signal analysis of the series, we begin by employing analyses directed at identifying markers of SOC. In this way, we apply R/S analysis in order to characterize the signal’s memory and persistence pattern. The R/S analysis estimates the Hurst exponent which measures the persistence of a series [18,19].
Conjointly with R/S analysis, we employ spectral analysis which allows us to identify the possible presence of power law scaling in the power spectrum, reinforcing the results from R/S analysis in the identification of the classical markers of Self-Organized Criticality (SOC).
After identifying the markers of SOC related to power law signatures in the power spectrum, which is a major classical feature of SOC, we turn our focus to the statistical distribution of the time series. In this case, we look at the cumulative distribution function and try to identify power law scaling in the distribution.
While, theoretically, SOC involves a strict power law scaling in event size distribution, empirically, SOC can still be considered to be present if the power law scaling is the dominant structure of the statistical distribution. However, when chaotic attractors are present, we need to find if both the power law scaling and any deviations from that scaling either at the low frequency of events or at the high frequency of events can be linked to the attractor itself, if so, then the distribution’s shape both with respect to the power law scaling and its deviations are structurally related to the chaotic dynamics.
In the context of stochastic chaos, power law scaling in distributions can occur due to the features of the attractor, even if the original noise process does not follow a power law structure. We will see this point specifically in the current work for sunspots, since the IID noise process does not exhibit a power law scaling in the distribution, but the long-wave dominant attractor does exhibit such a scaling. Thus, the distribution and, as we will see, the power spectrum signatures are related to this strongly persistent long- wave dominant attractor, which means that we uncover direct evidence of chaos-induced SOC.
While different fractal scaling laws in power spectrum and event size distribution are the classical markers of SOC, another aspect of SOC is the possibility of multifractal scaling which can occur for different profiles of power spectra and event size distributions. This leads us to the subset of the theory of SOC, which is the emergence of multifractal, rather than just fractal, scaling in far- from-equilibrium complex systems. This is called multifractal self- organized criticality (MSOC) and it has been identified in both financial and epidemiological contexts [13,14,16].
An important point is that multifractal scaling has been observed at critical points in phase transitions and in models of SOC, as reviewed in [16], which means that to just test for fractal scaling is insufficient if we want to identify and characterize the type of criticality resulting from a system’s self-organization dynamics towards criticality.
To evaluate the possibility of Multifractal Self-Organized Criticality (MSOC), we need to estimate a multifractal spectrum of generalized Hurst exponents. To do so, we employ Multifractal Detrended Fluctuation Analysis (MFDFA) with polynomial fitting, a method that is robust in the detection of monofractal versus multifractal scaling and in the case of turbulent processes, allow one to characterize the relation between risk and predictability [16,20].
The method that we use is described in detail in [20]. It involves the estimation of a detrended fluctuation function that, for a fractal or multifractal signal, scales with the lag in accordance with a power law scaling rule that depends upon the generalized Hurst exponents. Thus, for a multifractal process, the detrended fluctuation function Fq scales with the lag s, with the generalized Hurst exponent being a function of the moments’ orders q, in accordance with the following scaling law [16,20]:

In the special case of monofractal scaling, the exponent would be the same for all moments’ orders, in multifractal scaling the exponents change for different orders [20].
Fractal scaling occurs as straight lines in a doubly logarithmic plot of the detrended fluctuation function with the lag, for different moments’ orders. If the straight lines for each order all have the same slope, then we are dealing with monofractal scaling, if the straight lines have different slopes for different orders, we are dealing with multifractal scaling, the difference between the highest and the lowest exponents provides the amplitude for the spectrum, the higher the amplitude is, the stronger is the multifractality of the signal.
Besides the plot of the detrended fluctuation function for the different lags and moments’ orders, we also plot the multifractal scaling exponent function that allows us to picture the change in the scaling with the moments’ orders, this function is given by the formula [20]:

In order to complete the analysis, we also plot the histogram for the generalized Hurst exponents and the graph of the function of the exponents for the different moments’ orders, besides these plots we also calculate the maximum and minimum of the generalized Hurst exponents’ distribution, which, as stated above, is useful in the characterization of the multifractal process involved.
The next step is the attractor reconstruction method. As reviewed in the introduction, the conceptual structure of synergetics proves operatively effective when faced with evidence of emergent chaotic attractors in complex systems’ dynamics. Indeed, synergetics provides for a conceptual basis and framework for the main methodology of attractor reconstruction and, in particular, the topological methods employed in the current work, when dealing with complex systems’ dynamics.
Namely, in complex systems that are thermodynamically open and far-from- equilibrium, with large number of degrees of freedom, possibly even fluctuating degrees of freedom, finite-dimensional attractors can emerge with dynamics with specific geometric and topological properties supported by these systems’ collective dynamics, namely, the number of dimensions for these attractors match a number of emergent macrolevel active degrees of freedom, corresponding to order parameters [17].
In such contexts, the microscopic level that has a large, possibility even fluctuating number of degrees of freedom, exhibits dynamics that sustains the macrolevel dynamics and the system can be addressed and characterized by that macrolevel dynamics. In synergetics’ conceptual framework, this corresponds to Haken’s slaving principle [17].
This is a self-organization dynamics that leads to a synergetic sustaining of a macroscopic dynamics that is characterized by a finite number of degrees of freedom corresponding to these active macroscopic variables, with the microscopic dynamics sustaining the high-level dynamics in the form of a feedback loop that effectively locks in the lower level’s dynamics in the sustainability of the higher-level dynamics to the point that one can address the system’s dynamics from these emergent macroscopic order parameters [17].
Indeed, this phenomenon of self-organization, leading to emergent order parameters, allows the description of the system’s dynamics in terms of these collective variables without having to describe in detail the low-level dynamics, which is the main point of Haken’s principle and methodology [17].
The emergence of chaotic attractors in complex systems occurs as such an example of self-organization, therefore, constituting an example of Haken’s slaving principle, however, as reviewed in the introduction, the dimensionality of the emergent attractors is irreducible violating the slaving principle when it is applied to these attractors themselves, that is, one cannot further reduce the number of emergent degrees of freedom associated with the macrolevel dynamics to a smaller number, implying that the emergent collective degrees of freedom as order parameters, as well as the fractal and topological structuring are a proper of these emergent attractors.
Now, empirically, when one only has a time series of observations to work with, uncovering the order parameters and reconstructing the emergent attractor’s dynamics is dealt with using delay embedding methods and studying the qualitative properties of the emergent dynamics, employing that delay embedding.
The main point is that the time series is actually a function of the order parameters plus a noise term, in this way considering gp as a d-dimensional tuple and x as a time series of observations, we have the following general structure that is usually assumed:

In this case, g is an unknown function, its argument p (t) is also unknown and the residuals term ε (t) is assumed to be a noise term. The major objective of delay embedding, which uses Taken’s theorem [21], is to reconstruct the order parameters’ dynamics p (t) by building the following tuple using the time series for an embedding dimension d and embedding lag l.

The main problem is that of finding the embedding lag and dimension that allows one to reconstruct the dynamics so that the embedded trajectory q(t) is equivalent to the trajectory of the emergent order parameters’ tuple p(t).
Different methods for finding the lag and dimension can be used, in the current work, we follow the methods introduced in [15,16,22] that take advantage of topological machine learning.
The use of a topological machine learning model is necessary, in this case, because we want to find the embedding that better captures the topological structure of the attractor, using a topological predictive scheme that exploits topological regularities in the reconstructed attractor in order to predict the target. In this case, it is useful to use a sliding window method for relearning since, for complex attractors, the AI is capable of adapting to attractor epochs and capturing a local structure of recurrences.
We, thus, deploy an adaptive topological agent that is given a training task of learning to predict the next value of the time series using the last embedded phase point, such an agent is an adaptive AI system equipped with a topological learning unit for learning such as a radius learning unit or a k nearest neighbours’ learning unit.
A topological learning unit is necessary because, as explained above, we are using the AI system as a search tool to find the embedding that has the greatest exploitable topological regularity, that is, the embedding where the topological information contained in the reconstructed dynamics provides for the best performing predictive order for the target time series, in this way, for different alternative embedding lag and dimension we select the pair for which an agent has the best adaptive performance.
Now, given a sliding learning window of size w, to predict the t-th value of the time series, we provide the sliding training data to the adaptive agent which can be formalized as follows:

Using the above sliding window training data the topological adaptive agent produces a prediction from the last embedded point, so that we can write the prediction function:

The above scheme can be implemented in a grid search of embedding parameters’ pairs, that is, given a set of alternative values for the embedding lag and the dimension, the prediction performance of the agent for the full series is recorded for each alternative embedding parameters and the embedding that leads to the highest performance within the set is selected.
Given the above method we know that, from the set of alternative embedding’s, we have found the one that captures the highest exploitable topological information for the signal in question.
Having chosen the result and characterizing the agent’s performance for that alternative we can then apply nonlinear time series analysis methods, in particular, we will apply Rosenstein et al., method for the estimation of the largest Lyapunov exponent in [23] and we also calculate the box counting dimension to evaluate the possibility of the presence of a strange chaotic attractor [18].
The uncovering of an underlying chaotic attractor is usually enough for one to study the patterns of that attractor assuming that to be the system’s main dynamics. In particular, when one uses the above method, one is able to find reconstructed attractors that usually capture the main dynamics, especially in the case of emergent dominant low- dimensional chaotic attractors [15,16,22].
The problem, however, is that other dynamics can be present and remain undiscovered if one does not research the residuals. In particular, complex systems, as open systems, can exhibit multiple complex dynamics, including complex noise processes. In this sense, in the present work, we also analyze the residuals’ series from the adaptive agent’s predictions for its patterns, with this defined as:

The steps to be taken regarding the residuals’ series largely depend upon the patterns present in the original series and in the residuals. When chaotic signatures are found in noisy data with dynamical noise, the attractor reconstruction leads to a basic hypothesis for stochastic chaos that can be tested using the machine learning predictions.
From equation (7) we know that the following decomposition holds for the phase point:

In the above equation, which holds exactly, the term qres (t) corresponds to the residuals’ tuple:

while the function fml is such that it maps each element in the tuple q (t-1) as follows:

Therefore the “machine learning” function maps the phase point to its next predicted value using the topological adaptive agent’s predictions.
The decomposition holds exactly, as follows from the above equations, because we are effectively decomposing the attractor’s embedded dynamics in the embedded series of predictions and embedded series of residuals. Since each element of the embedded original series decomposes in a machine learning prediction plus residuals term, the above equations hold exactly as a basic decomposition.
In this way, even though we do not know the general equations for system’s dynamics, the topological adaptive agent effectively produces a local function that links each phase point to a prediction for the next phase point using the topological signatures of the reconstructed attractor.
In this way, instead of working with a global equation we are working with a local machine learning produced function that exploits the local topological order to recover a deterministic link between two sequential phase points.
A basic stochastic chaos hypothesis assumes that the residuals’ component qres (t) corresponds to the realization of a noise process, this hypothesis may not hold as seen. The most basic case is when the residuals are Independent and Identically Distributed noise (IID) with a density function dPε, then we get a joint density for the residuals’ tuple:

In complex systems, emergent chaotic attractors are usually affected by external dynamical noise processes, the above equations allow for the topological machine learning to recover a deterministic plus noise component, however, the elementary IID noise hypothesis is a special case, indeed, complex noise processes or other dynamics may be present in the residuals, which implies the need for an analysis of these other dynamics.
The types of analyses and methods applied in general depend upon the residuals’ process, therefore signal analysis for the residuals and the study of the residuals’ dynamics is necessary to evaluate its pattern in the reconstructed phase space. It is this main methodological approach that we now apply for the sunspots’ numbers series.
Results and Discussion
In Figure 1, we show the time series sequence chart for the total daily sunspot numbers from 1 January, 1900 to 31 December, 2023 retrieved from the World Data Center SILSO, Royal Observatory of Belgium, Brussels [24], while the earliest available data in the dataset was 1 January, 1818, we used a smaller dataset beginning in 1900.
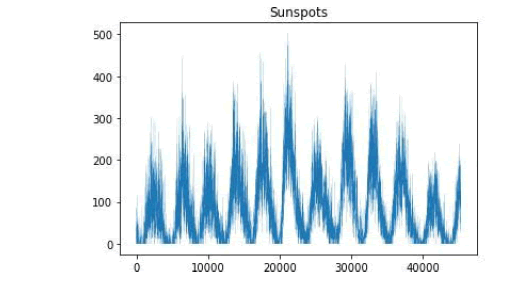
Figure 1: Sunspot numbers from 1 January, 1900 to 31 December, 2023. Source: WDC-SILSO, Royal observatory of Belgium, Brussels.
The series shows long run recurrent rises in solar activity, corresponding to a long- wave dynamics, the estimated Hurst exponent by R/S analysis is 0.8359, which is consistent with strong persistence. The power spectrum also shows a power law decay with a rise between 0.01 and 0.1-frequency range (Figure 2) as well as another rise in the low frequency range of the spectrum, this means that some periodic signatures may be present in what is a power law decay in the spectrum.
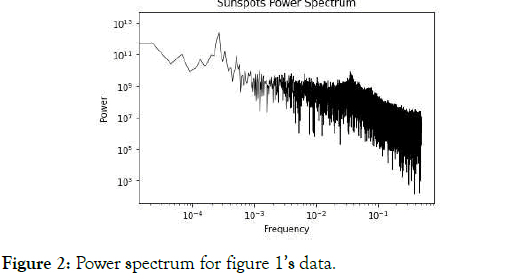
Figure 2: Power spectrum for figure 1’s data.
The periodic signatures in the spectrum are consistent with both cyclical processes affected by noise and chaotic processes that are nearer the onset of chaos, where periodic signatures can occur due to the re-salience of cycles, it can also occur as a consequence of noise-induced order phenomenon [25,26].
Now, considering the probability distribution, as can be seen in Figure 3, we find that the distribution is well approximated by a power law scaling with a cut-off at the upper tail that shows a decreased value with respect to the power law scaling probability law, in this way, there is a deviation in the more extreme events where there is a high number of observed sunspots, events that have a lower probability than what would be predicted from the power law.
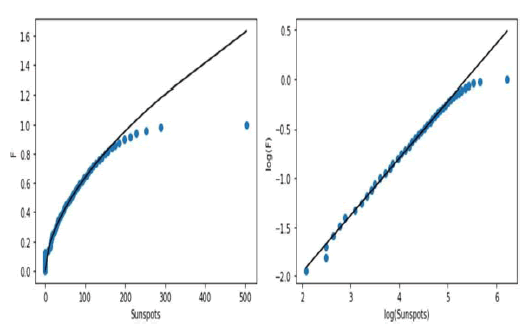
Figure 3: Cumulative distribution for the sunspot numbers and power law fitting.
This is common in empirical fractal structures and in the examples addressed by Bak, around SOC [27-29], indeed, there can occur a finite limit to scale invariance, an example in the sandpile model of SOC is found in [28], where the distribution of cluster sizes follows the power law scaling but there is a divergence from that scaling for the larger cluster sizes with the distribution of those larger sizes being smaller than that which is predicted by the power law.
The same occurs with the sunspot data distribution, however, as in the sandpile model addressed in [28], the dominant part of the distribution is well-fit by the fractal structure.
In figure 3, we show the fitted power law in the power law scaling region for the cumulative distribution function obtained from 50 quantiles, with an estimated slope of 0.5807, an intercept of -3.1236 and an R2 of 99.67%.
The slope provides for an estimate of the power law scaling in the distribution density namely, in the power law decaying region the decay is approximately given by the empirical law:

The presence of a power law scaling in the sunspot frequency distribution and the power law decay of the power spectrum is strong evidence favorable to the hypothesis of SOC in the sunspot dynamics confirming the previous evidence of SOC in the sunspot dynamics [5,7,9,10].
However, besides the classical SOC signatures, we also find the presence of multifractal scaling, with a maximum generalized Hurst exponent of 0.8678 and a minimum exponent of 0.7782 with an amplitude for the spectrum of 0.0895 (Figure 4).
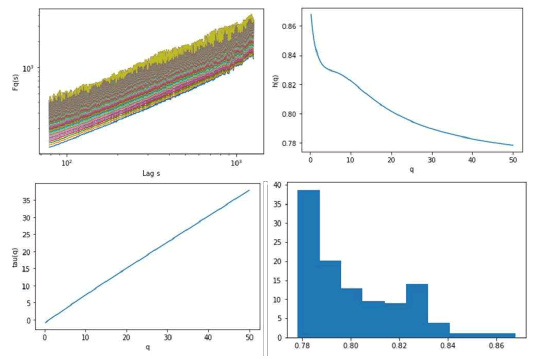
Figure 4: Sunspots series’ multifractal detrended fluctuation analysis, showing the: fluctuation function (top left), generalized Hurst exponents (top right), multifractal scaling exponent function (bottom left) and generalized Hurst exponents’ histogram (bottom right), the moments’ orders range from 0 to 50 in 200 steps and the lags range from 1.9 to 3.1 in 600 steps.
The multifractal scaling signatures are consistent with the hypothesis of MSOC. It should be stressed, however, that the spectrum amplitude is small, which means that, while there is evidence of multifractal scaling, the process is close to monofractal, the multifractal spectrum is also situated in the strongly persistent region, which reinforces the previous result from the R/S analysis.
The main point, now, is whether these SOC signatures are possibly chaos-induced signatures from an emergent dominant chaotic attractor or whether these signatures are associated with a possible stochastic process.
In order to research the possibility of chaos-induced SOC, associated with the above dynamics, as described in the previous section, we perform a grid search for the adaptive topological agent with 30 days sliding window, 10 nearest neighbors, distance-based weights and KD search tree. The lag values used range from 1 to 20 and the tested embedding dimensions from 2 to 10.
We find that the adaptive topological learner’s best performance is always achieved for a two-dimensional embedding, which is a strong indicator of the presence of a two-dimensional attractor.
The performance changes, however, with the lag, in this case we find a drop in performance from lag 1 to lag 2, and then a rise achieving the highest value for lag 8, as shown in Figure 5.
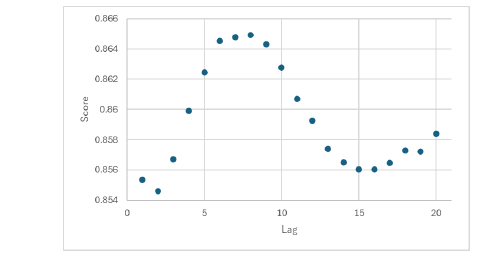
Figure 5: R2 score versus lag for the adaptive topological agent with two-dimensional embedding.
In this way, for the grid search, we find that the highest exploitable topological information for the adaptive agent, using a k nearest neighbors’ learning unit, is achieved for a two-dimensional embedding and lag of 8, leading to a R2 score of 86.49%. Of notice, as can be seen in figure 5, the adaptive agent’s performance is high, above 85% and below 86.6%, which is a strong indicator for the presence of an exploitable topological order from the embedded series.
In order to proceed with further analyses, we need to evaluate the pattern of exploitable topological information with the number of nearest neighbors, in this case, we find that, for the two-dimensional embedding with lag 8, and with the number of nearest neighbors varying from 1 to 15, which is half the sliding learning window, the adaptive topological agent’s performance rises with the number of nearest neighbors reaching a peak at eight nearest neighbors, after which the performance decreases (Figure 6).
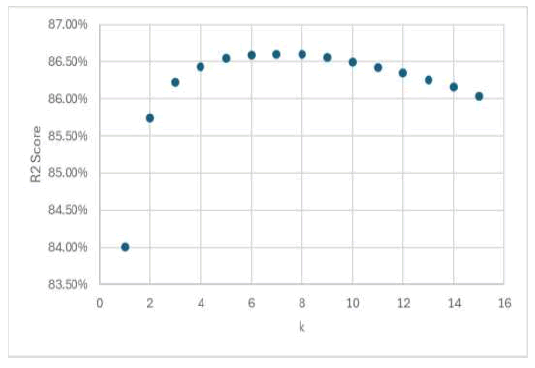
Figure 6: R2 score for the adaptive topological agent versus the number of nearest neighbors.
This means that the reconstructed attractor has the highest topological signatures for 8 nearest neighbors. For k equal to 8 we find that the value of the R2 score is 86.60%, the explained variance is 86.61%, the RMSE is 28.9817 which represents 5.76% of the data amplitude and the correlation coefficient between the observed and predicted values is 0.9310, which is a positive and high correlation.
In this way, there is an exploitable topological information in the reconstructed attractor leading to a high performance of the adaptive topological agent.
Now, using equation (8) decomposition, we research the impact of the residuals on the attractor’s dynamics and study the sequence of predicted phase points as per equation (10) and compare the results with those of the observed phase points resulting from the embedding of the original series.
Studying both trajectories and estimating the largest Lyapunov exponent we find values close to each other, as shown in Table 1, however, the reconstructed predicted trajectory exhibits a slightly higher largest Lyapunov exponent, in both cases, the exponent is positive, which is a signature of chaos, and consistent with a near 30 days Lyapunov time. The largest Lyapunov exponent is low, which indicates a possible proximity to the onset of chaos, a point to which we will return further on.
| Observed Series | Predicted Series | Variation | |
|---|---|---|---|
| Largest Lyapunov Exponent (LLE) | 0.0312 | 0.0333 | 0.0021 |
| Lyapunov time | 32.0345 | 30.0566 | -1.9779 |
| Box counting dimension | 1.7308 | 1.7339 | 0.0031 |
| Hurst exponent | 0.8359 | 0.8818 | 0.0459 |
Table 1: Main metrics for observed versus predicted series.
The box counting dimension also does not change significantly from the observed to the predicted trajectories with only a slight increase in the dimension for the predicted trajectory, however, both trajectories have a dimension of approximately 1.73, which is consistent with a strange chaotic attractor. In Figure 7, we show the R2 for the estimated dimension in the observed series’ reconstructed attractor is 99.80% while for the predicted series’ reconstructed attractor it is 99.84%, in both cases 100 boxes were used.
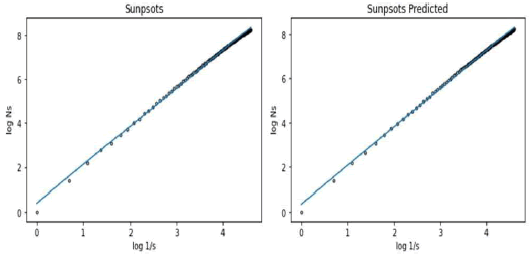
Figure 7: Box counting dimension for the embedding of the observed (left) versus predicted (right) trajectories using a two-dimensional embedding and an eight-days’ lag.
The Hurst exponent for the predicted time series is slightly higher than for the original sunspots’ series, showing a stronger persistence. This is the most significant change between the original series and the topological adaptive agent’s predictions.
In Figure 8, we show the power spectrum for the predicted series, which exhibits the power law decay and the slight frequency rise between in the frequency range from 0.01 and 0.1, as well as in the low frequency range, this implies that the periodic signatures and the power law decay can be traced back to the chaotic attractor captured by the topological adaptive agent.
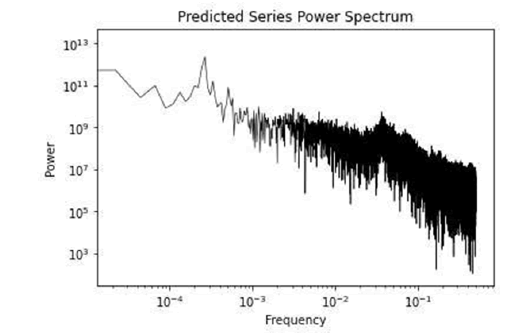
Figure 8: Power spectrum for the predicted series.
A similar point holds for the distribution function estimated for the predicted series, in this case, both the power law scaling of the distribution and the deviation from that scaling are found in the predicted series’ distribution function, which is a strong indicator that the power law scaling in both the power spectrum and in the statistical distribution of events, including the deviation from that scaling for the higher order events are a consequence of the dominant chaotic attractor captured by the adaptive topological agent, an attractor that is linked to the long-wave dynamics of the sunspots’ series.
Indeed, as shown in Figure 9, we also find for the predicted series a region of power law scaling in the cumulative frequency distribution, with a cutoff towards the end of the distribution, in this way, the fractal distribution signature is also present in the predicted data, and, thus, can also be related to the chaotic component of the dynamics, the cumulative distribution function was obtained from 50 quantiles, with an estimated slope of 0.6016, an intercept of -3.2207 and an R2 of 99.84%. Equation (13) shows the scaling for the power law region of the density:
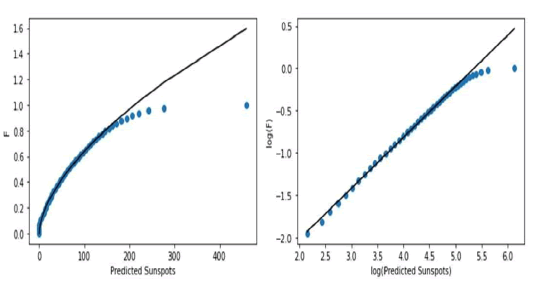
Figure 9: Cumulative distribution for the predicted sunspot numbers and power law fitting.

The difference is that the R2 increased and the slope is higher, with the intercept being close to the previous value. The exponent is slightly less negative but still close to the main series’ value. In this way, the dynamical process associated with the residuals seems to reduce the R2 fit for the power law scaling region, as well as decreasing the Hurst exponent to a slightly less persistent dynamics.
So far, what we find is that the main attractor metrics are captured by the topological adaptive agent’s predictions with few deviations between the original embedded trajectory and the trajectory associated with the agent’s predictions, so that the predictions seem to capture the dominant chaotic process.
The fact that the SOC signatures are found in the predicted series means that these signatures are not associated with the residuals’ process but rather with the main chaotic attractor, furthermore, the filtering of the residuals leads to an even stronger persistence and reinforced multifractal scaling. Indeed, looking further at the multifractal analysis for the predicted series we also find the presence of a multifractal spectrum (Figure 10), however, there are a few relevant differences.
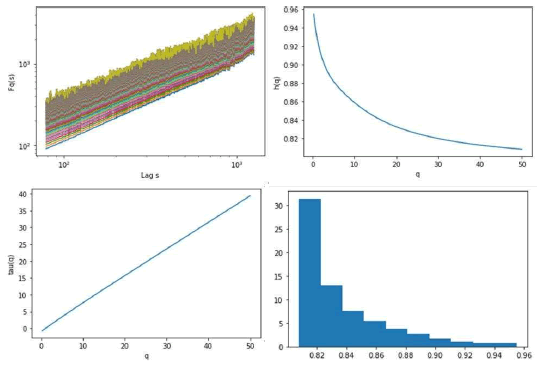
Figure 10: Predicted series’ multifractal detrended fluctuation analysis, showing the: Fluctuation function (top left), generalized Hurst exponents (top right), multifractal scaling exponent function (bottom left) and generalized Hurst exponents’ histogram (bottom right), the moments’ orders range from 0 to 50 in 200 steps and the lags range from 1.9 to 3.1 in 600 steps.
The multifractality is stronger, with the spectrum having a wider amplitude, in this case, the amplitude is 0.1469, the generalized Hurst exponents are also situated in a region of stronger persistence, with lowest estimated exponent being 0.8079 and the highest 0.9548.
The residuals’ process, thus, seems to reduce the multifractal range and also the exponents. There is a reason for this, as we will see when we analyze the residuals’ process.
At this point, the evidence is strongly consistent with the main SOC and MSOC, identified at the beginning of the analysis, as being linked to a two-dimensional chaotic attractor associated with the long-wave dynamics, which is consistent with chaos-induced SOC. Two-dimensional chaotic attractors can only occur for chaotic maps, indeed, for chaos to occur in continuous time nonlinear dynamical systems, the minimum number of dimensions is three.
The emergent chaotic attractor’s topological structure allows for a prediction capturing more than 80% of the sunspots’ variability, as per the calculated coefficients of determination, furthermore, as follows from table 1’s results and the above analysis the residuals do not significantly affect the attractor’s main features, only reducing the persistence level of the series.
As can be seen in Figure 11 (left) the predicted series (in orange) matches well the long-wave pattern, which is the dominant pattern that we found to be produced by a chaotic dynamics. The main point now is the residuals series’ dynamics, once we filter out the predictions obtained from the long-wave dynamics’ reconstructed attractor.
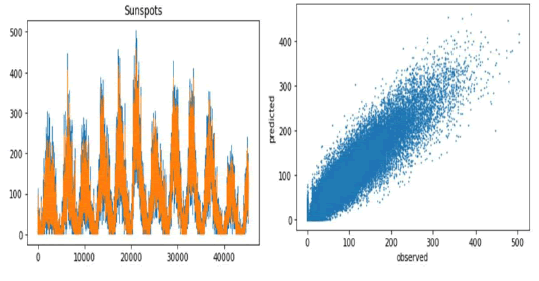
Figure 11: Time series plot (left) for the observed (blue) versus predicted (orange) series. Scatterplot (right) for the observed versus predicted series.
As shown in Figure 12, the residuals’ series shows evidence of intermittent turbulence with a burst-suppression like pattern (figure 12 left) and its distribution (figure 12 right) exhibits excess kurtosis, with an estimated Fisher’s kurtosis of 2.6191, with the Gaussian reference being zero.
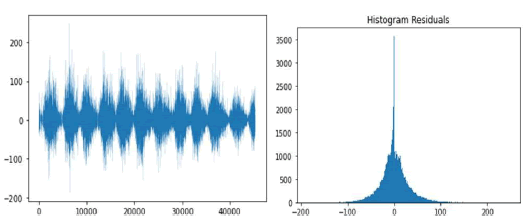
Figure 12: Residuals’ series (left) and histogram (right).
The series is also multifractal, as shown in Figure 13, with generalized Hurst exponents in the anti-persistent region, which may explain the type of turbulence pattern observed in the graph. The highest estimated generalized Hurst exponent is 0.3048 while the lowest is 0.1676, with a spectrum amplitude of 0.1372.
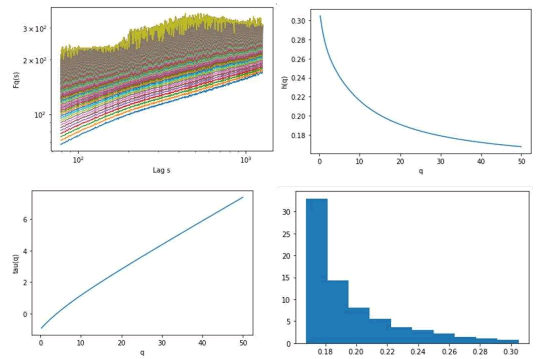
Figure 13: Residuals’ series’ multifractal detrended fluctuation analysis, showing the: Fluctuation function (top left), generalized Hurst exponents (top right), multifractal scaling exponent function (bottom left) and generalized Hurst exponents’ histogram (bottom right), the moments’ orders range from 0 to 50 in 200 steps and the lags range from 1.9 to 3.1 in 600 steps.
The low values of the generalized Hurst exponents in an anti- persistent region may possibly explain the reduction of the persistence pattern in the original series versus the predicted series.
In this way, the evidence for the sunspots’ series is that it exhibits a long-wave dynamics associated with a low-dimensional chaotic attractor leading to chaos-induced SOC with multifractal signatures in a strongly persistent regime consistent with black noise, but this attractor is being affected by a second process that is also multifractal but with evidence of anti-persistence, which reduces the strong persistence of the dominant strange attractor’s chaotic dynamics. The anti-persistent multifractal process may be linked to a compensation dynamics associated with the solar activity regarding the formation and dissipation of sunspots, a possible self- regulation dynamics, with the multifractal process operating in a contrarian way with respect to the long-wave persistent attractor, which would show stronger persistence if not affected by this type of anti-persistent turbulent process. An important point, as we saw, is that, upon the decomposition in the predicted and residuals trajectories in phase space, as per equation (8), the anti-persistent process does not significantly affect the largest Lyapunov exponent for the predicted trajectory, the box counting dimension, indeed, the impact of the anti-persistent process is not significantly visible in the dominant strange attractor’s main metrics, as shown in Table 1, it is mainly visible in the reduction of the level of persistence in the fractal signatures of the dynamics, leading to a reduction in the persistence of the observed series with respect to the predicted (smoothed) series.
Another major finding is that the anti-persistent multifractal scaling is not consistent with the residuals’ process being characterized by simple IID noise, as would occur in the elementary stochastic chaos model with a single attractor affected by IID noise.
The presence of multifractal dynamics in the residuals’ series raises the possibility of a second process that can either be a purely stochastic multifractal process or, alternatively, we may be dealing with a second chaotic process, with a second type of chaos-induced multifractality. This hypothesis can only be evaluated by studying the trajectory of the residuals’ phase point qε (t) as defined in equation (9).
In Figure 14, we show the decomposed sunspot’s reconstructed attractor’s trajectory in the machine learning predicted component (left) and the residuals’ component (right) as per equation (8). In Figure 14, the topological machine learning-predicted component has a V-like dispersion near the origin and then shows a heteroskedastic pattern, which is consistent with the long-wave dynamics.
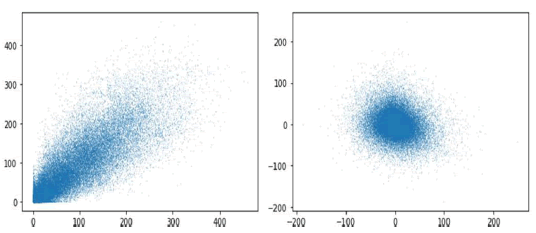
Figure 14: Decomposition of the adaptive topological agent’s predictions (left) and of the residuals (right).
The residuals component on the right, seems to show the presence of a noisy elliptical shape, calculating its box counting dimension, we find that the residuals’ trajectory in phase space has a well-fit fractal dimension as shown in Figure 15. The estimated fractal dimension, for the residuals’ phase space trajectory, is 1.6048 with an R2 of 99.89%.
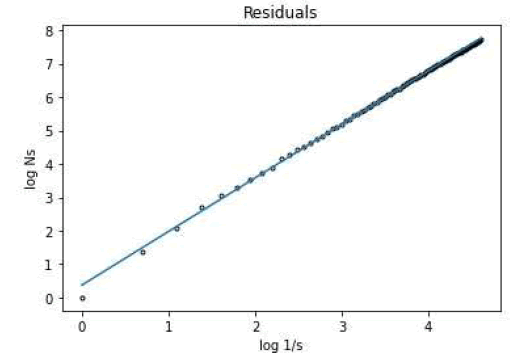
Figure 15: Estimated box counting dimension for the residuals’ series phase space trajectory.
Estimating the largest Lyapunov exponent for the residuals’ component, we find a positive but low largest Lyapunov exponent associated with the residuals’ attractor, the estimated value is 0.0021.
In this way, the residuals’ series, which shows markers of multifractal turbulence also exhibits evidence of being driven by another strange chaotic attractor, in this case, characterized by weak chaos, with a low largest Lyapunov exponent.
In this way, rather than one chaotic dynamics, the reconstructed attractor’s decomposition allowed us to uncover two chaotic dynamics associated with the sunspot data, one that is dominant in the main fluctuations and is associated with the long-wave dynamics, showing evidence of strong persistence and a second chaotic dynamics which is characterized by multifractal anti- persistence and weak chaos.
The exchange of these two dynamics explains the main pattern associated with the sunspot data. In order to better characterize these two dynamics, we apply recurrence analysis to a sliding window for the reconstructed attractors, original, predicted and residuals.
Recurrence analysis is a topological data analysis method that involves the calculation of a Euclidean distance matrix from the embedded trajectory, containing all the pairs of distances between each phase point. The matrix is symmetric and has a null diagonal. Given a distance matrix, one can calculate a binary matrix of recurrence events for a given radius.
This recurrence matrix records a value of 1 if the distance between two points is at most equal to the value of the radius and 0 otherwise. The recurrence matrix is also symmetric with null diagonal [26].
Now, using a one standard deviation radius for the sunspot data, we calculate the recurrence matrices for a sliding window of 240 phase points of the sunspots reconstructed attractor and, for each matrix, we calculate the average recurrence strength and the conditional 100% recurrence probability, as shown in Figure 16.
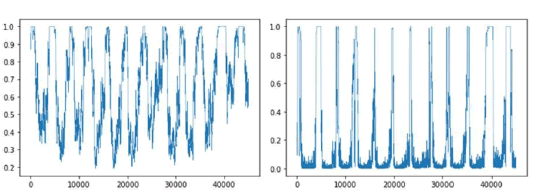
Figure 16: Average recurrence strength (left) and conditional 100% recurrence probability (right), obtained for a 240 phase points sliding window for the embedded sunspots’ number. The radius used was one standard deviation of the number of sunspots series.
The average recurrence strength is the sum of the number of points that fall within a distance no greater than the radius, in each diagonal below the main diagonal, divided by the total number of diagonals below the main diagonal with recurrence.
This metric allows one to evaluate how strong on average the recurrence is [26]. The conditional 100% recurrence probability is the probability that a randomly chosen diagonal with recurrence below the main diagonal has 100% recurrence, for the radius chosen [26].
As can be seen, in figure 16, the recurrence strength for the full embedded series’ dynamics ranges from low to high, while the conditional 100% recurrence probability is in general low with a few rises to strong recurrence periods.
These metrics were calculated for a recurrence matrix obtained from a sliding window of 240 phase points, which corresponds to eight full 30 days periods, with the 30 days mark closely matching the Lyapunov time. In Figure 17, we show the same calculations but for the trajectory obtained from the topological adaptive agent’s predictions, which corresponds to the attractor shown in figure 14 left.
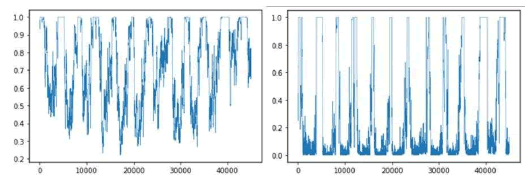
Figure 17: Average recurrence strength (left) and conditional 100% recurrence probability (right), obtained for a 240 phase points sliding window for the embedded adaptive topological agent’s predictions, using the same radius as in figure 16.
We find that the main pattern of recurrences in the original data matches well the component obtained from the topological adaptive agent’s predictions. The average recurrence strength in both cases ranges from low to high values and the conditional 100% recurrence probability is, in general, low but sometimes rises to high values.
This is consistent with a chaotic dynamics with strong recurrences and explains well the strong persistence. In this case, the mean value of the average recurrence strength is 0.6645 for the original embedded series and 0.7395 for the adaptive topological agent’s predictions’ component, thus, we find that the residuals, which, as we saw, also have evidence of chaos, are responsible for a decrease in the average recurrence strength.
The probability of finding 100% recurrence diagonals given that the diagonal is a diagonal with recurrence is in general low but sometimes rises to 1, a pattern that holds for both the original and the predicted series. The average probability is 0.2010 for the embedded sunspots’ series and 0.2765 for the predictions’ component.
In this way, again, we find that the second residuals’ process reduces the recurrence, however, the overall pattern for the recurrence profile of the original embedded series is dominated by the main long-wave dynamics’ attractor that is captured by the adaptive topological agent.
Considering now the recurrence profile for the residuals’ chaotic process, and also using a one standard deviation radius, we find that the mean of the average recurrence strength is lower, with a value of 0.3909, and there are lower peaks of conditional 100% recurrence probability with a mean value of 0.0265, as shown in Figure 18. This is actually not linked to a higher largest Lyapunov exponent which, as we saw, is actually lower than that of the dominant attractor and close to zero, but, instead, it may be linked, in part, to the anti-persistence and, in another part, to the presence of noise.
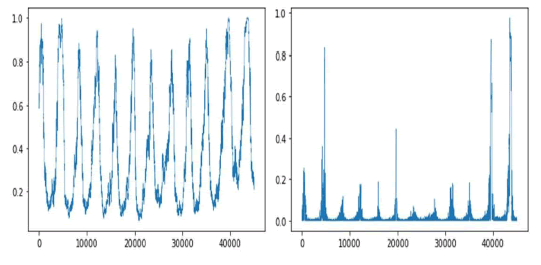
Figure 18: Average recurrence strength (left) and conditional 100% recurrence probability (right), obtained for a 240 phase points sliding window for the embedded residuals’ series. Using a radius of one standard deviation of the residuals’ series.
In order to confirm this last hypothesis, we use a biorthogonal 2.8 wavelet denoising of the residuals’ series, using soft thresholding, with a threshold of 0.95 and 10 levels decomposition, Figure 19 left shows the denoised signal, which still exhibits the burst-like dynamics and on the right, we show the corresponding noise process obtained from the difference between the residuals’ series and the wavelet denoised series.
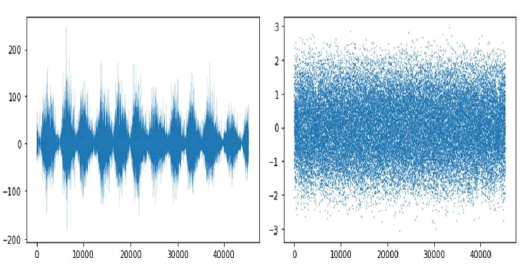
Figure 19: Wavelet denoised residuals’ series (left) and noise obtained from the difference between the original residuals’ series and the denoised signal (right).
We can now decompose the residuals’ series into the chaotic and the noise component which leads to:

Where qWT (t) is the wavelet filtered component and qnoise (t) the noise component. The first component is equivalent to an embedding of the filtered series in figure 19 left and the second is equivalent to an embedding of the noise series in figure 19 right.
Calculating the main chaotic and fractal analysis metrics on the wavelet filtered series and the wavelet filtered component, as shown in Table 2, we find that the box counting dimension is unchanged, up to a four decimal places’ approximation, there is, in fact, a slight difference between the original residuals’ series phase space trajectory’s fractal dimension and the filtered series’ trajectory with a reduction of -4.1913e-05 in the dimension for the wavelet filtered trajectory, however, this is a very small reduction.
| Residuals | Original | Denoised | Variation |
|---|---|---|---|
| Largest Lyapunov Exponent (LLE) | 0.0021 | 0.0053 | 0.0032 |
| Box counting dimension | 1.60479 | 1.60475 | -4.19E-05 |
| Max h(q) | 0.3048 | 0.3015 | -0.0034 |
| Min h(q) | 0.1676 | 0.1652 | -0.0024 |
| Spectrum amplitude | 0.1372 | 0.1363 | -0.001 |
Table 2: Main metrics for the denoised versus original residuals’ series.
The largest Lyapunov exponent rises slightly from 0.0021 to 0.0053, which is consistent with the hypothesis that the noise was a factor in the reduction of the Lyapunov exponent value. However, the dynamics is still characterized by weak chaos.
The multifractal spectrum has a similar profile, however, there is a slight decrease in the spectrum amplitude and the maximum and minimum generalized Hurst exponents are shifted to lower values, which means that the wavelet-filtered dynamics is shifted more into the anti-persistent region, showing that the source of the anti- persistent multifractal dynamics in the residuals’ series is effectively linked to the second chaotic attractor.
In Figure 20, we show the average recurrence strength and the conditional 100% recurrence probability for the embedded denoised series, the profile is similar to that of the original residuals shown in Figure 18, there are, however, a few differences, namely, the average recurrence strength actually increases with the mean value being now around 0.4056, while, for the original residuals’ embedded series, it was 0.3909, likewise, the probability of a diagonal with recurrence being a 100% recurrence line, increased from 0.0265 to 0.0328, in the embedded denoised series. In this way, the noise led to a slight decrease in the recurrence structure of the anti-persistent second attractor.
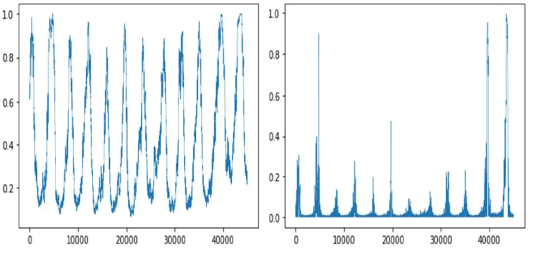
Figure 20: Average recurrence strength (left) and conditional 100% diagonal line probability (right), obtained for a 240 phase points sliding window for the embedded denoised residuals’ series, using the same radius as in figure 18.
Thus, despite the slight rise in the largest Lyapunov exponent, there is an increase in the recurrence structure, with the denoising process. Now, turning to the noise process, we look at the noise series shown in figure 19 right.
In this case, we find that there is a significant autocorrelation, with the Box-Ljung statistic having an estimated value of 4101.9746 with an associated p-value of 0.0 for a lag of 1, the autocorrelation function and partial autocorrelation exhibiting a fast decay to zero (Figure 21).
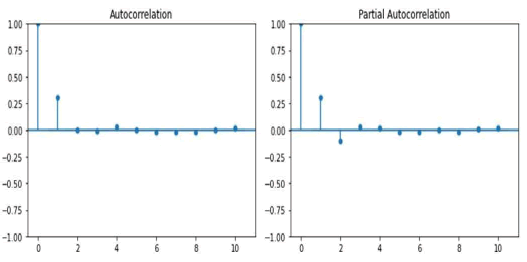
Figure 21: Autocorrelation and partial autocorrelation functions for the noise process.
We found that the only way to remove the autocorrelation leading to a white noise process is to estimate a ARIMA (1,0,1) process. In Table 3, we show the results of the estimation of the ARIMA model.
| Coefficients | Value | Std. Error |
|---|---|---|
| c | 0.0209 | 0.005 |
| AR(1) | 0.0288 | 0.015 |
| MA(1) | 0.3043 | 0.014 |
| Log-likelihood | -57554.8 |
Table 3: ARIMA (1,0,1) model estimation results.
The use of the normal distribution in the ARIMA filtering needs to be interpreted as a pseudo-likelihood, since, in this case, as we will see, the distribution of the ARIMA residuals’ is not Gaussian but, instead, described by a rescaled beta distribution, a point to which we will return further on.
The filtering of the ARIMA component leads to the removal of any dependence in the noise series, as shown in Table 4. In this case, the Box-Ljung’s test’s null hypothesis is no longer rejected, nor is any heteroskedasticicty found.
| Test Statistic | p-value | |
|---|---|---|
| BDS sample 1 (22624) | -1.1579 | 0.2469 |
| BDS sample 2 (22625) | -1.1341 | 0.2568 |
| Ljung-Box (L1) (Q) | 0 | 0.97 |
| Heteroskedasticity (H) | 0.99 | 0.4 |
| Kolmogorov-Smirnov test normal | 0.0185 | 6.28E-14 |
| Kolmogorov-Smirnov test beta | 0.0065 | 0.0422 |
Table 4: Diagnostic tests on ARIMA residuals.
Now, we need to go further than these two tests and test whether we are dealing with IID noise, the full dataset, however, proved computationally too large to apply the BDS test for independence with the full sample, so we divided the sample in two subsamples around the middle observation and calculated the BDS test on each subsample, we used a maximum embedding dimension of 2, in both cases, we found the null hypothesis not to be rejected, in this sense, the ARIMA residuals are indistinguishable from IID noise, as also shown in Table 4 [30].
The Kolmogorov-Smirnov test for a fitted Gaussian distribution leads to the rejection of the null hypothesis, however, for a fitted beta distribution the null hypothesis of the test holds for a 2.5% and 1% significance levels, which means that the ARIMA filtering allowed for the removal of any dependences, and the resulting residuals are statistically indistinguishable from IID noise with an approximate beta distribution.
The distribution is actually close to a generalized rescaled beta distribution with the following structure.

For, μ ≤ u ≤ σ + μ, with the estimated parameters a=5.1634, b=5.3156, μ =-2.8782, σ =5.8419.
In Figure 22, we show the ARIMA residuals’ histogram with the fitted beta distribution.
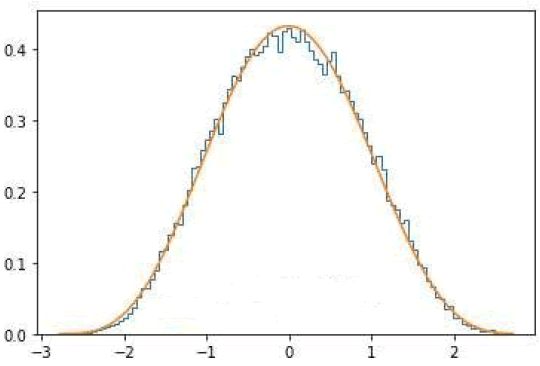
Figure 22: Histogram for the estimated ARIMA (1,0,1)’s residuals and
fitted beta distribution. Note: ARIMA residuals histogram: ( ); Beta
pdf: (
 )
)
Given the above results, the evidence is that the sunspots’ dynamics is driven by a stochastic chaos dynamics characterized by three components, the first component results from an emergent two- dimensional chaotic attractor that is responsible for the long-wave dynamics and for fractal and multifractal markers of SOC leading to strong persistence in the sunspots’ series.
The second component is characterized by a multifractal anti- persistent dynamics that results from another emergent two- dimensional chaotic attractor that reduces the persistence of the long-wave dynamics compensating for the strong persistence of the first process and being responsible for an intermittent turbulent dynamics.
The third component follows an ARIMA (1,0,1) with residuals that follow an IID noise process characterized by a rescaled beta distribution.
Using the topological adaptive agent and the wavelet decomposition along with delay embedding, we were able to identify and study the two chaotic attractors’ dynamics, it also allowed us to remove all the low-dimensional chaotic components of the dynamics along with the ARIMA (1,0,1) dependence reaching a final IID noise term.
Conclusion
In complex systems’ dynamics the identification of emergent noisy chaotic attractors demands the study of both those attractors and of the possible noise processes present. Namely, what may be considered as a first decomposition between attractor and noise may prove to be a more complex process. Namely, the presence of multiple attractors and also complex noise processes need to be researched for a full characterization of the dynamics.
In the present work, we applied a topological machine learning- based approach for dealing with stochastic chaos that allows not only the identification of possible attractors but also the research of the residuals’ processes for further dynamics. Applying this framework to the sunspots’ data we found the presence of not one but two low- dimensional chaotic dynamics plus an ARIMA (1,0,1) process with IID noise.
In this way, while we are dealing with stochastic chaos, but the type of process is not as simple as a single chaotic attractor plus an IID noise process. Indeed, the two chaotic attractors play a key role in the dynamics. The first attractor, which is the dominant attractor, accounting for more than 80% of the variability of the data, is linked to the long-wave dynamics of the sunspots and to the main markers of SOC, including the power law decay in the power spectrum, the strong persistence in the dynamics, the power law scaling in the distribution of events and also the main multifractal scaling profile in the sunspots’ data.
The second chaotic attractor, which is not directly visible in the sunspots’ data, is linked to an anti-persistent multifractal dynamics and, while not changing the main profile of the SOC for the sunspots, reduces the persistence of that process.
These two attractors are affected by an ARIMA (1,0,1) process with IID residuals. The fact that we were able to decompose the original process into its three components reaching, in the end, an IID noise term means that, applying the main methodological approach, we were effectively able to extract all of the main dynamics present in the original data.
The decomposition method described in this work and illustrated for the sunspots’ data can be applied to other contexts of applications of the new empirical methods from chaos theory, enriched by machine learning and topological data analysis.
References
- Watson FT, Fletcher L, Marshall S. Evolution of sunspot properties during solar cycle 23. Astronom Astrophys. 2011;533:A14.
- National Weather Service, United States. The Sun and Sunspots. c2024
- Oloketuyi J, Liu Y, Elmhamdi A. Investigating the associations between solar flares and magnetic complexity of active regions. New Astronomy. 2023;100:101972.
- Lin J, Wang F, Deng L, Deng H, Mei Y, Zhang X. Evolutionary relationship between sunspot groups and soft x-ray flares over solar cycles 21–25. Astrophys J. 2023;958(1):1.
- Neff JS. Self-Organized criticality and sunspot groups. Bulletin of the American Astronomical Society, 1994;26:1464.
- Pavlos GP, Dialetis D, Kyriakou GA, Sarris ET. A preliminary low-dimensional chaotic analysis of the solar cycle. Ann Geophysicae. 1992;10(10):759-762.
- Karakatsanis LP, Pavlos GP. SOC and chaos into the solar activity. Nonlinear Phenomena in Complex Systems. 2008;11(2):280-284.
- Letellier C, Aguirre LA, Maquet J, Gilmore R. Evidence for low dimensional chaos in sunspot cycles. Astronom Astrophys. 2006;449(1):379-387.
- Karakatsanis LP, Pavlos GP, Iliopoulos AC, Tsoutsouras VG, Pavlos EG. Evidence for coexistence of SOC, intermittent turbulence and low-dimensional chaos processes in solar Flare dynamics. AIP Conference Proceedings. 2011;1320(1):55-64.
- Pavlos GP, Karakatsanis LP, Xenakis MN. Tsallis non-extensive statistics, intermittent turbulence, SOC and chaos in the solar plasma, Part one: Sunspot dynamics. Phys A. 2012;391(24):6287-6319.
- Vieira MS, Lichtenberg AJ. Presence of chaos in a self-organized critical system. Phys Rev E. 1996;53(2):1441-1445.
[Crossref] [GoogleScholar] [Pubmed]
- Chang T. Self-organized criticality, multi-fractal spectra, sporadic localized reconnections and intermittent turbulence in the magnetotail. Phys Plasmas.1999;6(11):4137-4145.
- Gonçalves CP. Financial turbulence, business cycles and intrinsic time in an artificial economy. Algor Fin. 2011;1(2):141-156.
- Gonçalves CP. Quantum financial economics–Risk and returns. J Syst Sci Complex. 2013;26(2):187-200.
- Gonçalves CP. Chaos-induced self-organized criticality in stock market volatilityan application of smart topological data analysis. Int J Swarm Evol Comput. 2023;12(5):331.
- Gonçalves CP. Epidemiological rogue waves and chaos-induced multifractal self-organized criticality in COVID-19. Int J Swarm Evol Comput. 2024;13(3):367.
- Haken H. Synergetics–Introduction and advanced topics. Berlin, Springer, 2004.
[Crossref]
- Peitgen H-O, Jürgens H, Saupe D. Chaos and fractals–New frontiers of science. Springer, USA, 2004.
- Koutsoyiannis D. The hurst phenomenon and fractional Gaussian noise made easy. Hydrol Sci J. 2002;47(4): 573-595.
- Gorjão LR, Hassana G, Kurths J, Witthauta D. MFDFA: Efficient multifractaln detrended fluctuation analysis in python. Comp Phys Commun. 2022;273:108254.
- Takens F. Detecting strange attractors in turbulence. Springer. 1980;898:366-381.
- Gonçalves CP. Low dimensional chaotic attractors in daily hospital occupancy from covid-19 in the USA and Canada. Int J Swarm Evol Comput. 2023;12(1):1000291.
- Rosenstein MT, Collins JJ, De Luca CJ. A practical method for calculating largest Lyapunov exponents from small data sets. Phys D: Nonlin Phen. 1993;65(1-2):117-134.
- SILSO, World Data Center-Sunspot Number and Long-term Solar Observations, Royal Observatory of Belgium.
- Kaneko K, Tsuda I. Complex systems: Chaos and beyond: A constructive approach with applications in life sciences. Berlin, Springer, 2001.
- Gonçalves CP. Low dimensional chaotic attractors in SARS-CoV-2’s regional epidemiological data. Int J Swarm Evol Comput. 2022;11(9):271.
- Mandelbrot BB. Fractals and scaling in finance. Springer, New York, 1997.
- Bak P, Tang C, Wiesenfeld K. Self-organized criticality: An explanation of 1/f noise. Phys Rev Lett. 1987;59(4):381-384.
- Bak P, Paczuski M. Complexity, contingency and criticality. Proc Natl Acad Sci. 1995;92(15):6680-6696.
[Crossref] [Google Scholar] [Pubmed]
- Brock WA, Scheinkman JA, Dechert WD, LeBaron B. A test for independence based on the correlation dimension. Econom Rev. 1996;15(3):197–235.
Citation: Gonçalves CP (2024) Topological Machine Learning and Chaotic Attractors Decomposition–An Application to Sunspot Chaos. Int J Swarm Evol Comput. 13:387.
Copyright: © 2024 Gonçalves CP. This is an open-access article distributed under the terms of the Creative Commons Attribution License, which permits unrestricted use, distribution, and reproduction in any medium, provided the original author and source are credited.
