Indexed In
- Academic Journals Database
- Open J Gate
- Genamics JournalSeek
- Academic Keys
- JournalTOCs
- China National Knowledge Infrastructure (CNKI)
- Ulrich's Periodicals Directory
- Electronic Journals Library
- RefSeek
- Hamdard University
- EBSCO A-Z
- OCLC- WorldCat
- SWB online catalog
- Virtual Library of Biology (vifabio)
- Publons
- Geneva Foundation for Medical Education and Research
- Euro Pub
- Google Scholar
Useful Links
Share This Page
Journal Flyer
Open Access Journals
- Agri and Aquaculture
- Biochemistry
- Bioinformatics & Systems Biology
- Business & Management
- Chemistry
- Clinical Sciences
- Engineering
- Food & Nutrition
- General Science
- Genetics & Molecular Biology
- Immunology & Microbiology
- Medical Sciences
- Neuroscience & Psychology
- Nursing & Health Care
- Pharmaceutical Sciences
Research Article - (2019) Volume 10, Issue 2
Tolerance Induction Program Effect Explains Variation in Wheal Size, sIgE, and IgG4 in Peanut Allergic Children
Inderpal Randhawa*Received: 03-Jun-2019 Published: 25-Jul-2019
Abstract
Background: Tolerance induction oral immunotherapy, unique to our centre and termed the Tolerance Induction Program (TIP), has shown promise as a safe form of treatment in peanut allergic children. Evaluations of emerging treatments for peanut allergy typically report from a population average perspective. Our study sought to compare rate of decline in peanut-skin prick testing wheal size and sIgE following one year of high dose, weekly peanut immunotherapy using the standard population average approach to findings that account for subject variation in intercepts and slopes.
Methods: This is a descriptive study in 51 peanut allergic children who underwent TIP at the Translational Pulmonary and Immunology Research Centre in Long Beach, California. Post intervention reductions in peanutwheal size and sIgE were assessed using Wilcoxen signed rank test and mixed effects modelling procedures.
Results: The population average approach estimated reduction in wheal size to 29% of baseline value (p<0.001), compared to 41% after adjustment for random intercepts and slopes, p<0.001. Reduction in sIgE to 30% of baseline value using the population average approach (p<0.001), compared to 46% in the random intercepts model (p<0.001),
and 44% in the random intercepts and slopes model (p=0.064).
Conclusions: Tolerance induction oral immunotherapy significantly reduced peanut-SPT wheal size and sIgE in peanut allergic children. The subject specific approach produced more conservative effect estimates than observed using the standard population average approach.
Introduction
Peanut allergy has the highest mortality rate among food-induced allergic reactions in the United States [1]. Albeit rare, food anaphylaxis mortality is recognized with particular risk in treatment refractory states which may involve 3-5% of severe reactions [2]. Allergen avoidance is the first line of defense. Immunotherapy provides a pathway from avoidance to prevention by desensitization that has high potential impact given only ~20% of children at best may reduce their peanut allergy with age [2,3]. However, classical Oral Immunotherapy (OIT) studies demonstrate reaction rates and epinephrine use are both higher in patients undergoing OIT compared to patients either receiving placebo or practicing strict avoidance [4]. Additionally, OIT studies rarely demonstrate the aspects of long term efficacy with intermittent sustained unresponsiveness.
Children who demonstrate positive peanut allergy diagnostics in Skin Prick Test (SPT) wheal size (>3 mm) and sIgE (>0.35 kU/L) present the classical at risk phenotype of anaphylaxis [4]. With the addition of clinical history of anaphylaxis and elevated serum IgE component resolved diagnostics specific to peanut, the classical at risk group evolves into the highest risk group of anaphylaxis demonstrating both sensitization and clinical reactivity [5]. To date, peanut oral immunotherapy focuses on minimal desensitization evidenced by the patient’s ability to pass a 600 mg to 4,000 mg peanut protein challenge [6]. Such a threshold results in the clinical belief a patient may now be exposed to small amounts of peanut accidentally without clinical reactivity thus mitigating disease risk. However, the long term compliance to such daily regimens has been called into doubt thereby limiting the benefit of such an approach [7]. Our centre, utilizing complex molecular analytics, evaluates hundreds of markers specific to each patient to individually desensitize peanut anaphylactic patients to 30 g of peanut protein safely. Upon passing a 30 g protein challenge, equivalent to 75-80 peanuts, patients demonstrate 7 days of sustained unresponsiveness. Essentially, patients at this stage are able to eat 25-30 g of peanut protein once weekly thereby achieving a unique form of tolerance “induction” allowing patients to eat substantial amounts of peanuts without mounting an allergic molecular or clinical immune response. Our Tolerance Induction Program (TIP) has shown promise as a form of treatment in peanut anaphylactic children [8]. An integral next step in assessing TIP effectiveness requires an approach that aligns with precision medicine [9] and considers confluence of non-normal data [10,11].
No forms of oral immunotherapy to date set a primary goal of achieving very high-dose oral immunotherapy administered in weekly intervals. In patient groups treated for several years utilizing low dose classical oral immunotherapy, only 0.07% of patients would qualify for a 4 week sustained unresponsiveness challenge [12]. The risk of receiving high dose oral immunotherapy must be closely monitored while undergoing treatment and to protect against reactions post immunotherapy after achieving maintenance dosing schedule [13-16]. Similarly, the maintenance model of dosing must reflect typical patient compliance in any form of treatment. The TIP protocol focuses on achieving a one week interval, high dose protein intake schedule thus balancing compliance and efficacy. Our study focuses on the one year impact of this approach on a cohort of TIP patients.
The majority of studies to date have examined improvement following oral immunotherapy based on the average effect in their study population. Our study proposes to examine differential baseline sensitization and responses to tolerance induction via TIP across subjects and to quantify average effectiveness using individual patient trajectories as compared to expectations based on a population averaged approach.
Methods
Patients
This was a descriptive study in peanut allergic children ages 6-15 years who received TIP therapy at TPIRC from January 2014 to July 2016. Inclusion criteria were patients maintained at least one anaphylactic episode of clinical history of Grade 2 anaphylaxis or higher within 5 years of study entry, and demonstrated a peanut SPT>3 mm and Ara h2 component resolved diagnostics>1.0 kU/L. No food challenge to peanut was required. Patients were all endotype 1 of 5 who met specific molecular cut-offs defined by hundreds of pro allergic and tolerance markers. Each parent and patient was told the standard of care for peanut allergy was avoidance and preparedness for treating reactions. Written informed consent was obtained under the Institutional Review Board at Miller Children’s and Women’s Hospital, Long Beach, California.
Study process and design
TIP involves utilization of support vector machine analytics assessing hundreds of pro allergic markers (skin prick testing, component resolved diagnostics, immunocap specific IgE, histamine release assay, peripheral eosinophil count) as well as tolerance markers (cytokine profiles, IgG4 specifics, total IgG4, total IgG) across collected patient data since 2007. Currently, the analytics process organizes an incoming patient’s specific markers against the molecular groupings of the database. Once analyzed, the patient’s markers are assessed into an endotype solely based on molecular data and then the defatted peanut protein product composition is tailored to their specific markers rather than a uniform dose population approach. Specific homologous epitopes associated amongst plant proteins available on the plant protein database pFAM14 are utilized to generate treatment algorithms resulting in direct oral food challenges or rapid sequence immunotherapy followed by food challenges in preparation for TIP peanut exposure. Peanut product utilized in treatment involved whole peanut protein from runner peanuts allowing for the total exposure of peanut storage proteins and other epitopes (85% defatted peanut milled flour). Peanut dosing began with 1 mg whole peanut protein followed by weekly escalations at home. Intermittent 6 week up dose challenges occurred reaching 80 mg, 400 mg, and 2,000 mg. The final peanut food challenge in the initial plateau phase of TIP was 12,000 mg (32-33 peanuts). After passing the 10 g peanut protein challenge, patients maintained 8 g peanut protein daily (20-22 peanuts) for 4 months. The patients then underwent a 30 g peanut protein challenge (75 peanuts) followed by weekly maintenance of 30 g once weekly. The patients could eat trace exposures of peanut (<1 g of peanut protein) in the interval time period weekly. The protocol permitted adjustments to the weekly home up-dosing schedule as needed, for example, temporary dose stoppages were allowed while subjects were suffering from symptoms of an upper respiratory infection or influenza, or during menses. Subjects were cautioned against activities likely to increase reactivity within one hour after dosing. After one year of high dose peanut protein exposure at 30 g weekly, patients underwent repeat marker analysis. The exposure rate as described served as a template of sustained unresponsiveness where the amount of exposure between dose exposure and non-exposure is reflective of real world dietary risk exposure.
No patients were on omalizumab prior or during treatment. No patients were on any form of systemic steroids as well. Only as needed antihistamines were utilized by patient preference for seasonal rhinitis symptoms.
Assessment of clinical efficacy and side effects
The Translational Pulmonary and Immunology Research Center’s (TPIRC) food allergy branch in Long Beach, California, performs extensive RAST and skin-prick testing to peanut in addition to measurement of other entry diagnostic markers. Specific IgE antibodies to peanut were measured using the ImmunoCap (Phadia, Kalamazoo, MI) fluorescent enzyme immunoassay in our laboratory. Additional measures collected at baseline and 12 month follow-up included Ara h pro allergy markers Ara h 1, Ara h 2, Ara h 3, Ara h 8, and Ara h 9, antiallergy marker IgG4-peanut, and associated markers IgG subclass 4, IgG total, and IgE total. Adverse events were documented utilizing a 24/7 on call phone and email system which records every adverse event. Patient diaries were not used. However, patient intake assessments were taken during every visit to assure compliance and provide a secondary source of adverse event data.
Statistical analyses
In the 51 patients, distribution of pro-allergy, anti-allergy, and associated markers were described by median [IQR] at baseline (pre) and 12 months later (post intervention). Wilcoxon-sign rank test assessed significance of distributional shift for each marker. Next, a subject-specific approach using mixed effects modelling assessed outcomes peanut-SPT wheal size and sIgE under two model assumptions: M1) random intercept and fixed slope, and M2) random intercept and random slope. These models were compared to the reduced model that assumed no intervention effect (no fixed effect included in model) by calling ANOVA on the fitted object and performing the LR test on variance components using the χ2 distribution. This process was repeated in examination of anti-allergy marker IgG4 peanut. The generalized linear mixed modelling procedure used the package (lme4) in R with specification of gamma family and log link. Analyses were performed using R version 3.5.0 (R Foundation for Statistical Computing, Vienna, Austria).
Results
Compliance and adverse events
Patient reported compliance on weekly 30 g dose requirements was 87% across 3 month intervals during one year of follow up.
No significant gastrointestinal events were reported. Two patients reported intermittent oral pruritus which did not require treatment. One patient reported one episode of urticaria outside of 72 hours of treatment dose which responded to diphenhydramine. No patient suffered anaphylaxis during immunotherapy.
Tolerance induction program effect on parameters using an average population approach
Profile of pro-allergy, anti-allergy, and associated markers in the pre and post periods is described for our patient population in Table 1. SPT wheal size shrank from a median of 14.0 to 4.0 mm in the population, p<0.001. Peanut specific IgE reduced from a median of 53 to 16 kU/L, p<0.001. Ara h components also significantly decreased following the intervention (p<0.05), with exception of Ara h 9 (p=0.147). Anti-allergy marker IgG4 increased substantially from a median of 1,190 to 12,400 μg/ml, p<0.001. On average, associated IgG markers increased and total IgE decreased, p<0.05
Table 1: Describes change in pro allergy, anti-allergy, and associated markers from a population perspective (N=51 patients). ¤P-value based on Wilcoxen sign rank test and median [IQR] reported; bRatio of IgG4/IgE calculated after conversion of units for IgE to ng/ml [IgE*2.4]; Log10 (IgG4/IgE)=LN(IgG4/IgE)/LN(10).
| Pre | Post | P-value¤ | |
|---|---|---|---|
| Pro allergy markers | Median [IQR] | Median [IQR] | |
| SPT Peanut (mm) | 14.00 [5.50-20.00] | 4.00 [2.00-9.00] | P<0.001 |
| Peanut IgE (kU/L) | 53.00 [5.75-101.00] | 16.10 [3.25,41.90] | P<0.001 |
| Arah Components | |||
| Ara 1 | 1.20 [0.54-14.85] | 1.60 [0.17-6.67] | P<0.001 |
| Ara 2 | 20.50 [2.26-101.00] | 13.30 [1.08-40.35] | P<0.001 |
| Ara 3 | 0.40 [0.06-5.26] | 0.21 [0.00-1.62] | P<0.001 |
| Ara 8 | 0.00 [0.00-0.00] | 0.00 [0.00-0.00] | P=0.034 |
| Ara 9 | 0.00 [0.00-0.00] | 0.00 [0.00-0.10] | P=0.147 |
| Anti-allergy marker | |||
| IgG4 Peanut (μg/ml) | 1190 [340, 2310] | 12400 [9515, 25300] | P<0.001 |
| Associated markers | |||
| IgG Subclass 4 (μg/ml) | 22000 [4000, 32100] | 47000 [32500, 75100] | P<0.001 |
| IgG Total (μg/ml) | 896000 [745000, 960500] | 910000 [843850, 1126500] | P<0.001 |
| Total IgE (kU/L) | 397.0 [159.5-945.5] | 315.0 [151.5-539.5] | P=0.041 |
| Ratio IgG4/IgE b | 0.91 [0.30-2.42] | 16.40 [6.14-31.05] | P<0.001 |
| Log10 (IgG4/IgE) | 0.05 [-0.36, 0.47] | 1.27 [0.79, 1.54] | P<0.001 |
Tolerance induction program effect on SPT peanut specific wheal size
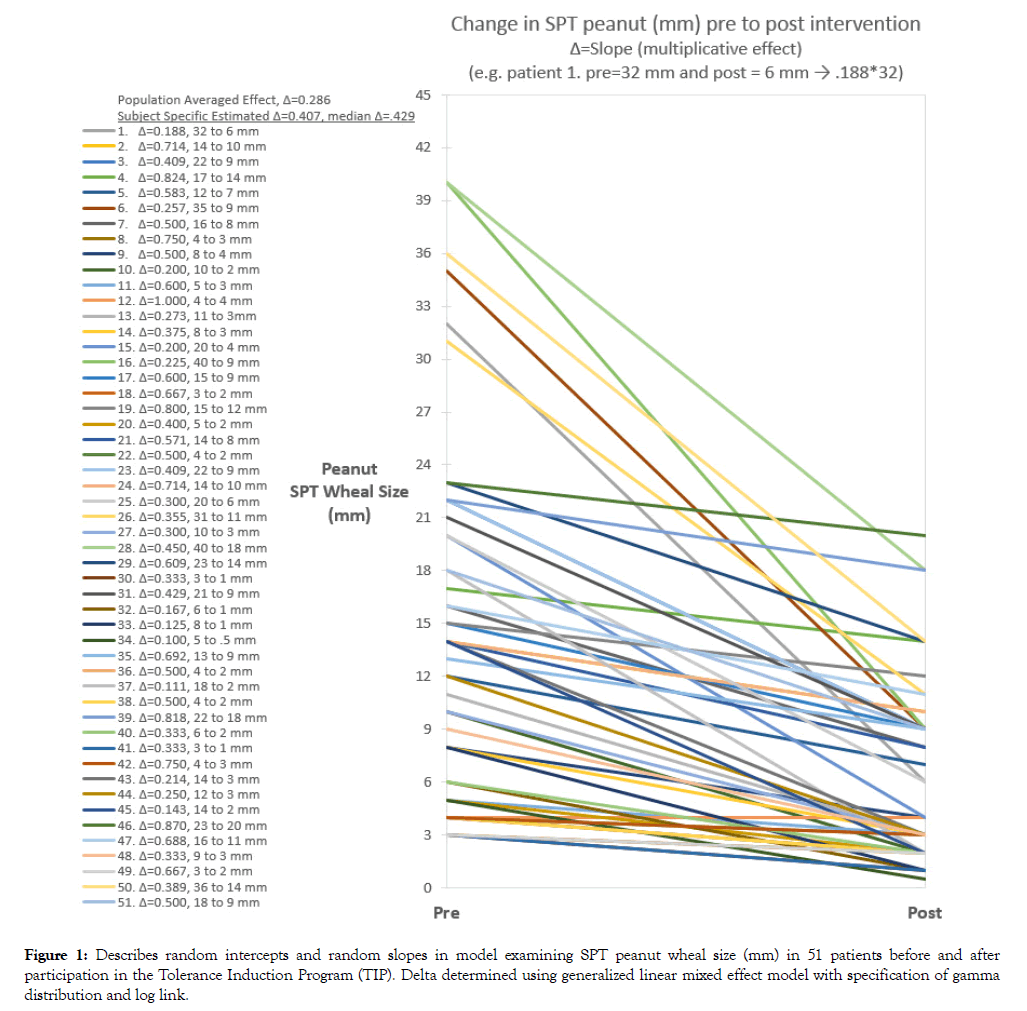
SPT peanut specific wheal size was reduced post intervention to 41% of the baseline value after adjustment for random intercepts, M1 p<0.001, and with adjustment for both random intercepts and slopes, M2 p<0.001 (Table 2). Wheal size reduction estimated from M2 was -6.7 mm (11.3 to 4.6 mm). Trajectory of SPT wheal size pre to post period for each subject is shown in Figure 1. The median reduction based on the subject specific model was to 43% of the baseline size compared to 29% using the population average approach. This translated to an average reduction of -6.0 mm compared to -10.0 mm, respectively, assuming an initial wheal size of 14 mm (median).
Table 2: SPT peanut wheal size (mm) estimated under two model assumptions (random intercept and fixed slope, random intercept and random slope). Model parameters and effects are described for both modelsa
| Model term estimates on the log scale (∆ is in original units) | M1 Random Intercept and Fixed Slope | M2 Random Intercept and Random Slope |
|---|---|---|
| Model Summary | ||
| σs | 0.626 | 0.059 |
| σt:s | ---- | 1.073 |
| σ | 0.426 | 0.00004 |
| µ(SE), p-value | 2.394 (0.141), p<0.001 | 2.428 (0.083), p<0.001 |
| α1(SE), p-value | -0.903 (0.064), p<0.001 | -0.898 (0.150), p<0.001 |
| ∆, slope=EXP(α1) | ∆=0.405, assume fixed slope | ∆=0.407, assume random slopes Median ∆=0.429 IQR [0.286, 0.638] |
| PRE estimated intercept on original scale=EXP(µ) | 11.0 mm | 11.3 mm |
| POST estimated from pre intercept value=∆*PRE | 4.4 mm | 4.6 mm |
| LR test | M1 vs. M0b, | M2 vs. M0b, |
| Χ2(1), p<0.001 | Χ2(3), p<0.001 |
aThe generalized linear mixed modelling procedure with specification of gamma family and log link;
bModel was compared to the reduced model (M0) that assumed no intervention effect (random intercept only) by calling ANOVA on the fitted object and performing the LR test on variance components using the Χ2 distribution; σ=standard deviation for random effects on log scale; σs=subject standard deviation; σt:s=effect of difference from pre to post variability across subjects standard deviation; σ=error standard deviation; µ=overall intercept (coefficient for fixed effect for SPT in pre period on log scale); ð›¼1=coefficient for fixed effect of time (pre vs. post) on log scale; ∆ represents the multiplicative effect on the original scale determined by exponentiation (e.g. ∆ of 0.407 would indicate expected reduction to 40.7% of original value, say from 11.3 to 4.6=(0.407*11.3 mm)).
Figure 1: Describes random intercepts and random slopes in model examining SPT peanut wheal size (mm) in 51 patients before and after participation in the Tolerance Induction Program (TIP). Delta determined using generalized linear mixed effect model with specification of gamma distribution and log link.
Tolerance induction program effect on peanut specific IgE level
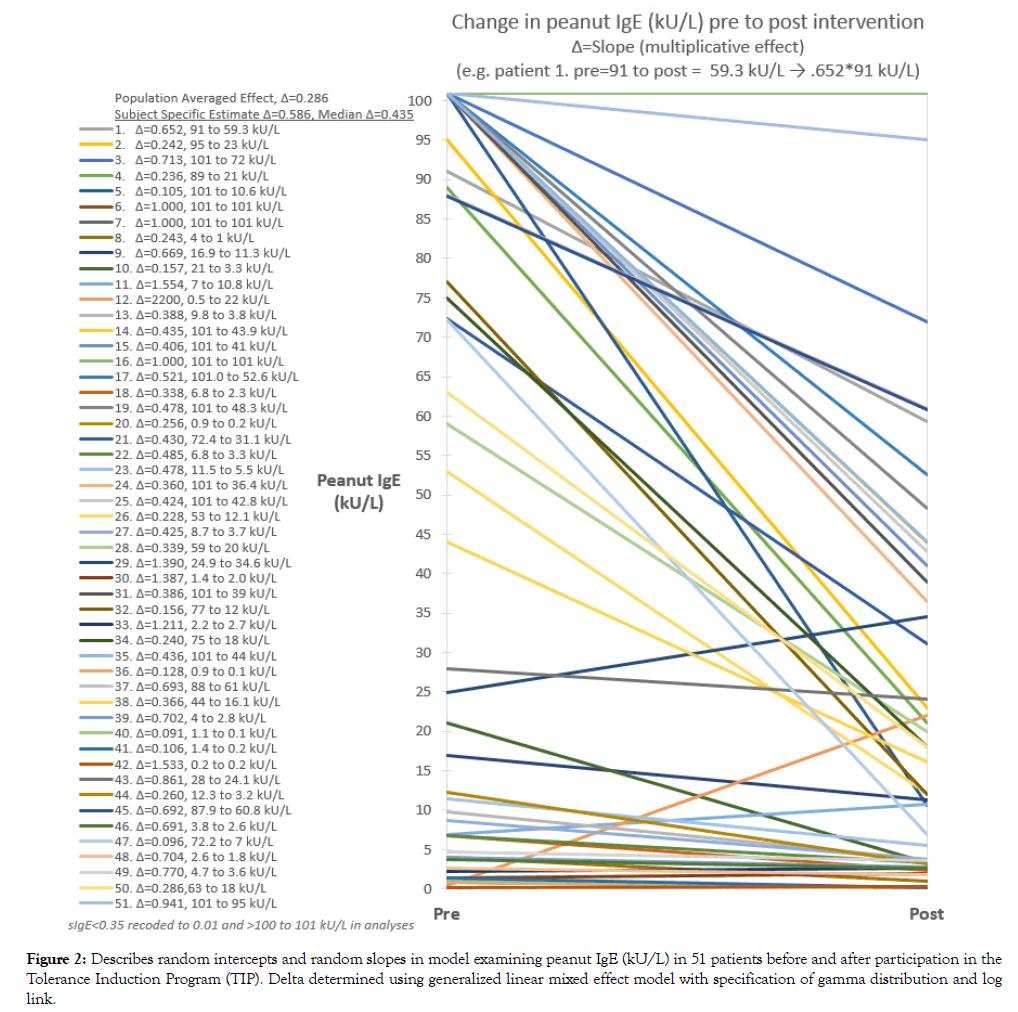
Peanut specific IgE was reduced to 46% of the baseline value in the random intercepts model, M1 p<0.001, and to 59% of the baseline value in the random intercept and random slopes model, M2, p=0.064) (Table 3). Peanut sIgE reduction estimated from M2 was -9.2 kU/L (22.2 to 13.0 kU/L). Trajectory of peanut sIgE from pre to post period for each subject is shown in Figure 2. Median reduction based on the subject specific model was to 44% of the baseline level compared to 30% using the population averaged approach. This translated to an average reduction in peanut specific IgE of -30 kU/L compared to -37 kU/L, respectively, assuming an initial sIgE level of 53 kU/L (median).
Table 3: Peanut specific IgE (kU/L) estimated under two model assumptions (random intercept and fixed slope, random intercept and random slope). Model parameters and effects are described for both modelsa
| Model term estimates on the log scale (∆ is in original units) | M1 Random Intercept and Fixed Slope | M2 Random Intercept and Random Slope |
|---|---|---|
| Model Summary | ||
| σs | 1.361 | 2.344 |
| σt:s | ---- | 2.063 |
| σ | 0.626 | 0.0001 |
| µ(SE), p-value | 3.055 (0.278), p<0.001 | 3.102 (0.328), p<0.001 |
| α1(SE), p-value | -0.780 (0.097), p<0.001 | -0.535 (0.289), p=0.064 |
| ∆, slope=EXP(α1) | ∆=0.458, assume fixed slope | ∆=0.586, assume random slopes Median ∆=0.435 IQR [0.258, 0.708] |
| PRE estimated intercept on original scale=EXP(µ) | 21.2 kU/L | 22.2 kU/L |
| POST estimated from pre intercept value=∆*PRE | 9.7 kU/L | 13.0 kU/L |
| LR test | M1 vs. M0 b, | M2 vs. M0 b, |
| Χ2(1), p<0.001 | Χ2(3), p<0.001 |
aThe generalized linear mixed modelling procedure with specification of gamma family and log link;
bModel was compared to the reduced model (M0) that assumed no intervention effect (random intercept only) by calling ANOVA on the fitted object and performing the LR test on variance components using the Χ2 distribution; σ=standard deviation for random effects on log scale; σs=subject standard deviation; σt:s=effect of difference from pre to post variability across subjects standard deviation; σ=error standard deviation; µ=overall intercept (coefficient for fixed effect for peanut specific IgE in pre period on log scale); ð›¼1=coefficient for fixed effect of time (pre vs. post) on log scale; ∆ represents the multiplicative effect on the original scale determined by exponentiation (e.g. ∆ of 0.586 would indicate expected reduction to 58.6% of original value, say from 22.2 to 13.0=(0.586*22.2 kU/L)).
Figure 2: Describes random intercepts and random slopes in model examining peanut IgE (kU/L) in 51 patients before and after participation in the Tolerance Induction Program (TIP). Delta determined using generalized linear mixed effect model with specification of gamma distribution and log link.
Tolerance induction program effect explains significant variation in peanut specific wheal size, sIgE, and antiallergy marker IgG4 peanut
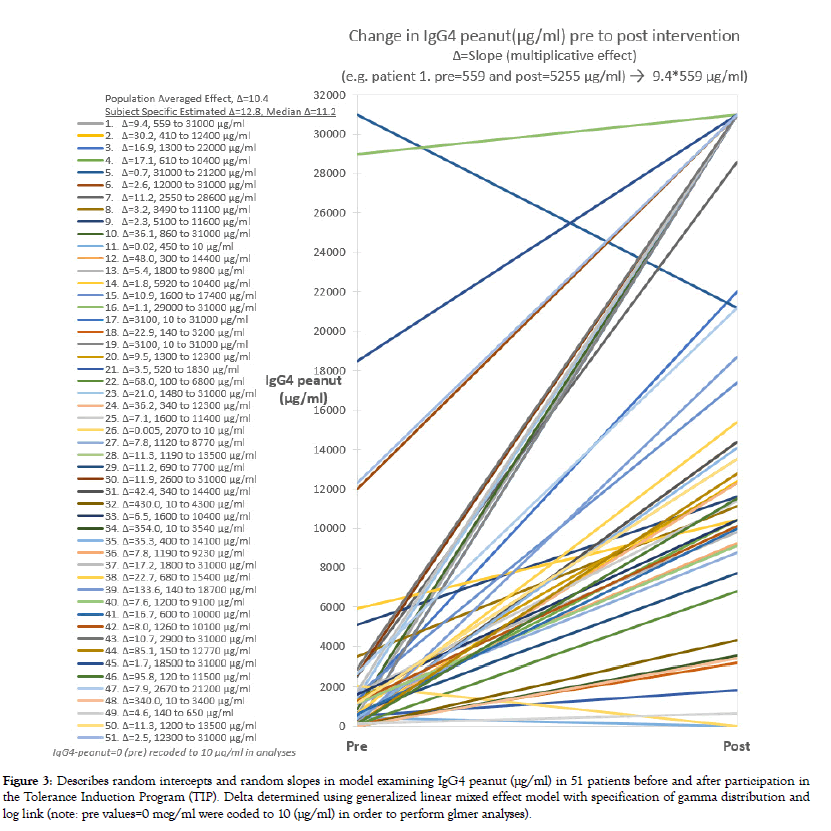
Models that included a time effect improved upon the null model that adjusted only for subject variation providing further evidence of intervention effectiveness in reducing patient skin test response and peanut specific IgE levels (LR tests, p<0.001, Tables 1 and 2). After the 12 month intervention, 29.4% of the 51 patients achieved a SPT wheal size <3 mm and 9.8% a sIgE value <0.35 kU/L. In 7.8% both RAST and SPT benchmarks were achieved by the study endpoint. As expected, the antiallergy marker IgG4 peanut (μg/ml) increased in nearly all patients (p<0.001) (Figure 3). On average, IgG4 peanut increased to 11.2 times the baseline value in the random effects model (Table 4). This was similar to the estimate based on the population average approach (10.4x).
Table 4: IgG4 peanut (µg/ml) estimated under two model assumptions (random intercept and fixed slope, random intercept and random slope). Model parameters and effects are described for both modelsa
| Model term estimates on the log scale (∆ is in original units) | M1 Random Intercept and Fixed Slope | M2 Random Intercept and Random Slope |
|---|---|---|
| Model Summary | ||
| σs | 0.783 | 1.546 |
| σt:s | ---- | 2.843 |
| σ | 0.91 | 0.00007 |
| µ(SE), p-value | 7.257 (0.216), p<0.001 | 6.633 (0.217), p<0.001 |
| α1(SE), p-value | 2.250 (0.225), p<0.001 | 2.547 (0.398), p<0.001 |
| ∆, slope=EXP(α1) | ∆=9.484, assume fixed slope | ∆=12.769 Median ∆=11.2 IQR [6.0, 35.6] |
| PRE estimated intercept on original scale=EXP(µ) | 1418 µg/ml | 760 µg/ml |
| POST estimated from pre intercept value=∆*PRE | 13448 µg/ml | 9704 µg/ml |
| LR test | M1 vs. M0, | M2 vs. M0, |
| Χ2(1), p<0.001 | Χ2(3), p<0.001 |
aThe generalized linear mixed modelling procedure with specification of gamma family and log link;
bModel was compared to the reduced model (M0) that assumed no intervention effect (random intercept only) by calling ANOVA on the fitted object and performing the LR test on variance components using the Χ2 distribution; σ=standard deviation for random effects on log scale; σs=subject standard deviation; σt:s=effect of difference from pre to post variability across subjects standard deviation; σ=error standard deviation; µ=overall intercept (coefficient for fixed effect for IgG4 peanut in pre period on log scale); ð›¼1=coefficient for fixed effect of time (pre vs. post) on log scale; ∆ represents the multiplicative effect on the original scale determined by exponentiation (e.g. ∆ of 12.769 would indicate expected increase 12.8 times the original value, say from 760 to 9704=(12.769*760 kU/L)).
Figure 3: Describes random intercepts and random slopes in model examining IgG4 peanut (μg/ml) in 51 patients before and after participation in the Tolerance Induction Program (TIP). Delta determined using generalized linear mixed effect model with specification of gamma distribution and log link (note: pre values=0 mcg/ml were coded to 10 (μg/ml) in order to perform glmer analyses).
Discussion
Peanut immunotherapy via TIP provides a promising treatment option for peanut allergic children. Reductions in peanut specific SPT and IgE culminating with peanut desensitization from TIP intervention is evident. After adjusting for variation in baseline levels and TIP effect across subjects, baseline wheal size and peanut specific IgE were reduced to an average 43% (p<0.001) and 44% (p=0.064) of baseline values. Although the reduction in sIgE was only borderline significant in the random intercept and random slope model, the likelihood ratio test indicated improvement over the null model of no treatment effect (p<0.001). Under the assumption of fixed slope (same effect across patients), but random intercepts (differences in baseline values) the intervention effectively reduced peanut specific IgE to 46% of the baseline level (p<0.001). Reflective potentially of the immunological improvements, the adverse event rate during one year post treatment was negligible. Similarly, a high level of reported compliance was noted in this cohort.
In a double blind, randomized control trial examining effect of AR101 in oral immunotherapy (OIT) for peanut allergy in 55 subjects 4-26 years of age, Bird et al. [17] estimated treatment effect on peanut SPT wheal diameter of -7.0 mm (95% CI -9.9, -4.1) [15]. Applying their population average approach, median wheal size in our patients similarly decreased from 14 to 4 mm, p<0.001. We anticipate that accounting for variations in intercepts and slopes in the Bird et al. [17] study would translate to slightly lower effect size, although likely still significant based on our study. In an earlier report, Tang et al. [18] reported outcomes from a randomized trial in 1-10 year olds comparing a combined therapy comprising a probiotic together with peanut OIT (PPOIT) to placebo [16]. They reported on the last day of treatment an average SPT wheal size of 14 mm (SD=5.6) in the placebo group compared to 4.8 (SD=4.0) in the PPOIT group translating to a difference of -9.7 mm (-12.3, -7.11), p<0.001. Again, the net effect was similar to that observed in our cohort. The STOP II randomized controlled crossover trial compared the efficacy of active OIT (protein doses of 2-800 mg/day) with controls in 104 children aged 7-16 year in the UK [17,19]. They reported significant decreases in peanut specific IgE (kU/l), p<0.001, but did not show differentials in peanut SPT wheal diameter between groups (p=0.60) after 6 months of intervention. Historical OIT studies achieve a reduction in peanut specific sIgE and SPT at the cost of daily compliance and elevated frequency of adverse systemic reactions. Contrasting approaches, TIP demonstrates similar or improved reduction in peanut specific allergic markers while maintaining near zero significant adverse events, and the benefit of one week sustained unresponsiveness. TIP compliance over 80% for one year is reflective of the ease of once weekly 30 g protein dose cycles and the complete freedom to eat up to 1 g of peanut protein ad lib.
Our findings should be interpreted with consideration to study limitations. This is a descriptive study that did not include a randomized control group for comparison. A limitation overcome in this study compared to prior reports is the adjustment for random effects. Caregiver goals of peanut allergy therapy for their child were not quantified for evaluation, although most often was similar to reason reported in article by Greenhawt et al. [20] which was for their child to develop a buffer against an unintentional peanut exposure [18]. The sample size did not provide adequate power to examine potential confounding and modifying effects of Ara h components, IgG4 peanut, and associated markers on primary outcomes SPT peanut and sIgE. Additional demographic characteristics of our study population were not abstracted, limiting inference regarding generalizability of our study findings.
Conclusion
The Tolerance Induction Program (TIP) resulted in significant reductions in peanut specific SPT and sIgE in peanut allergic children and improvement in anti-allergy biomarker IgG4. The subject specific approach produced more conservative effect estimates than observed using the population average approach. Modelling the dynamic nature of baseline and response variation across subjects is preferable as aligns with the intent of precision medicine.
REFERENCES
- Bock SA, Munoz-Furlong A, Sampson HA. Further fatalities caused by anaphylactic reactions to food, 2001–2006. J Allergy Clin Immunol. 2007;119(4):1016-1018.
- Francuzik W, Dölle S, Worm M. Risk factors and treatment of refractory anaphylaxis - a review of case reports. Expert Rev Clin Immunol. 2018;14(4):307-314.
- Skolnick HS, Conover-Walker MK, Koerner CB, Sampson HA, Burks AW, Wood RA. The natural history of peanut allergy. J Allergy Clin Immunol. 2011;107(2):367-374.
- Chu DK, Wood RA, French S, Fiocchi A, Jordana M, Waserman S, et al. Oral immunotherapy for peanut allergy (PACE): a systematic review and meta-analysis of efficacy and safety. Lancet. 2019;393(10187):2222-2232.
- National Academies of Sciences, Engineering, and Medicine, Health and Medicine Division, Food and Nutrition Board, et al. In: Oria MP, Stallings VA (eds) Finding a Path to Safety in Food Allergy: Assessment of the Global Burden, Causes, Prevention, Management, and Public Policy. National Academies Press, Washington DC 2016.
- Santos AF, James LK, Bahnson HT, Shamji MH, Couto-Francisco NC, Islam S, et al. IgG4 inhibits peanut-induced basophil and mast cell activation in peanut-tolerant children sensitized to peanut major allergens. J Allergy Clin Immunol. 2015;135(5):1249-1256.
- Sicherer SH, Wood RA. Advances in diagnosing peanut allergy. J Allergy Clin Immunol Pract. 2013;1(1):1-13.
- Deol S, Bird JA. Current opinion and review on peanut oral immunotherapy. Hum Vaccin Immunother. 2014;10(10):3017-3021.
- Yee CSK, Albuhairi S, Noh E, El-Khoury K, Rezaei S, Abdel-Gadir A, et al. Long-term Outcome of Peanut Oral Immunotherapy Facilitated Initially by Omalizumab. J Allergy Clin Immunol Pract. 2019;7(2):451-461.
- Randhawa I, Morphew T, Marsteller NL. Predictive decline in peanut skin test and RAST among peanut-allergic children undergoing high-dose oral immunotherapy. Ann Allergy Asthma Immun. 2018;121(5): S2-S3.
- Diaz FJ. Measuring the individual benefit of a medical or behavioral treatment using generalized linear mixed-effects models. Stat Med. 2016;35(23):4077-4092.
- R Core Team. The R Project for Statistical Computing. 2013.
- Bates D, Machler M, Bolker B, Walker S. Fitting linear mixed-effects models using lme4. J Stat Softw. 2015;67.
- Wasserman RL, Hague AR, Pence DM, Sugerman RW, Silvers SK, Rolen JG, et al. Real-World Experience with Peanut Oral Immunotherapy: Lessons Learned From 270 Patients. J Allergy Clin Immunol Pract. 2019;7(2):418-426.
- Jhamnani RD, Frischmeyer-Guerrerio P. Desensitization for Peanut Allergies in Children. Curr Treat Options Allergy. 2016;3(3):282-291.
- Finn RD, Coggill P, Eberhardt RY, Eddy SR, Mistry J, Mitchell AL, et al. The Pfam protein families database: towards a more sustainable future. Nucleic Acids Res. 2016;44(D1): D279-D285.
- Bird AJ, Spergel JM, Jones SM, Rachid R, Assa'ad AH, Wang J, et al. Efficacy and safety of AR101 in oral immunotherapy for peanut allergy: results of ARC001, a randomized, double-blind, placebo-controlled phase 2 clinical trial. J Allergy Clin Immunol Pract. 2018;6(2):476-485.
- Tang ML, Ponsonby AL, Orsini F, Tey D, Robinson M, Su EL, et al. Administration of a probiotic with peanut oral immunotherapy: a randomized trial. J Allergy Clinc Immunol. 2015;135(3):737-744.
- Anagnostou K, Islam S, King Y, Foley L, Pasea L, Bond S, et al. Assessing the efficacy of oral immunotherapy for the desensitization of peanut allergy in children (STOP II): a phase 2 randomised control trial. Lancet. 2014;383(9925):1297-1304.
- Greenhawt M, Marsh R, Gilbert H, Sicherer S, DunnGalvin A, Matlock D. Understanding caregiver goals, benefits, and acceptable risks of peanut allergy therapies. Ann Allergy Asthma Immunol. 2018;121(5):575-579.
Citation: Randhawa I (2019) Tolerance Induction Program Effect Explains Variation in Wheal Size, sIgE, and IgG4 in Peanut Allergic Children. J Allergy Ther 10:2
Copyright: © 2019 Randhawa I. This is an open-access article distributed under the terms of the Creative Commons Attribution License, which permits unrestricted use, distribution, and reproduction in any medium, provided the original author and source are credited.
