PMC/PubMed Indexed Articles
Indexed In
- Open J Gate
- Genamics JournalSeek
- JournalTOCs
- Ulrich's Periodicals Directory
- RefSeek
- Hamdard University
- EBSCO A-Z
- OCLC- WorldCat
- Publons
- Geneva Foundation for Medical Education and Research
- Euro Pub
- Google Scholar
Useful Links
Share This Page
Journal Flyer
Open Access Journals
- Agri and Aquaculture
- Biochemistry
- Bioinformatics & Systems Biology
- Business & Management
- Chemistry
- Clinical Sciences
- Engineering
- Food & Nutrition
- General Science
- Genetics & Molecular Biology
- Immunology & Microbiology
- Medical Sciences
- Neuroscience & Psychology
- Nursing & Health Care
- Pharmaceutical Sciences
Research Article - (2021) Volume 12, Issue 3
The Role of Side Population Cells and Hypoxia in Resistance to Chemotherapy in Astrocytoma Cell Lines
Jana Balbuena1, Javier S Castresana1,2* and Jordi Petriz3*2Department of Biochemistry and Genetics, University of Navarra School of Sciences, Pamplona, Spain
3Department of Oncology, Joseph Carreras Leukaemia Research Institute, Badalona, Spain
Received: 21-Apr-2021 Published: 11-May-2021, DOI: 10.35248/2157-2518.21.12.361
Abstract
The objective of this work focuses on determining whether there are tumor cells with the Side Population phenotype in cell lines derived from astrocytomas, and if they are sensitive to hypoxia conditions and to the combination of temozolomide with inhibitors of sonic hedgehog pathway (cyclopamine) and of MGMT (O6 -benzylguanine). Cytometry studies were performed to separate the SP cell fraction in all cell lines. The proportion of SP cells was directly proportional to the degree of malignancy of the astrocytoma. The cells showed characteristics of tumor stem cells, such as a greater capacity for self-renewal, and constituted an independent or partially overlapping population with the population of CD133+ cancer stem cells. SP cells were highly resistant to temozolomide, while tumor cells that did not display tumor stem cell properties appeared to be more sensitive. The sonic hedgehog pathway caused resistance to temozolomide, but its inhibition with cyclopamine increased the cytotoxic effects of temozolomide, preferentially in populations not enriched for tumor stem cells of the Side Population. Chemoresistance was often independent of MGMT expression. O6 -benzylguanine was not always capable of increasing the sensitivity to temozolomide in tumor stem cells of the Side Population and in hypoxia. ABCG2 was the transporter predominantly expressed in tumor stem cell populations of the Side Population in high-grade astrocytomas, whereas MDR1 expressed more in non-tumor stem cell populations, and in tumor cells in lower-grade astrocytomas. ABCG2 might be responsible for acquired resistance during treatment with temozolomide.
Keywords
Brain tumors; Glioblastoma; Astrocytoma; Side population; Brain tumor stem cells; Cytometry; Sonic hedgehog; Drug resistance; ABCG2; Hypoxia-inducible factors; Mismatch Repair (MMR)
Introduction
Cancer is a heterogeneous disease, at the cellular and molecular levels. Some of the cells that constitute tumors have stem characteristics (they are then named cancer stem cells –CSC) and are considered to be responsible for the initiation and/or maintenance of the tumor. CSC can divide symmetrically, giving rise to identical cells; and asymmetrically, resulting in differentiated tumor cells. There are currently two methods proposed for the identification and purification of CSC: the first one, through specific surface markers (such as CD133) selectively expressed in CSC, but not in the vast majority of the mass tumor; and the second one, through cell labeling with certain fluorochromes to identify stem cell-like cells, called Side Population cells (SP cells) based on the ability of these cells to extrude the Hoechst 33342 (Ho342) DNA binding fluorochrome from within. SP cells express high levels of members of the ABC (ATP-binding cassette) transporter family such as ABCG2, responsible for extrusion of Ho342 and other drugs and substances being ABCG2 the transporter which predominantly confers the SP phenotype [1,2]. Both types of CSCs show similar characteristics, since SP cells are enriched in CSC, although not all CSC are found in the SP cell fraction. Both cell types have greater capacity than differentiated tumor cells for self- renewal, proliferation, resistance mechanisms to chemotherapy and radiotherapy, evasion of apoptosis and altered signaling pathways.
CSC have been isolated in hematologic malignancies and solid tumors, including brain tumors (they are then called BTSC, or brain tumor stem cells) [3-7]. It has been shown that some brain tumors are derived from the transformation of undifferentiated neural stem cells [8]. BTSC show similar genetic and biological characteristics to neural stem cells. Singh et al., isolated BTSC by cell separation techniques, based on the expression of the cell surface marker CD133 or prominin 1, while Galli et al., identified them by their ability to form neurospheres in vitro [5,3].
BTSC distinguish themselves from the rest of the tumor cells in that they show the properties of neural stem cells, such as the capacity for long-term self-renewal and differentiation to different lineages such as neuronal and astroglial [6,9]. In addition, BTSC have the ability to form brain tumors when injected into immunosuppressed mice, showing a histological and invasive pattern similar to the original tumor [3]. These findings suggest that BTSC are responsible for the high invasion capacity and the resistance to chemo- and radiotherapy that the vast majority of brain tumors present [10,11].
CD133 was initially identified as a marker of normal neuronal precursors and hematopoietic stem cells [12]. CD133+ cells have been isolated in several types of tumors reviewed by Neuzil J. et al., while the CD133 marker is not expressed or slightly expressed in differentiated cells [13,14]. CD133, being a surface antigen, can be modified by various factors, such as cellular stress or hypoxia. Under hypoxic conditions there is an increase in CD133 expression, thus increasing its tumorigenic potential [15-17]. CD133+ cells might behave like BTSC, although this hypothesis has recently been refuted, since it has been shown that even CD133- glioblastoma cells also have stem cell properties and are capable of forming tumors in vivo [18].
SP cells constitute a subpopulation of cells with low fluorescence for Ho342 respect to the total population of tumor cells. The SP population disappears with verapamil, an inhibitor of the activity of the membrane transporters. ABCG2 is the transporter that determines the Side Population.
Since the discovery of SP cells in bone marrow, they have also been detected in other tissues, and in different types of tumors, including tumor cell lines such as leukemia, gliomas, medulloblastoma, hepatocarcinomas, breast, prostate, thyroid, colorectal and ovarian carcinoma, where the SP population would be enriched in stem cells and with greater clonogenic and tumorigenic potential compared to the non-SP fraction [19-36]. Therefore, SP cells may be responsible for more aggressive tumor behavior, and drug resistance. So, this population could be a good therapeutic target. SP cells from glioma cell lines have been detected to be enriched in tumorigenic cells with stem cell properties, while ABCG2+ and ABCG2- cells showed equal tumorigenicity [30].
High-grade astrocytomas (anaplastic astrocytoma and glioblastoma multiforme) are the most malignant primary brain tumors, due to the high resistance to chemotherapy and radiotherapy they offer compared to conventional therapies. Temozolomide is the only chemical agent used against glioblastoma in the clinic. Resistance to temozolomide is a recurrent topic in neuro-oncology. The possible existence of tumor cells with properties of stem cells establish that these cells would be the ones responsible for the initiation, proliferation and maintenance of the tumor, offering the tumor survival advantages over conventional treatments. In addition, tumor hypoxia offers advantages in tumor development and growth, in addition to providing the tumor with resistance to conventional therapies and dedifferentiation capacity of tumor cells [37,38]
The objective of this work focuses on determining whether there are tumor cells with the SP phenotype in cell lines derived from astrocytomas, and if they are sensitive to hypoxia conditions. It is also proposed if SP cells are sensitive to the combination of temozolomide with inhibitors of classical signaling pathways associated to the maintenance of cancer stem cells.
Materials and Methods
Characterization of cell lines
Cell lines: The work was carried out on 10 cell lines derived from astrocytomas of different grade and the NHA (Normal Human Astrocytes) astrocyte line. The NHA line was obtained from Lonza (CC-2565). Lines A172, U87 MG, T98G (derived from grade IV tumors), and MOG-G-CCM (derived from a grade III astrocytoma), were obtained from the European Collection of Cell Cultures. Lines U118, CCF-STTG1 (derived from grade IV tumors), SW-1783 and SW-1088 (derived from a grade III astrocytoma) were requested from the American Type Culture Collection (ATCC). LN-405 and GOS3 cells were obtained from the Leibniz Institut DSMZ Deutsche Sammlung von Mikroorganismen und Zellkulturen GmbH. The MXRA line (KB cell line transfected with the complete cDNA of ABCG2) was used as a positive control for Side Population cell experiments, since they have an induced expression of the ABCG2 transporter.
Growing conditions
Normal culture medium: The NHA line was grown in AGM Bulletkit medium (ABM Astrocyte Basal Medium supplemented with Clonetics AGM Single Quots). The remaining astrocytoma cell lines were cultured in RPMI + L-Glutamax medium supplemented with 10% fetal bovine serum, 1% penicillin/streptomycin and cultured for expansion and analysis in 2 incubators with different conditions; an incubator with an atmosphere of 5% CO2 and 21% O2 (normoxia) and another incubator with 2% O2 (hypoxia). When the cells had a confluence of 80-90%, they were subcultured after obtaining a 0.05% trypsin-EDTA suspension. MXRA cells were cultured in DMEM containing 10% fetal bovine serum and 1% penicillin streptomycin. 2 μl of 800 nm mitoxantrone/12 ml of medium is added to the medium to favor the expression of the ABCG2 transporter.
Neural stem cell selective culture medium: The cells were cultured in a serum-free medium consisting of: DMEM/F12 with glutamine, 2% B27, 20 ng/ml endothelial growth factor (EGF), 20 ng/ml fibroblastic growth factor beta (FGFb) and 1% penicillin/ streptomycin. These cells were also expanded under normoxic and hypoxic conditions.
Gene expression analysis by RT-PCR and RT-qPCR
Reverse transcription polymerase chain reaction (RT-PCR) and reverse transcription real-time polymerase chain reaction (RT- qPCR) analyses were carried out to characterize the expression patterns of genes associated with cellular immaturity, of membrane transporters associated with chemoresistance, of HH signaling pathway regulators and of DNA repair pathways. Primers used for RT-PCR and RT-qPCR are described in Table 1.
| Pathway/process | Name | Forward (5´- 3´) | Reverse (5´-3´) | Ta anneling (°C) |
| SHH | GCCCTCGTAGTGCAGAGACT | AGGCTGATGACTCAGAGGTGT | 60 | |
| PTCH 1 | GGCAGCGGTAGTAGTGGTGTTC | TGTAGCGGGTATTGTCGTGTGTG | 62 | |
| SMO | CAGCTTCCGGGACTATGTGCT | GAAGGCTCGGGCGATTCTTG | 64 | |
| HHIP | ATGGTGGGTTGTGCTTTCC | AGTTGTGTTTGTGCTTTCTGCT | 60 | |
| Sonic hedgehog | SUFU | CCAATCAACCCTCAGCGGCAG | GTAGGTGAGAAAGAGGGTGTC | 60 |
| GLI 1 | TTCCTACCAGAGTCCCAAGT | CCCTATGTGAAGCCCTATTT | 56 | |
| GLI 2 | GCATATGTGTGTGAGCACGA | TCTTGCAGATGTAGGGTTTCTC | 60 | |
| GLI 3 | TTGATCAATGAGGCCCTCTC | CGAACAGATGTGAGCGAGAA | 62 | |
| BMI 1 | ATTGTTCGTTACCTGGAGACC | GGCAGCATCAGCAGAAGG | 60 | |
| MGMT | TGCGCACCGTTTGCGACTTG | TGGGACCTCCACGGCATCAG | 62 | |
| DNA repair | MSH 2 | TTCATGGCTGAAATGTTGGA | ATGCTAACCCAAATCCATCG | 58 |
| MLH 1 | CAGTGGGCCTTGGCACAGCA | GCGGTGCTGGCTCCGATAA | 62 | |
| Hypoxia | HIF-1alfa | AGGAATTGGAACATTATTACAGCAGCC | TCCACTTTCATCCATTGATTGCCC | 62 |
| HIF-2alfa | GTCTCTCCACCCCATGTCTC | GGTTCTTCATCCGTTTCCAC | 62 | |
| Drug resistance | ABCG2 | CGACAGCTTCCAATGACCTGAA | ACCAGGTTTCATGATCCCATTGAT | 64 |
| MDR 1 | TGGAGGAAGACATGACCAGGTAT | TGTATTTGTCTTCCAGCTGCCA | 60 | |
| CD133 | TCCGGGTTTTGGATACACCCTA | CTGCAGGTGAAGAGTGCCGTAA | 64 | |
| HPRT | TGACACTGGCAAAACAATGCA | GGTCCTTTTCACCAGCAAGCT | 60 |
Table 1: Primer sequences of RT-PCR and RT-qPCR.
RNA extraction: RNA of the cell lines was purified using the Illustra RNAspin Mini RNA Isolation Kit (GE Healthcare) kit following the manufacturer's instructions. The purity and quantity of RNA was determined by the Nanodrop system.
Reverse transcription: The RNA (1 μg) was retrotranscribed in a final volume of 20 μl (from the final mixture of the reaction volume). Random primers (250 μg) and dNTPs (0.5 mM each) were added to the RNA and incubated 5 min at 65°C . The enzyme buffers, 5X buffer and DTT (0.01 M) were then added and incubated 2 min at 42°C . Next, 1 U of the enzyme (SuperScriptTM II RNase H Reverse Transcriptase) was added and incubated for 10 min at 25°C , 50 min at 42°C , and 15 min at 70°C . The resulting cDNA was stored at -20°C until use.
Quantification using RT-qPCR: The PCR reactions were carried out in an IQ5 Multicolor Real-Time PCR Detecton System (Bio-Rad). 75 ng cDNA were mixed with 12.5 μl SYBR Green I Master Mix Buffer and 0.5 μl of each primer (0.1 μmol/L) in a final volume of 25 μl. After an initial denaturation step at 94°C for 10 min, the amplification steps consisting of 30-35 cycles were followed, altering the following conditions: 94°C 30 s, specific hybridization temperature (annealing) for each gene 30 s, and 72°C 30 s. After the amplification step, the melting temperature curve was analyzed from 70°C to 90°C 30 s every 0.5°C . The gene transcripts were normalized with the HPRT control gene transcripts in each sample. Quantification of gene expression was performed using the 2 ‑ΔΔCq method [39].
RT-PCR conditions: The RT-PCR analysis was carried out with 75 ng of cDNA in a final volume of 25 μl, containing 2.5 μl of 10x reaction buffer, 1.5-2 mM MgCl2, 0.2 mM of each dNTP, 5-10 pmol of the sense and antisense primers, 5-10% DMSO and 1 unit AmpliTaq GoldTMpolymerase enzyme. The reactions were performed in a T3 thermal cycler from Biometra. After an initial denaturation step at 94°C for 10 min, the amplification steps, consisting of 30-35 cycles, were followed, alternating the following conditions: 1 min at 94 °C , 1 min at the specific hybridization temperature for each pair of primers, and 45 s to 2 min at 72 °C depending on the gene studied. The reaction ends with a final extension step at 72°C 10 min. The PCR products were visualized on a 2% agarose gel with ethidium bromide at a final concentration of 0.1 μg/ml. The HPRT gene was used as a control.
Identification and characterization of cells of the side population
Identification of the side population: For the identification of cells of the Side Population (SP cells) (Figure 1) the cell lines were expanded in 2 incubators with different atmospheres, one with 5% CO2 and 21% O2 (normoxia) and another with 5% CO2 and 2% of O2 (hypoxia) since hypoxia favors the expression of the ABCG2 transporter, which confers the SP phenotype. For the proper and representative SP cell labeling of the SP population, a minimum of 10-20 million cells were needed for analysis and subsequent cell separation. For labeling, the cell suspension was left in DMEM medium containing 2% FCS and 10 mM HEPES preheated to 37°C and Hoechst 33342 (Ho342) to a final concentration of 5 μg/ml. The cells were incubated in a bath at exactly 37°C for 2 h, mixing the contents of the tube every 15 min. After incubation, the tubes were centrifuged for 6 min at 1500 rpm at 4°C to stop the activity of the transporter, and kept at 4°C in darkness until using them in the cytometer. After centrifugation, the supernatant is decanted and 1 ml of HBSS with 2% FCS and 10 mM HEPES is added. Possible cell aggregates that may have formed are removed by nytal mesh filtration (Sefar Maissa S.A., Barcelona). Finally, propidium iodide is added to a final concentration of 1 μg/ ml to discriminate dead cells from the analysis. Hoechst 33342 was aliquoted to a concentration of 1 mg/ml and stored at -20°C and the aliquot was replaced every 1-2 days.
The data was analyzed using FlowJo Software (Tree Star Inc.) and was acquired in a MoFlo® (Beckman-Coulter) equipped with three lasers operating at 351, 488 and 633 nm. The combination of filters for the analysis of Ho342 was as follows: 440DLP, BP405/30 (Ho342 blue) and BP670/40 (Ho342 red). The Ho342 signal was measured by linear scale at 30 mW of ultraviolet laser power. The acquisition of the data was stopped by acquiring 100,000 events within the life-gate. The propidium iodide signal was acquired through a 630/30 bandpass filter.
Separation of the side population: After identification of SP cells, we proceeded to expand and perform cell separations until obtaining a highly purified population of SP cells relative to the parental line, using cell sorting. It was not possible to isolate the SP cells from all cell lines in the 2 conditions (normoxia and hypoxia).
Gene expression analysis by RT-qPCR: The products of the genes associated with stem cells, some genes of the HH pathway and some other genes related to the DNA repair pathways were analyzed by RT- qPCR to determine, e.g., if the purified SP cells presented a higher HH activation level and a higher level of cell undifferentiation relative to the parental cell lines. On the other hand, we also tried to reach the same conclusion regarding SP and parental cells grown under hypoxia conditions, under which they could have a higher level of undifferentiation.
CD133 protein labeling: A pellet of one million cells from the different cell lines was collected and washed twice in 1 ml of PBA buffer containing PBS, 1% albumin and 0.1% sodium azide, and centrifuged for 10 s at 4°C at 13200 rpm. After decantation of the supernatant, we added 10 μl of the primary antibody CD133/1-P3 (Miltenyi Biotec 1:10) and incubated it for 30 min at 4°C in darkness. After incubation, 500 μl of the PBA buffer was added directly and analyzed by the cytometer.
Cellular and genetic characterization with cyclopamine and temozolomide: We decided to study how temozolomide affects glioma cell lines at different levels (cell proliferation, cell cycle and gene expression). Cells were grown in normoxia and hypoxia and in their respective purified SP populations.
Analysis of cell proliferation by MTT: Cell proliferation was measured using the MTT (3- (4,5-dimethyl-2-thiazolyl) -2,5-diphenyl- 2H-tetrazolium bromide) colorimetric assay by Sigma Aldrich.
Cells were seeded in 96-well plates at a density of 10,000 cells/well and 6 replicas were made for each control and treatment. The analyses for both cyclopamine and temozolomide were done at different times (0, 24, 48 and 72 h) and at different concentrations of temozolomide (100, 200 and 300 μM) and of cyclopamine (3, 6 and 12 μM) and cells were incubated at 37°C. MTT at a concentration of 0.5 mg/ml was added to the plates and incubated for 3 h. After incubation, the medium was discarded and DMSO was added to the plates to dissolve the formazan precipitates. Absorbance was measured at 550 nm. No significant effect was observed in the proliferative decrease in the vast majority of cell lines at these concentrations. Therefore, we decided to use temozolomide at 400 and 500 μM in further studies.
Temozolomide treatment: The parental cell lines and their respective SP cells were cultured under conditions of normoxia and hypoxia and in the presence of temozolomide to obtain cell pellets and to do subsequent analyses at the level of the cell cycle, cell proliferation and gene expression.
Cells were seeded at a density of 100,000-200,000 cells per well in 6-well plates. Culture medium was replaced the next day by fresh medium that incorporated temozolomide at 2 different concentrations for cell cycle analysis (400 and 500 μM 72 h): at 500 μM 72 h to obtain cell pellets, and at 500 μM 24 h to study the effect of temozolomide on cell proliferation.
Cyclopamine treatment: Previously, a proliferation study was carried out at different concentrations of cyclopamine and the cell cycle was analyzed. Since no effect was observed at these concentrations, it was decided to increase the concentration of cyclopamine (10, 20 and 30 μM for 24 h).
O6 -benzylguanine treatment: Cells were seeded at a density of 100,000-200,000 cells per well in 6-well plates and the next day O6- benzylguanine was added at a concentration of 20 μM during two different incubation times: 6 and 18 h. After incubation, 500 μM of temozolomide was added directly to the medium for 72 h. After treatment, cells were trypsinized and fixed in 70% ethanol and stored at -20°C until cell cycle labeling.
Cell cycle analysis: To determine how temozolomide, cyclopamine and the combined treatment affect the cell cycle in the parental cell lines and in their SP cells cultured in normoxia and hypoxia, a cell cycle assay was performed. As a control, cells were grown in culture medium supplemented with DMSO.
After treatment with the drugs, the supernatant was collected to check if apoptosis was occurring, and cells were trypsinized. For the labeling, one million cells were split and after centrifugation the pellet was fixed with 1 ml of 70% ethanol stored at -20°C , and after pellet resuspending, samples were stored at -20°C until cell cycle labeling. For labeling, samples were first centrifuged twice with inverted tube positions for proper pellet formation. It was subsequently washed twice with PBS and the pellet was resuspended in 1 ml of a mixture consisting of PBS, 20 μg/ml of propidium iodide and 0.1 mg/ml of RNAse A (ribonuclease A). The analysis was performed by flow cytometry in a FACScalibur cytometer.
Results
Identification and enrichment of cells of the side population
Tests were carried out in 10 astrocytoma cell lines of different malignancy grades and in a human normal astrocyte (NHA) cell line, to determine the possible presence of side population cells (SP cells). Cell lines were grown in normoxia with 21% oxygen and in hypoxia with 2% oxygen (the latter condition favors the expression of the ABCG2 transporter, and therefore the SP phenotype).
The presence of SP cells was detected in all cell lines in different proportions, being in smaller quantity in GOS3 cells and in NHA cells. A higher proportion of SP cells was detected in grade IV astrocytomas compared to grade III astrocytoma cell lines.
Hypoxia favored the increase of the SP fraction in some cell lines, while in the vast majority of them, no increase of the SP fraction was observed in hypoxia with respect to the same cell line grown in normoxia. After the identification of the SP population, it was subsequently separated, after cultivation for a period of 2-3 weeks. Again the labeling and separation was carried out until a very rich population was obtained in SP cells with respect to the parental line. In this way, two or three sorting procedures were necessary depending on the cell line. In some cases, as in the MOG cell line, the enrichment was 90%. Figure 1 shows the analysis and enrichment in SP cells for the SW1783 line grown in both normoxia and hypoxia, and the enrichment of NHA in normoxia, where the population of SP cells was very small.
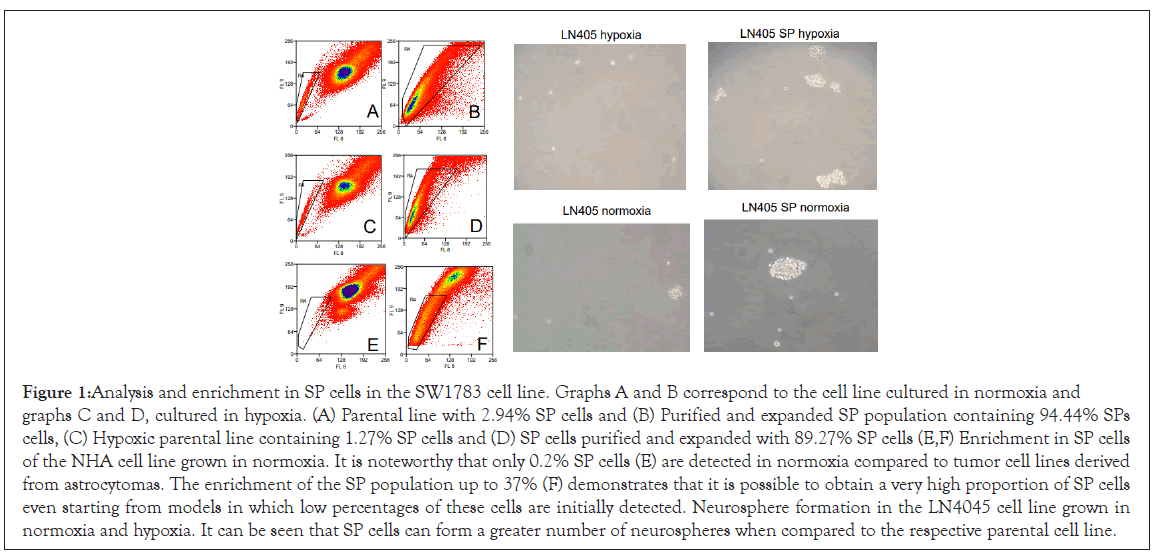
Figure 1: Analysis and enrichment in SP cells in the SW1783 cell line. Graphs A and B correspond to the cell line cultured in normoxia and graphs C and D, cultured in hypoxia. (A) Parental line with 2.94% SP cells and (B) Purified and expanded SP population containing 94.44% SPs cells, (C) Hypoxic parental line containing 1.27% SP cells and (D) SP cells purified and expanded with 89.27% SP cells (E,F) Enrichment in SP cells of the NHA cell line grown in normoxia. It is noteworthy that only 0.2% SP cells (E) are detected in normoxia compared to tumor cell lines derived from astrocytomas. The enrichment of the SP population up to 37% (F) demonstrates that it is possible to obtain a very high proportion of SP cells even starting from models in which low percentages of these cells are initially detected. Neurosphere formation in the LN4045 cell line grown in normoxia and hypoxia. It can be seen that SP cells can form a greater number of neurospheres when compared to the respective parental cell line.
Neurosphere formation
Normal stem cells and CSC have a capacity for self-renewal that can be determined in vitro by the ability to form neurospheres when grown in selective medium together with EGF (epidermal growth factor) and FGF-2 (fibroblast growth factor).
It was observed that SP cells were able to form more neurospheres than the parental lines grown in both normoxia and hypoxia (Figure 1); and in less than 24 h, while the parental line required days to form a lesser number of neurospheres. It might be related to the SP tumor cells having a greater clonogenic potential compared to non-SP tumor cells.
Gene expression of the sonic hedgehog pathway
The expression of the genes associated with the HH pathway (Sonic, HHIP and SUFU) was studied by RT-PCR and subsequently analyzed on 2% agarose gels (Supplementary Figure 1). Other genes (PTCH1, SMO, GLI1, GLI2 and GLI3) were quantified by RT-qPCR (Figure 2). Gene expression levels were analyzed in seven cell lines derived from astrocytomas and in NHA in four different experimental conditions: grown in normoxia and hypoxia, and in their enriched SP populations.
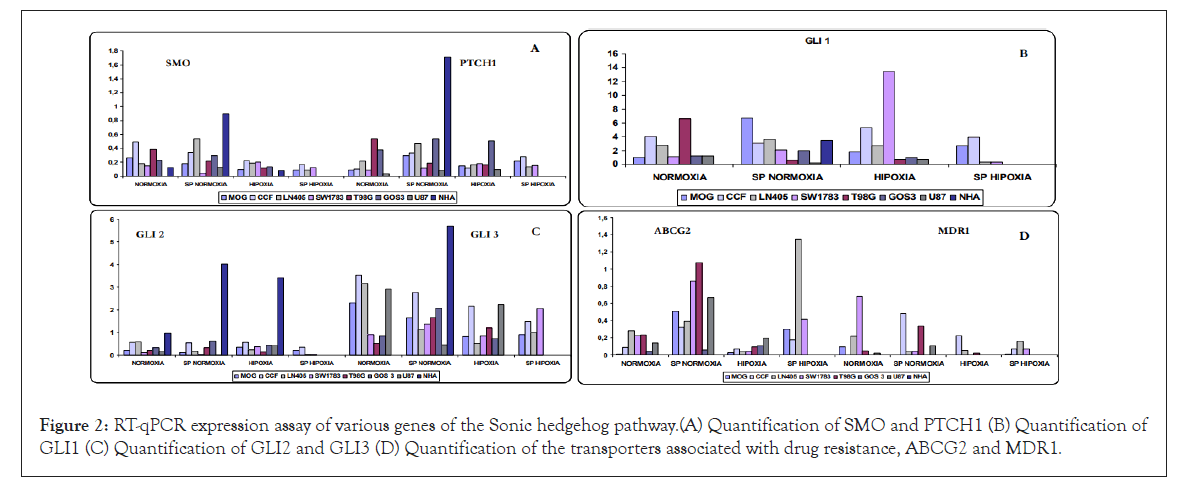
Figure 2: RT-qPCR expression assay of various genes of the Sonic hedgehog pathway.(A) Quantification of SMO and PTCH1 (B) Quantification of GLI1 (C) Quantification of GLI2 and GLI3 (D) Quantification of the transporters associated with drug resistance, ABCG2 and MDR1.
Not all cell lines showed SHH expression in normoxia; and levels were always low, showing that the activation of the pathway is not only ligand dependent. In some cell lines, SHH was expressed in all conditions, while in others the expression was lost under certain conditions.
HHIP expression preferentially appeared in the cell lines grown in normoxia and disappeared in the SP cells, with the exception of the GOS3 line, in which HHIP was expressed in all conditions.
Some cells expressed SUFU in all conditions (MOG, CCF and LN405), while in other cells SUFU expression was considered undetectable (T98G, GOS3 and U87), and in the SW1783 cell line, no expression was detected in some of the conditions tested.
The upstream genes of the pathway, PTCH1 and SMO, were expressed in all lines and conditions, with some exceptions. SMO was usually less expressed in hypoxia compared to the normoxia condition. In the cell lines in which the four conditions were available, the lowest level of expression corresponded to SP cells grown in hypoxia. In general, SMO was not overexpressed (Figure 2). PTCH1 had higher levels of expression in SP cells grown in normoxia compared to parental normoxia, while no significant differences were observed between normoxia and hypoxia. In general, PTCH1 overexpression was not detected (Figure 2).
The main effectors of the GLI1 and GLI2 pathways showed expression in all cell lines and conditions, with some exceptions. GLI1 expression was very high in all conditions, except for some cell lines under certain conditions where low levels were detected and no significant differences were seen between normoxia and hypoxia, with some exceptions (Figure 2). GLI2 was one of the only genes of the HH pathway with high expression in NHA cells, both grown in normoxia and hypoxia, and presented overexpression when compared with cell lines derived from astrocytomas, so it might behave as a possible pathway suppressor gene, especially in normal astrocytes (Figure 2).
For another negative regulatory gene of the pathway, GLI3, we could observe that it was expressed in all cell lines and conditions but with differences in the level of expression, except for NHA cells in normoxia and hypoxia. In many cases, it was less expressed in hypoxia compared to normoxia; and in a large number of cases there was also less expression in the SP population grown in normoxia (Figure 2).
The NHA astrocyte line showed no expression of virtually any pathway gene. However, its SP cells had high expression of all components of the pathway, even though it was considered a non- tumorigenic line.
Expression of genes associated with drug resistance, stem cells and apoptosis
The expression of genes related to stem cells was studied, such as CD133, a useful marker to isolate and purify a subpopulation of tumor stem cells. Bmi-1, a gene related to the sonic pathway, was also studied. Other genes analyzed were those coding for two membrane transporters belonging to the ABC family, involved in drug resistance and expressed in normal and tumor stem cells such as ABCB1 and ABCG2, the latter conferring the SP phenotype. And finally Bcl-2, an anti-apoptotic gene, was also analyzed.
Expression of ABC transporters: ABCG2, the specific transporter of SP cells, showed higher expression levels in the SP populations maintained in normoxia relative to their parental lines, except in the NHA cell line that showed no increase in expression, unlike MDR1 (ABCB1) that showed high overexpression. Lines LN405 and GOS3 only showed a slight increase in their expression. In the cell lines in which the SP population could be isolated in hypoxic condition, ABCG2 was increased when compared to cells grown in hypoxia conditions (Figure 2).
For MDR1b, another transporter associated with resistance to antitumor agents, expression in MOG cells was only found in the normoxia condition, while in the other conditions it was not detectable. For the CCF cell line, occurred just the opposite, since its expression was not detected in normoxia and the highest levels were found in the SP population, and also in hypoxia. For LN405 cells, the highest levels of expression occurred in normoxia, followed by hypoxia SP and with a lower expression in the SP population and in the hypoxia conditions. Also for the SW1783 cells there was a high expression in normoxia, to disappear in hypoxia and had very low levels in both SP populations, grown in normoxia and hypoxia. For the T98G and U87 cell lines the lowest expression was produced, being practically undetectable in hypoxia. In normoxia, it was weakly expressed and greater expression was found in SP cells. No expression of MDR1 was detected in the NHA cell line either in normoxia or in hypoxia, while in its SP population, its levels were overexpressed. In the case of the GOS3 cell line, the levels were overexpressed in all three conditions, with greater expression in the SP cells, followed by hypoxia and normoxia conditions. Due to their high levels of expression, the results obtained in the GOS3 lines in their three conditions and NHA SP are not represented in the graph (there was no expression in NHA normoxia and hypoxia) (Figure 2).
Expression of genes associated with stem cells: Expression levels of the CD133 and Bmi-1 genes were studied. CD133 showed greater expression in hypoxia condition. In SP cells there was no increase with respect to the parental population in normoxia, maintaining the levels or with a certain tendency to decrease. For the MOG and CCF cell lines, no differences were found between hypoxia and SP cells in hypoxia, maintaining the same levels, contrary to what happens in the LN405 and SW1783 cell lines, where hypoxia expression levels increased, to disappear in hypoxia SP cells (Figure 3). In general, the expression of the CD133 gene was very weak.
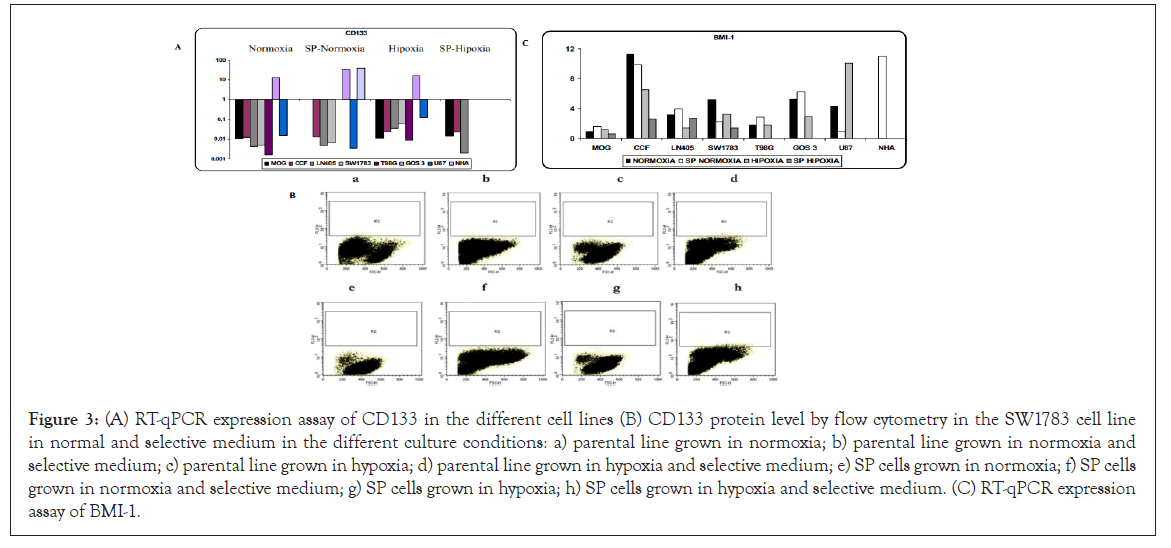
Figure 3: (A) RT-qPCR expression assay of CD133 in the different cell lines (B) CD133 protein level by flow cytometry in the SW1783 cell line in normal and selective medium in the different culture conditions: a) parental line grown in normoxia; b) parental line grown in normoxia and selective medium; c) parental line grown in hypoxia; d) parental line grown in hypoxia and selective medium; e) SP cells grown in normoxia; f) SP cells grown in normoxia and selective medium; g) SP cells grown in hypoxia; h) SP cells grown in hypoxia and selective medium. (C) RT-qPCR expression assay of BMI-1.
This gene was also analyzed at the protein level by flow cytometry in all available conditions and in normal and selective medium (it favors its expression). An increase in protein levels of CD133 was not detected (Figure 3).
For BMI-1, there was overexpression of the gene in all cell lines and in all conditions, except in the NHA line in normoxia and hypoxia. The MOG line was the one with the least levels of expression. Except for the U87 cell line in which gene expression was higher in hypoxia, a greater expression in normoxia was observed in the rest of the cell lines. In SP cells there were differences according to the cell line, increasing or decreasing with respect to the parental line in normoxia (Figure 3).
Bcl-2 anti-apoptotic gene expression: The anti-apoptotic gene Bcl-2 was studied, as it is overexpressed in populations of tumor stem cells as a mechanism to avoid apoptosis. Higher levels were observed in SP cells compared to the parental line grown in normoxia, except in SW1783 cells where their expression decreased slightly, and in T98G. In NHA cells cultured in normoxia and hypoxia, differences were hardly seen with respect to their SP population. In the NHA line in its three conditions, the highest levels of expression of this gene were found. If we compare normoxia with hypoxia, in general Bcl-2 was expressed somewhat less in the hypoxic condition (Figure 4).
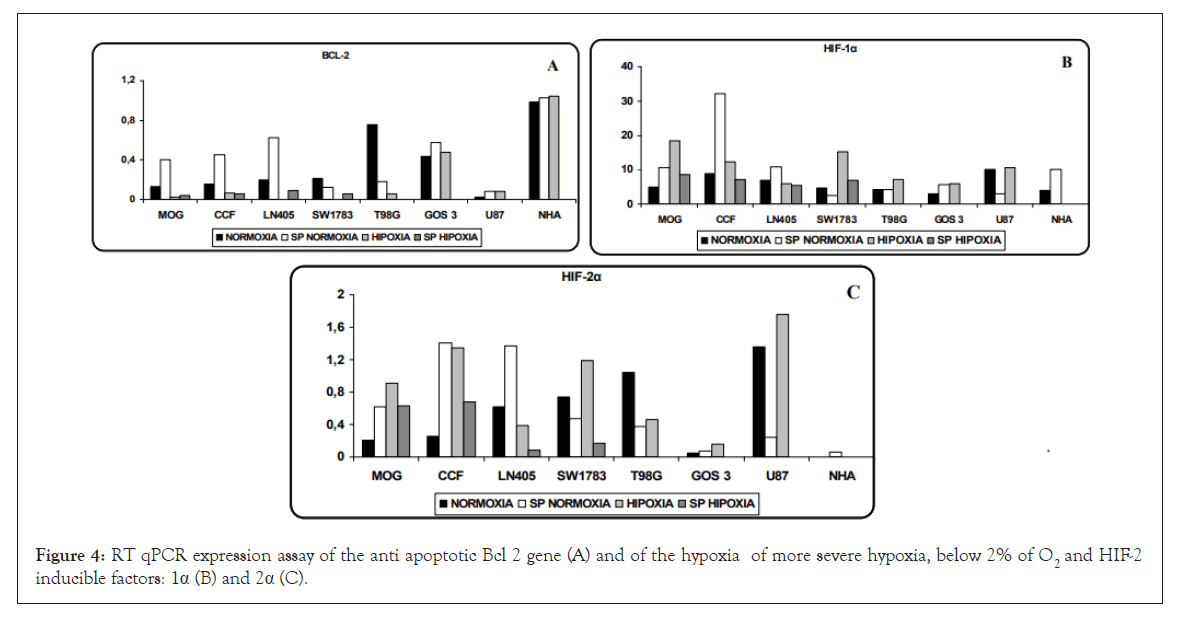
Figure 4: RT qPCR expression assay of the anti apoptotic Bcl 2 gene (A) and of the hypoxia of more severe hypoxia, below 2% of O2 and HIF-2 inducible factors: 1α (B) and 2α (C).
Expression of hypoxia-inducible factors
HIF-1α and HIF-2α, two of the hypoxia-inducible factors most studied, are elevated in hypoxia conditions causing the activation of various genes and pathways. HIF-1α seems to act in conditions of more severe hypoxia, below 2% of O2 and HIF-2α acts at higher levels, and can even be activated in normoxic physiological conditions and without hypoxia.
In our cells, both factors were expressed in normoxia and hypoxia, although with much lower values of HIF-2α with respect to HIF- 1α. For HIF-1α, except in SW1783, U87 and T98G cells, the SP population showed higher levels than their parental line. The NHA cell line showed overexpression in normoxia but surprisingly it was not expressed in hypoxia (the same is true for HIF-2α) (Figure 4).
Regarding HIF-2α, there was a greater difference between normoxia and hypoxia except in LN405 and T98G cells. Except for the SW1783 and U87 cells where the SP population showed a lower level of expression, the SP cells expressed much more with respect to the parental line grown in normoxia. In the LN405 and SW1783 cell lines, HIF-2α was expressed to a lesser extent in SP cells cultured in hypoxia, as was the case with CD133. NHA SP did not see its increased expression levels, contrary to what happens with other genes analyzed (Figure 4).
Cell cycle
The effects of cyclopamine (10 and 30 μM 24 h), temozolomide (400 and 500 μM 72 h) and both together (10 or 30 μM cyclopamine 24 h and 500 μM temozolomide 72 h) on the cell cycle were analyzed in the cell lines cultured in normoxia and hypoxia and in their purified SP cells.
Cyclopamine
Effect of cyclopamine on cell proliferation (MTT assay): Prior to the cell cycle analysis, a cell proliferation test was performed using MTT at 3 different concentrations of cyclopamine (3, 6 and 12 μM) and at different times (0, 24, 48 and 72 h). At 6 and 12 μM a great decrease in cell proliferation was seen (Supplementary Figure 2), but when the cell cycle was analyzed in the presence of 10 μM cyclopamine, no significant changes were observed. So, it was decided to study the effect of cyclopamine on the cell cycle at 10 and 30 μM. Cyclopamine was also tested at 20 μM doses in some cell lines and under different conditions, but the use of this concentration was finally discontinued.
Effect of cyclopamine on cell cycle: Under the conditions tested, cyclopamine did not show to have important effects on the cell cycle phases. There was no stop in phase S or G2/M nor a decrease in phase G0/G1. In general, all cell lines, in the different conditions showed resistance to cyclopamine. Figures 5 and 6 show the resulting graphs representative of the effect of cyclopamine on the cell cycle in the LN405 and CCF cell line respectively, showing some sensitivity to cyclopamine in the normoxia parental line and greater resistance in the other conditions.
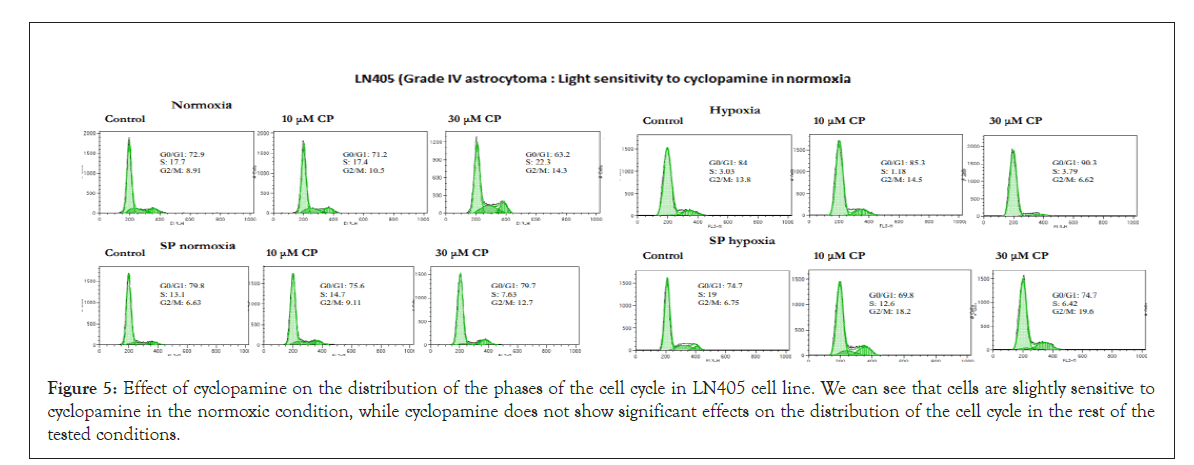
Figure 5: Effect of cyclopamine on the distribution of the phases of the cell cycle in LN405 cell line. We can see that cells are slightly sensitive to cyclopamine in the normoxic condition, while cyclopamine does not show significant effects on the distribution of the cell cycle in the rest of the tested conditions.
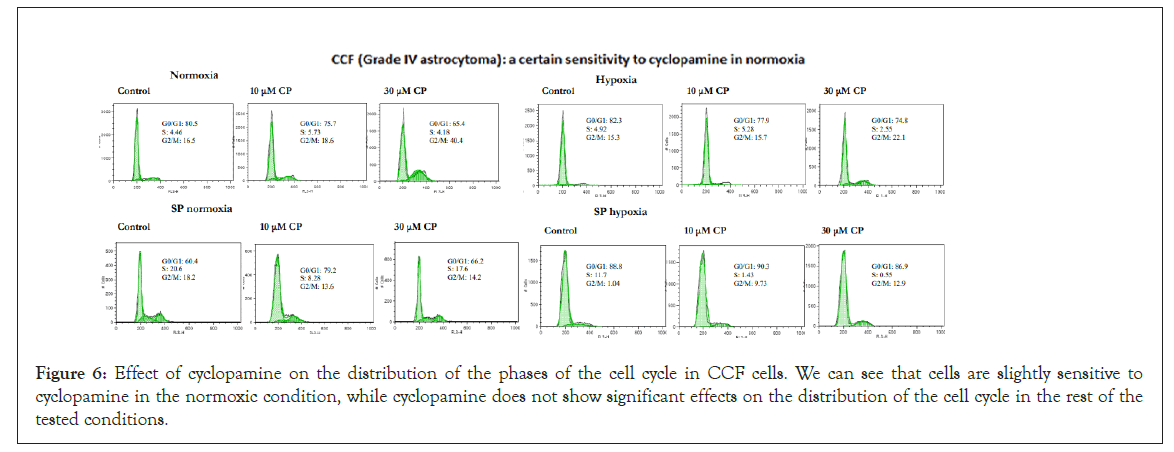
Figure 6: Effect of cyclopamine on the distribution of the phases of the cell cycle in CCF cells. We can see that cells are slightly sensitive to cyclopamine in the normoxic condition, while cyclopamine does not show significant effects on the distribution of the cell cycle in the rest of the tested conditions.
Temozolomide
Effect of temozolomide on cell proliferation (MTT assay): Prior to cell cycle analysis, cell proliferation was analyzed by MTT assay, in the presence of temozolomide (100, 200 and 300 μM) at different times (0, 24, 48 and 72 h). In the great majority of the lines analyzed, there was no decrease in cell proliferation (Supplementary Figure 3), so it was decided to study the effect of temozolomide at concentrations of 400 and 500 μM for 72 h.
Effect of temozolomide on cell cycle: The described effect of temozolomide is related to a stop in the G2/M phase. In combination with other drugs such as O6 -benzylguanine, its toxicity on cells is enhanced. Administered with cyclopamine, its effect is also enhanced, resulting in increased inhibition of proliferation and an increase in apoptosis.
Many of the cell lines analyzed and cultured in normoxia, showed a relative resistance to temozolomide, due to slight increases in the S and/or G2/M phase and to a slight decrease in the G0/G1 phase. In this group of temozolomide resistance, NHA (astrocytes), GOS 3 (grade I astrocytoma), T98G (grade IV astrocytoma) and LN405 (grade IV astrocytoma) cell lines could be found. All these lines, in turn, showed resistance to temozolomide in the rest of the conditions tested (SP cells cultured in normoxia, hypoxia, and SP cells cultured in hypoxia), except in the GOS3 and LN405 lines where the SP cells showed a greater, but slight sensitivity to the drug.
The U87 cell line (grade IV astrocytoma) and especially CCF (grade IV astrocytoma) and SW1783 (grade III astrocytoma) were the most sensitive cell lines to treatment with temozolomide in their parental condition grown in normoxia, a factor that confirms the heterogeneity that exists between astrocytoma cell lines, regardless of whether we work with enriched SP cells or in hypoxic conditions. However, in all three lines, their SP cells proved to be very resistant to temozolomide, as were those grown in hypoxic conditions (except for the U87 line, which in this condition seems to be more sensitive). Figures 7-9 illustrate cases of resistance to temozolomide in all its test conditions (MOG cell line), sensitivity to temozolomide in normoxia and resistance in the rest of the conditions tested (CCF line) and high sensitivity to temozolomide in normoxia and resistance in the rest of the conditions tested (SW1783 line).
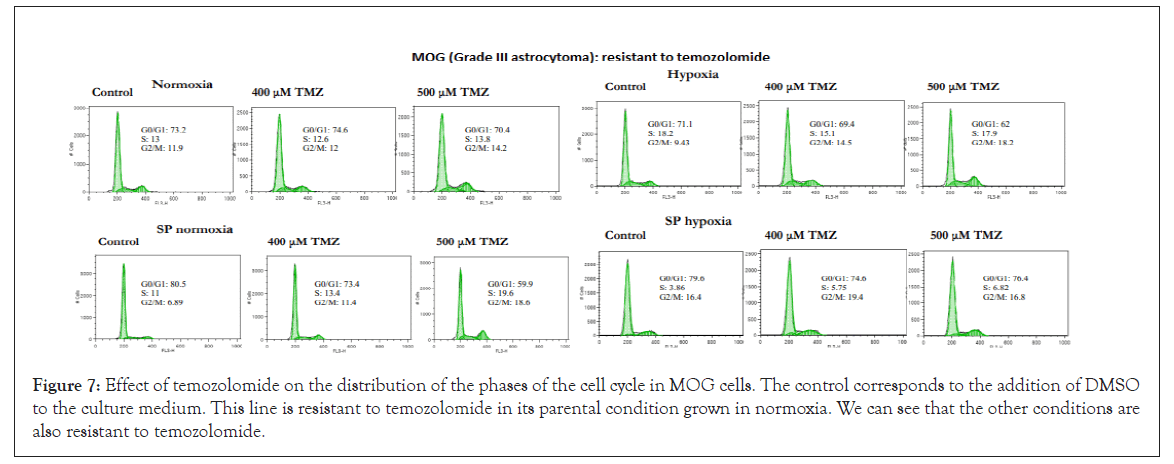
Figure 7: Effect of temozolomide on the distribution of the phases of the cell cycle in MOG cells. The control corresponds to the addition of DMSO to the culture medium. This line is resistant to temozolomide in its parental condition grown in normoxia. We can see that the other conditions are also resistant to temozolomide.
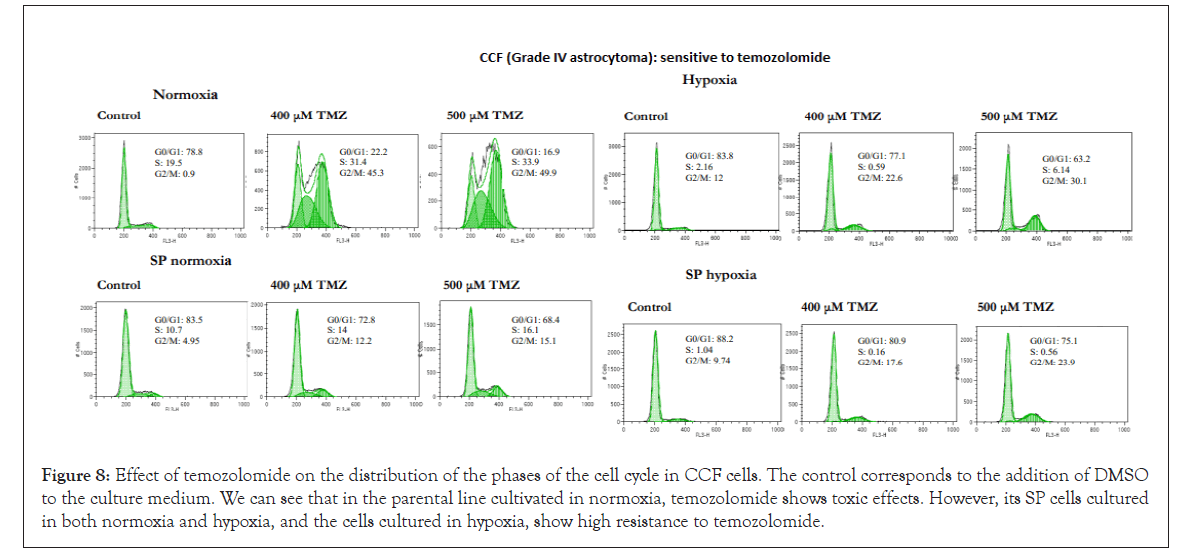
Figure 8: Effect of temozolomide on the distribution of the phases of the cell cycle in CCF cells. The control corresponds to the addition of DMSO to the culture medium. We can see that in the parental line cultivated in normoxia, temozolomide shows toxic effects. However, its SP cells cultured in both normoxia and hypoxia, and the cells cultured in hypoxia, show high resistance to temozolomide.
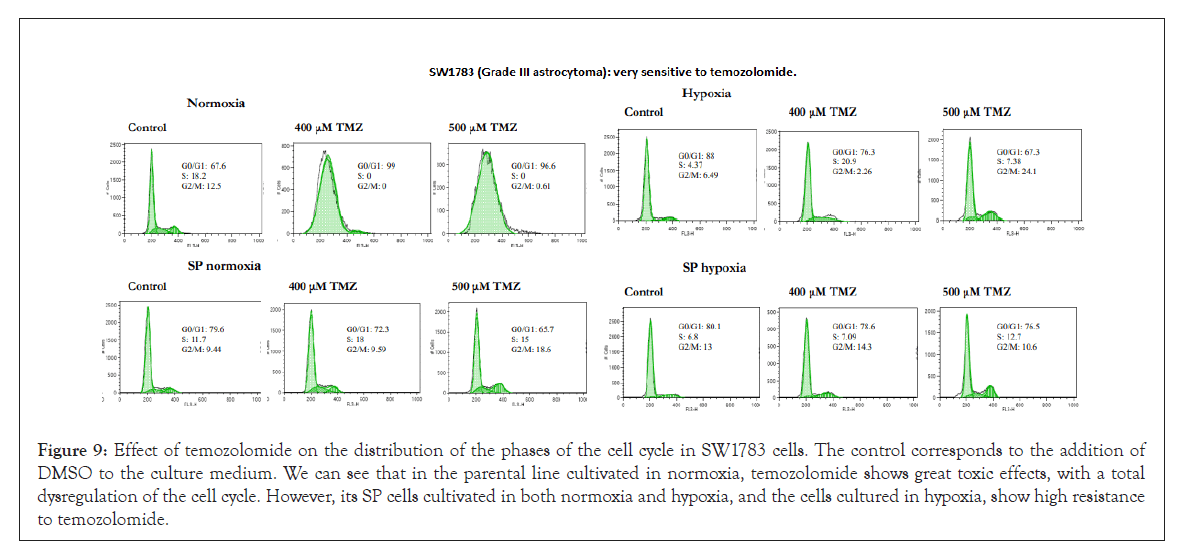
Figure 9: Effect of temozolomide on the distribution of the phases of the cell cycle in SW1783 cells. The control corresponds to the addition of DMSO to the culture medium. We can see that in the parental line cultivated in normoxia, temozolomide shows great toxic effects, with a total dysregulation of the cell cycle. However, its SP cells cultivated in both normoxia and hypoxia, and the cells cultured in hypoxia, show high resistance to temozolomide.
Combined treatment of cyclopamine and temozolomide: The effect of the cyclopamine and temozolomide combined treatment on the cell cycle was analyzed. First, cyclopamine was added to inhibit the HH pathway and subsequently temozolomide was used, to verify the existence of a possible synergistic effect between both drugs, especially in those cell lines that showed greater resistance to temozolomide.
In many cases, the joint treatment increased the S and/or G2/M phase and decreased the G0/G1 phase in a greater proportion than with temozolomide alone. There were also cell lines in which this cumulative effect in the cell cycle did not occur, exhibiting resistance.
In some cases, the increase in the phases of the cycle was not dependent on normoxia; other cases showed resistance in normoxia and greater sensitivity in hypoxia, as well as SP cells were more resistant than parental cells in the normoxia condition. The LN405 lines (Figure 10), T98G, U87 and GOS3, in their parental condition in normoxia, showed a greater cytotoxic effect of temozolomide when it was combined with cyclopamine. Of these lines, U87 and GOS3 showed some previous sensitivity with only temozolomide. However, their SP cells grown in normoxia were resistant to the combined treatment, without appreciable changes in the cell cycle phases. Also in these hypoxic cultured lines, the cytotoxic effect of temozolomide increased when it was previously cultured with cyclopamine. In this hypoxic condition, the T98G and U87 lines previously showed some sensitivity to temozolomide alone. For the condition of SP cells cultured in hypoxia in the LN405 cell line, the combined treatment also increased the effect of temozolomide.
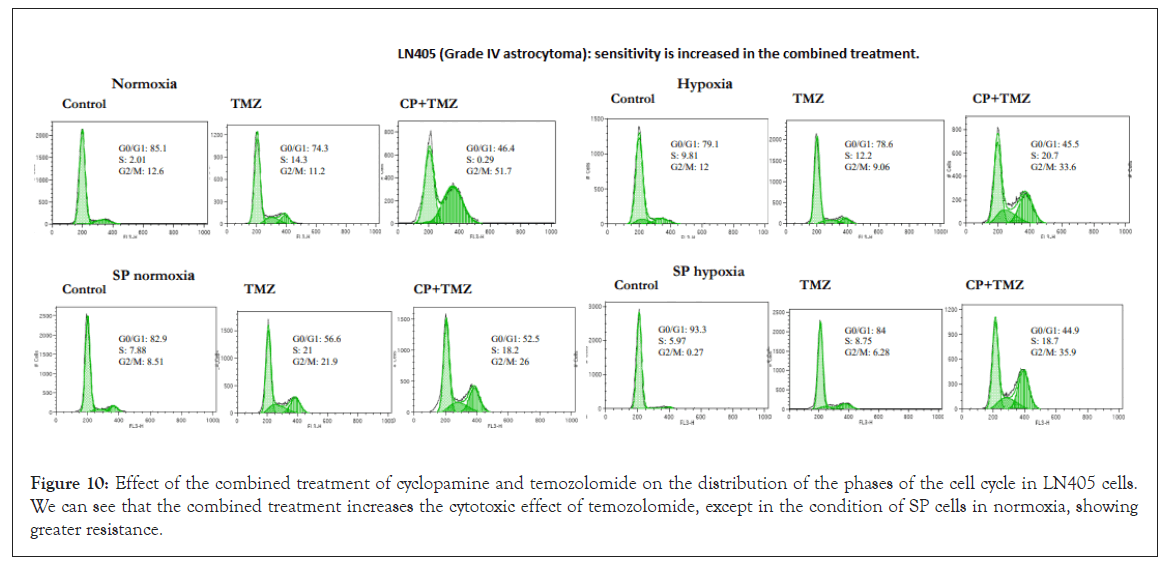
Figure 10: Effect of the combined treatment of cyclopamine and temozolomide on the distribution of the phases of the cell cycle in LN405 cells. We can see that the combined treatment increases the cytotoxic effect of temozolomide, except in the condition of SP cells in normoxia, showing greater resistance.
On the other hand, the NHA (normal astrocytes) and MOG (Grade III astrocytoma) cell lines, the combined treatment did not produce synergistic effects between both drugs in the parental condition cultured in normoxia, and both lines were shown to be resistant to treatment with only temozolomide. The SP cells grown in normoxia, showed some resistance to the combined treatment. On the contrary, in the culture in hypoxia in the MOG line, both in the parental line and in the SP cells, the temozolomide effect was increased.
On the other hand, we have the SW1783 (grade III astrocytoma) (Figure 11) and CCF (grade IV astrocytoma) cell lines, where the combined treatment did not produce synergistic effects in their parental condition in normoxia, because these lines showed to be very sensitive to treatment with temozolomide. In their SP cells grown in normoxia, only the CCF line had a synergistic effect for the combined treatment, while SW1783 cells were resistant. The same effect was visualized in the culture in hypoxia: sensitivity increased in CCF cells, while it only increased slightly in SW1783 cells.
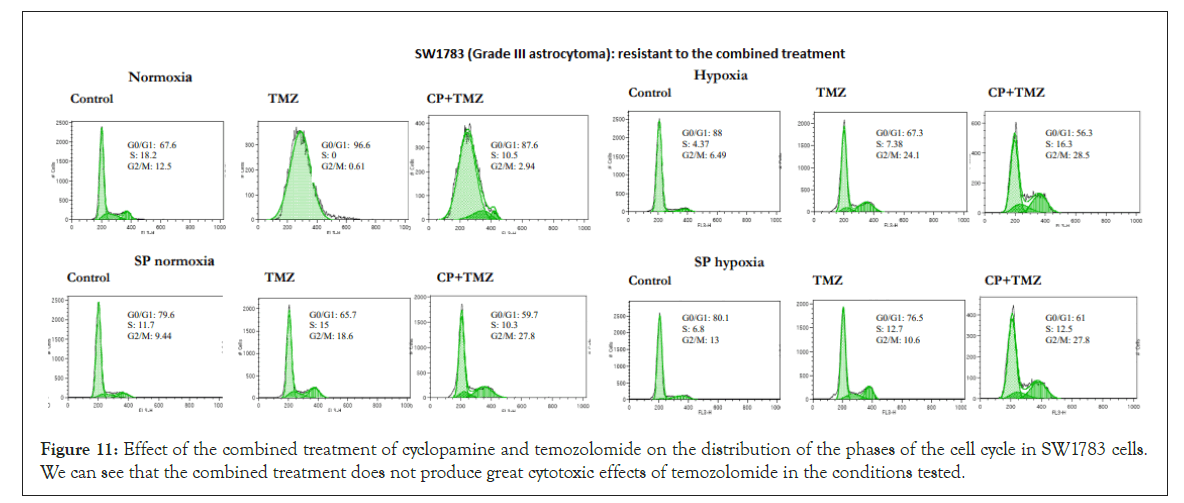
Figure 11: Effect of the combined treatment of cyclopamine and temozolomide on the distribution of the phases of the cell cycle in SW1783 cells. We can see that the combined treatment does not produce great cytotoxic effects of temozolomide in the conditions tested.
O6 -benzylguanine: O6 -benzylguanine (O6 -BG) is a drug used to inhibit MGMT levels, making cells more sensitive to alkylating agents such as temozolomide. MGMT repairs the O6-methylguanine adducts formed in the DNA after treatment with temozolomide making cells resistant to it. Without MGMT, that damage is not repaired and the cell would be more sensitive to temozolomide. The effect of simultaneous treatment between O6-BG (20 μM at two different times, 6 and 18 h) and temozolomide on the cell cycle has been tested in some cell lines and under different culture conditions, to check if MGMT inhibition was able to produce some stop in the cell cycle, especially in the most resistant cell lines.
This treatment increased the sensitivity to temozolomide but not in a generalized manner and not at such high levels as was observed in the analysis of the cell cycle with temozolomide for lines such as SW1783 or CCF. Despite inhibiting MGMT levels, SP cells in both normoxia and hypoxia were resistant to the O6-BG and temozolomide combined treatment. Figure 12 shows the effects in the cell cycle of the combined treatment in CCF cells, where the cytotoxic increase occurred preferably during hypoxia culture, but with a 6 h incubation of O6-BG, although this increase did not exist when the treatment was done for 18 h. Figure 13 shows the effects in the cell cycle of the combined treatment in LN405 cells, where the cytotoxic increase occurred in all conditions except in SP cells grown in hypoxia, showing resistance. Figure 14 shows the effects in the cell cycle of the combined treatment in SW1783 SP cells grown in both normoxia and hypoxia, where their resistance to treatments was observed.
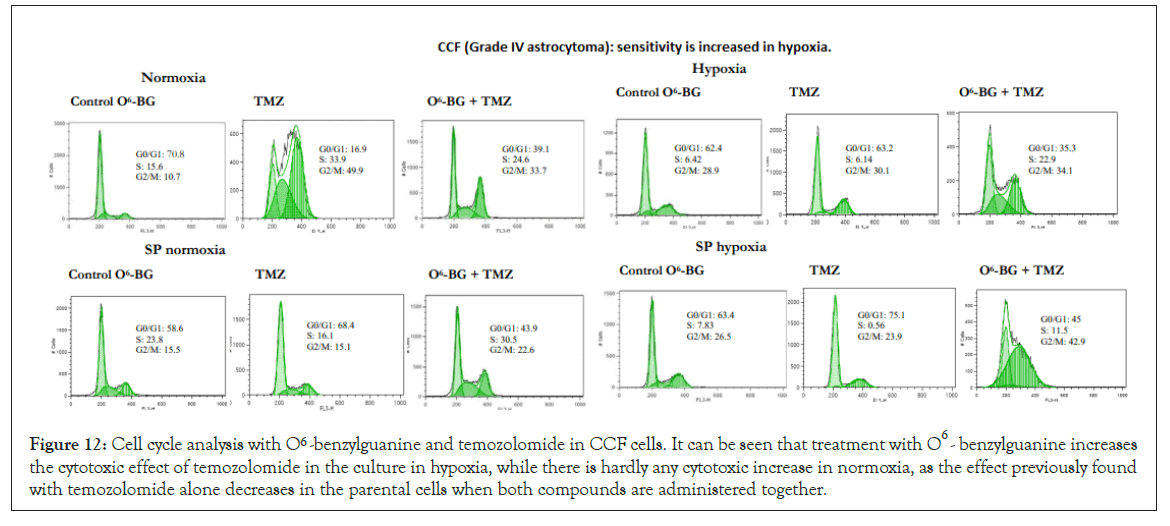
Figure 12: Cell cycle analysis with O6 -benzylguanine and temozolomide in CCF cells. It can be seen that treatment with O6 -benzylguanine increases the cytotoxic effect of temozolomide in the culture in hypoxia, while there is hardly any cytotoxic increase in normoxia, as the effect previously found with temozolomide alone decreases in the parental cells when both compounds are administered together.
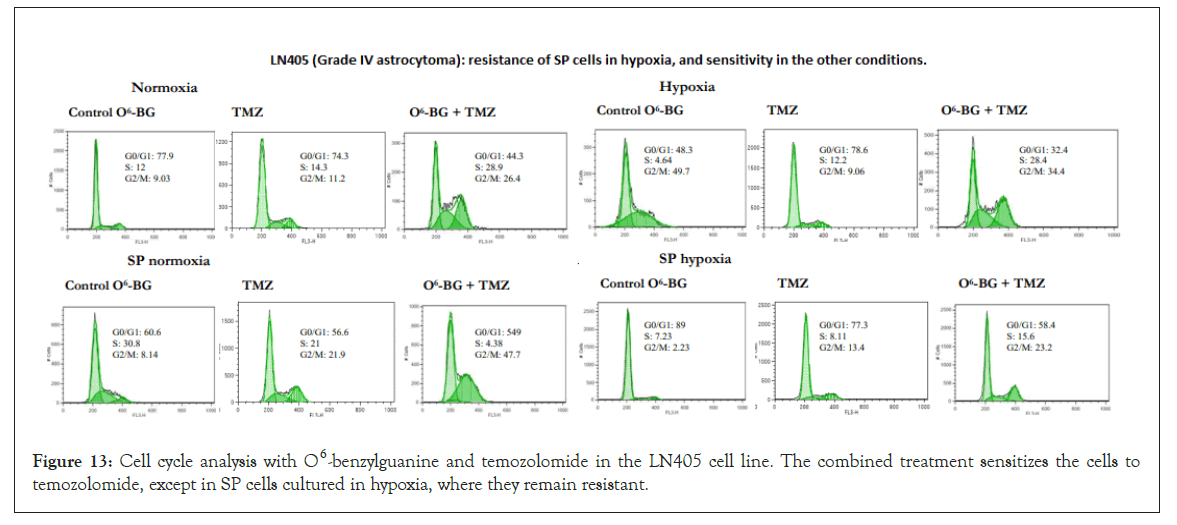
Figure 13: Cell cycle analysis with O6 -benzylguanine and temozolomide in the LN405 cell line. The combined treatment sensitizes the cells to temozolomide, except in SP cells cultured in hypoxia, where they remain resistant.
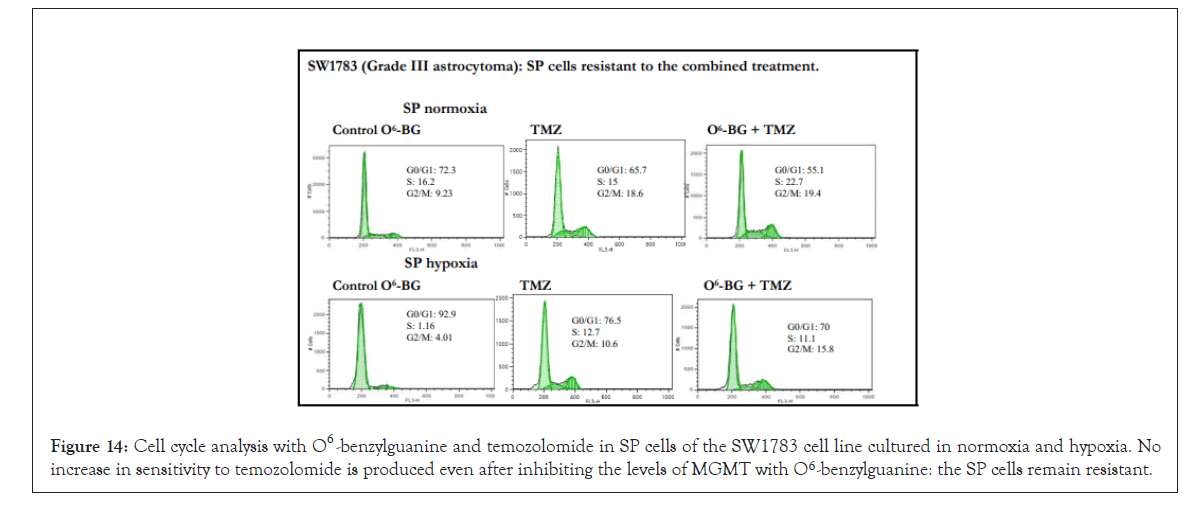
Figure 14: Cell cycle analysis with O6 -benzylguanine and temozolomide in SP cells of the SW1783 cell line cultured in normoxia and hypoxia. No increase in sensitivity to temozolomide is produced even after inhibiting the levels of MGMT with O6 -benzylguanine: the SP cells remain resistant.
Expression of MGMT, MLH1 and MSH2
These markers belong to two pathways involved in DNA repair after damage caused by alkylating agents such as temozolomide. The repair systems are related to the MGMT gene and the mismatch repair (MMR) pathway from which the MLH1 and MSH2 genes have been analyzed. This route has been described as a predictor of the response of glioblastomas to temozolomide. Tumors with MGMT expression would be resistant to this drug and those that do not show expression due to methylation of their promoter would be more sensitive. On the other hand, deficiencies in the MMR system, whether due to lack of expression or mutations of some components of the pathway, have been associated with resistance to temozolomide.
From our experiments, it seems that there is no relationship between MGMT expression and temozolomide resistance. All cell lines, with the exceptions of NHA and U87 in both normoxia and hypoxia, expressed MGMT in all conditions. Temozolomide- resistant cell lines did not show expression of the gene in normoxia or hypoxia but expressed the gene in SP cells. Sensitive cells such as CCF and SW1783 showed high levels of MGMT expression, being very high in SW1783; sensitivity to temozolomide appeared in normoxia and in all other conditions, despite expressing the same levels of MGMT. MOG had less expression in normoxia and the greatest expression was presented in SP cells in hypoxia. CCF reduced expression in hypoxia, unlike LN405, where the highest expression occurred in hypoxia, being higher in SP cells. T98G had high levels of expression in all conditions, although somewhat lower in hypoxia, and GOS3 has a decay in expression in SP cells and hypoxia (Supplementary Figure 4).
Deficiencies in the MMR system have been associated with resistance to temozolomide regardless of the expression of MGMT. In this work, a high expression of the two genes analyzed in the MMR pathway has been observed. Lower levels of MLH1 and MSH2 expression have been observed in NHA cells respect to the rest of the cell lines, both in normoxia and hypoxia. In the case of MSH2, only expression in hypoxia was detected (Supplementary Figure 4).
Gene expression after treatment with temozolomide and in combination with cyclopamine
The effect of the treatment of temozolomide alone or in combination with cyclopamine on the expression of ABCG2, BCL-2, GLI1, GLI2 genes was studied.
ABCG2 and BCL-2 are two genes related to drug resistance. Both genes, in turn, present a high level of expression after conventional chemotherapy treatments.
ABCG2 expression was increased after treatment with temozolomide in the vast majority of cell lines and conditions used. Previous treatment with cyclopamine did not show an additive effect on increasing the expression of ABCG2, except in MOG cells (cultured in normoxia), LN405 (cultured in normoxia) and T98G, where increased ABCG2 expression was observed with the combined treatment versus temozolomide alone (Figure 15).
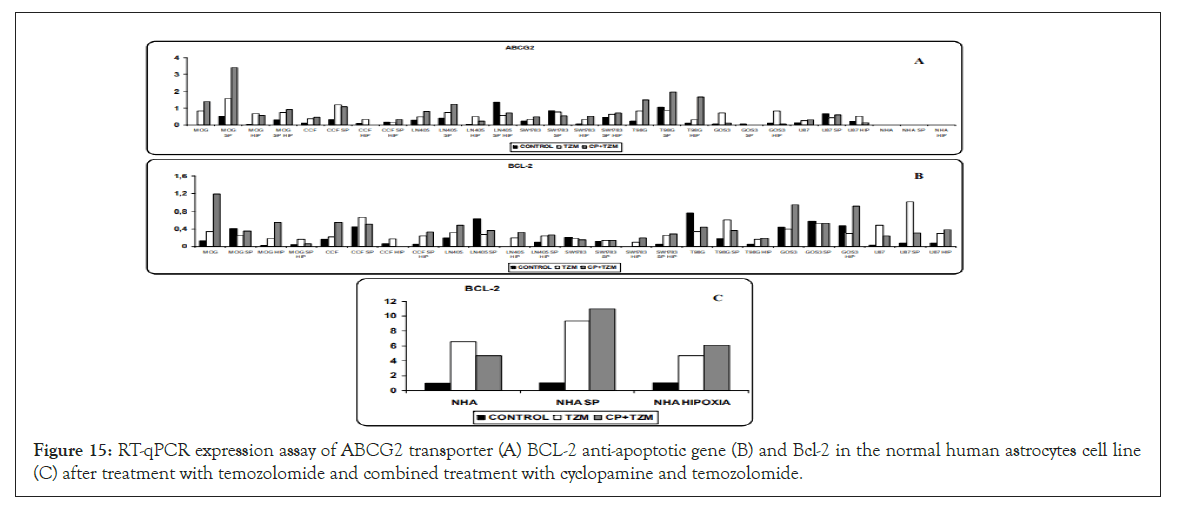
Figure 15:RT-qPCR expression assay of ABCG2 transporter (A) BCL-2 anti-apoptotic gene (B) and Bcl-2 in the normal human astrocytes cell line (C) after treatment with temozolomide and combined treatment with cyclopamine and temozolomide.
The treatment with temozolomide produced an increase in BCL-2 expression in the vast majority of the cell lines analyzed, while in the rest of the cell lines the levels of expression were maintained with respect to the control. Only in SP cells of LN405, in T98G cells grown in normoxia, and in GOS3 cells grown in hypoxia, did temozolomide decrease the level of expression with respect to that found in the control. As with ABCG2, cyclopamine treatment had no additive effects to those found with temozolomide in the expression of BCL-2 (Figure 15).
While temozolomide and the combined treatment had no effect on ABCG2 expression in the NHA astrocyte cell line, BCL- 2 overexpression was induced in NHA cells by temozolomide, without any additive affect with the cyclopamine treatment (Figure 15).
The HH pathway showed a higher level of activation after chemotherapy. The effect of temozolomide and cyclopamine on the two main effectors of the pathway, GLI1 and GLI2, was analyzed.
GLI1 significantly decreased its expression after treatment with temozolomide, especially in the lines that showed a high level of GLI1 expression. Except in the MOG cell line, T98G and its SP cells cultured in normoxia, and U87 in normoxia, where cyclopamine produced a higher expression of GLI1 with respect to temozolomide, the combined treatment did not show any additional effects than temozolomide alone in the other cells (Figure 16).
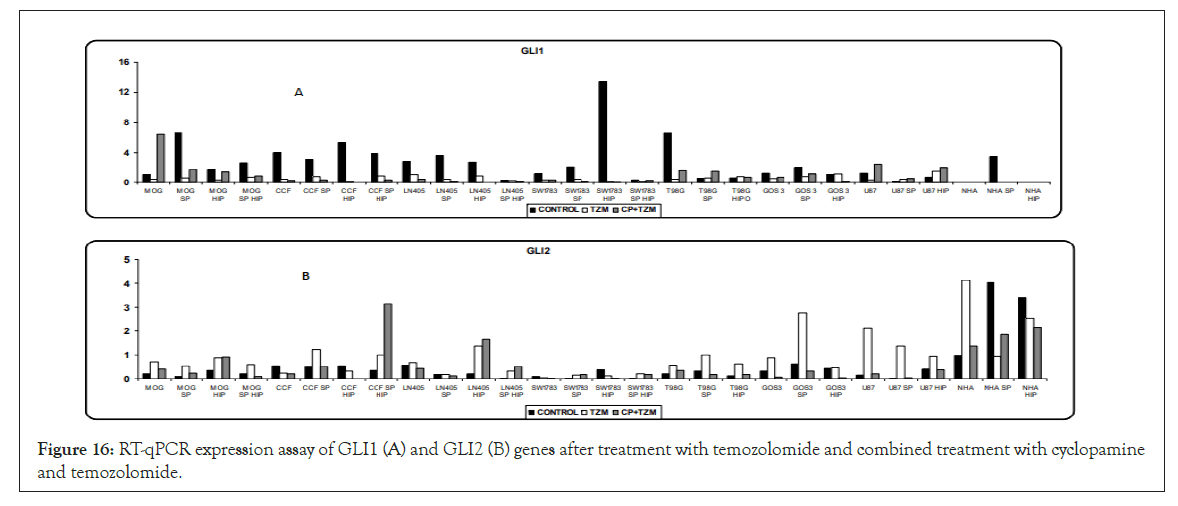
Figure 16: RT-qPCR expression assay of GLI1 (A) and GLI2 (B) genes after treatment with temozolomide and combined treatment with cyclopamine and temozolomide.
Temozolomide produced a higher expression of GLI2 or maintained its expression with respect to control. It seems that cyclopamine showed a greater performance in the modulation of GLI2 expression, especially by decreasing its levels with respect to temozolomide (Figure 16).
Discussion
Identification, enrichment and chemoresistance of side population cells
It has been previously determined that the cells of the Side Population (SP) are enriched in cells with characteristics of tumor (or normal) stem cells and have differences with respect to the non- SP population in terms of tumorigenic capacity and drug resistance.
In neuroblastoma, SP cells not only have characteristics of tumor stem cells (multipotentiality and self-renewal), but are also more resistant to the effects of drugs such as mitoxantrone (MTX) and can contribute to the phenotype of global resistance to antineoplastic agents [32]. In addition, SP cells increase in number after treatment with temozolomide, suggesting that this drug acts on non-SP cells [40]. Although other studies show the opposite result, that temozolomide specifically removes CD133+ tumor stem cells in glioblastoma [41].
In our study, the cell lines containing the lowest percentage in SP cells corresponded to normal human astrocytes (NHA) and low grade astrocytomas, while a higher percentage of SP cells were detected in the cell lines derived from grade III astrocytomas and an even higher percentage in the cells derived from grade IV astrocytomas. Then, there seems to be an association between the percentage of SP and malignancy or tumor prognosis. These findings are consistent with SP cells conferring an aggressive phenotype to tumors and a high degree of resistance to specific drugs.
Neural stem cells are enriched in cell populations defined by the CD133 marker or by the SP phenotype. It is currently unclear whether there is an overlap between SP populations and CD133+ populations, but our data seems to show that this is not the case [23,42]. Our results seem similar to those found by Bleau et al., where the expression of the endothelial markers CD31 and CD133 were not limited to the SP fraction [43]. It is possible that both tumor stem cell populations, CD133+ and SP, are not regulated by the same pathways to confer their capacity for self-renewal, tumor growth and chemoresistance. They could rather constitute distinct or partially overlapping populations of tumor stem cells, which may or may not coexist in tumors, conferring different advantages on cell survival and other tumor properties [44]. In our astrocytoma lines, the aggressive phenotype and drug resistance would be driven by the SP phenotype, mediated by the ABCG2 transporter, and not by CD133 [45]. The fact that tumor cells have aberrant expression of surface antigens, reinforces the need to study whether the increase in the expression of CD133 in tumor stem cells is really a determining characteristic of that population, or simply that tumor cells show an aberrant expression of CD133.
In in vitro studies with serum-free culture media and in the presence of growth factors (selective media), normal neural stem cells were isolated as neurospheres [46]. In our trials, SP cells showed a greater capacity for formation of neurospheres compared to their parental populations (with a small percentage of SP cells). An association was found between the capacity of neurosphere formation and the percentage of SP cells that make up the cell population.
Another characteristic of tumor stem cell-like cells, both CD133+ and SP cells, is the great resistance they show to conventional radiotherapy and chemotherapy treatments. This resistance capacity in the SP phenotype would be determined by the ABCG2 membrane transporter [45]. In the CD133+ populations, which show high levels of ABCG2, it is possible that their resistance to drugs is determined by that transporter and does not constitute an intrinsic property at the level of CD133. In this study, temozolomide-resistant SP cells showed ABCG2 expression and not increased CD133 expression.
In hypoxic conditions our results contrast with the fact that in these conditions the expression of the ABCG2 transporter is induced, increasing the percentage of SP cells to tolerate hypoxic stress and survive. This explains why stem cells proliferate under conditions of low oxygen concentrations. In this work, the analysis of the SP fraction in the parental lines after culture under hypoxic conditions, showed in the vast majority of the cell lines no increase in the SP fraction. It seems that the survival of astrocytoma-derived cells under hypoxic conditions would not be mediated by an increase in the SP fraction, nor consequently by an increase in the ABCG2 transporter.
Gene expression of the sonic hedgehog pathway
Aberrant activation of the HH pathway is necessary for the proliferation, survival, self-renewal and tumorigenicity of brain tumor stem cells, and the inhibition of the pathway significantly decreases its percentage in glioblastomas [47,48].
Some studies do not support the role of GLI1 in gliomagenesis, but others suggest that inappropriate GLI1 function could be crucial for brain tumorigenesis, so that the maintenance of tumorigenesis, initiated by GLI1, must require an endogenous action of the pathway [49-51]. However, in most established cell lines, the activity of the HH pathway is low or zero [52]. A genomic screening of 22 glioblastomas revealed that there were no mutations, amplifications or deletions of either GLI1 or any other pathway gene in gliomas, indicating that the activation of the pathway in gliomas through direct genetic alterations of their genes is rare. However, some contributions support an active role of the HH pathway in gliomagenesis [47,48,53-55].
Based on our results of gene expression of the HH pathway, we found that there was no expression of virtually any gene in the normal astrocyte cell line, and in contrast these genes were expressed in the astrocytoma lines. Differential expression of HH pathway genes between normal cells and tumor cells shows a difference in gene expression of the components of the HH pathway. However, in the in vivo scenario, normal stem cells may show pathway activation to maintain their stem cell phenotype and self-renewal and proliferation potential. These cells would also be candidates as a possible source of aberrant activation of the HH pathway and transformation into a tumor stem cell. In our case we have observed that the culture in a hypoxic microenvironment, provides to the tumor cells lower levels of expression of pathway genes capable of regulating it negatively, thus offering the tumor cells a greater advantage for proliferation and showing that the microenvironment is capable of differentially regulating tumor cells. The same effect was observed in SP tumor cells, showing differences with respect to non-SP tumor cells. In addition, in these cell types the expression of the SHH ligand was shown to be less, also offering other advantages in different and/or additional activation mechanisms than those found in tumor cells or normal cells.
Overexpression of Bcl-2 is associated with HH pathway signaling in keratinocytes and renal epithelial cells although with different results on GLI1 or GLI2 [56-60]. Also in basal carcinoma tumor cells, activation of the HH pathway increased Bcl-2 expression [58]. We verified that in astrocytes there is expression of the GLI2 and Bcl-2 transcription factor, while no expression of GLI1 was detected. In astrocytomas, Bcl-2 expression associated to the expression of the two transcription factors. In normal cells, it seems that Bcl-2 is a specific target of the GLI2 transcription factor, while in tumors it could be regulated by either of the two factors.
Some studies showed that cyclopamine has synergistic effects on proliferation and apoptosis with temozolomide in glioma cells [48]. In our case, it was studied whether the inhibition of the HH pathway with cyclopamine prior to treatment with temozolomide was able to induce changes in the cell cycle and increase the sensitivity to temozolomide. It was found that prior treatment with cyclopamine increases (in different proportions and depending on the culture and population condition) the sensitivity to temozolomide. It seems that the HH pathway provides tumor cells with resistance to drugs such as temozolomide, but by inhibiting the HH pathway with cyclopamine, temozolomide is able to increase its cytotoxic effects on tumor cells. Everything seems to show that inhibiting the HH pathway is a good strategy to eliminate tumor cells and thus avoid aberrant proliferation and procure tumor reduction. However, in tumor cells of the Side Population, there are cellular models in which no synergistic effect between both drugs appears, being the cells resistant and with an added advantage in survival.
It has also been demonstrated that the HH pathway shows a greater degree of activation after radiotherapy and chemotherapy treatments [61,62]. In our cell lines we found that treatment with temozolomide lowers GLI1 levels, disappearing completely in some cases. In contrast, treatment with temozolomide increased GLI2 expression. Contradictory to our results and hypothesis is the fact that some studies have shown that GLI1 inhibition is a good target to reverse drug resistance in gliomas, or that its inhibition induces cell cycle arrest and apoptosis [63,64].
Expression of genes associated with stem cells, drug resistance and apoptosis
Expression of ABC transporters: The expression level of MDR1 is higher in glioblastomas than in low-grade astrocytomas and also reduced levels of P-gp expression have been detected in cells derived from normal human astrocytes, suggesting that MDR1 expression may be linked to high grades of astrocytoma malignancy [65,66]. A strong correlation between the expression and functional activity of P-gp and MRP was detected in malignant glioma lines [67]. It was also demonstrated that although only between 4 and 23% of glioma cells were P-gp positive before chemotherapy, P-gp expression increased after treatment, involving P-gp in resistance to antitumor agents (both intrinsic and acquired) in gliomas [68]. However, another study showed that P-gp was not expressed in normal astrocytes cultured in vitro, and that overexpression of P-gp was not frequent in glioma cells, but a high expression of MRP1 was detected in normal astrocytes and glioma cells. This suggests that P-gp may not be involved and perhaps MRP1 may contribute to intrinsic chemoresistance in gliomas [65]. It has been seen that brain endothelial cells in gliomas may have a key role in the response to chemotherapy in vivo, preventing cytotoxic drugs from entering the central nervous system through activated P-gp function.
ABCG2 is the specific transporter that confers the phenotype of the Side Population and may or may not be co-expressed together with P-gp and MRP1. In gliomas, increased expression of ABCG2 has been described, while reduced levels of ABCG2 have been found in normal brain tissue. Furthermore, it has been described that the expression of ABCG2 correlates with an increase in the histological degree of tumor malignancy, suggesting that ABCG2 may be a marker in glioma progression [69].
The resistance to temozolomide shown by normal astrocytes in both normoxia and hypoxia is not due to the ABCB1 and ABCG2 transporters, since both are not expressed, and may not be specific transporters of normal astrocytes. The resistance may be given by the expression of other transporters such as MRP1 or others. However, in high-grade astrocytoma cell lines there is expression of both transporters. This suggests that normal cells and tumor cells could have a regulatory activity of the extrusion of substances and drugs mediated by different transporters. This fact could be interesting for specific transporter inhibition studies.
However, astrocytes enriched in stem cells of the Side Population show high expression of ABCB1 (and with hardly any expression of ABCG2, contrary to expectations). This fact shows that within the same population, depending on the enrichment in stem cells, there are differences in gene expression. In this case, perhaps resistance in normal stem cells would be mediated by the high expression of ABCB1. The fact that the line derived from a low-grade astrocytoma showed a high expression of the ABCB1 transporter, and the expression in the lines derived from high-grade astrocytomas being lower, may suggest that the ABCB1 transporter is more specific for low-grade gliomas, losing its expression as the tumor acquires a more aggressive phenotype. In that hypothetical scenario, ABCB1 would not be a marker of tumor progression of astrocytomas.
ABCG2 was detected in virtually all astrocytoma cell lines and its expression was higher in SP cells, a fact that did not occur with ABCB1. These results are consistent with the fact that ABCG2 is the transporter that confers the phenotype of the Side Population. Although the expression of ABCG2 in hypoxia did not increase, its SP-hypoxia-grown cells showed increased expression, supporting the hypothesis that this transporter is specific to SP cells. However, in the cell line derived from low-grade astrocytoma as well as in normal astrocyte cells enriched in stem cells, no increase in ABCG2 expression was detected, even being SP cells, but an increase in ABCB1 was detected. This suggests that different transporters may express themselves depending on the tumor stage, with ABCB1 being more specific to those of low grade and astrocytes enriched with SP, and ABCG2 being more specific to those cells of high grade of malignancy.
The result of the quantification of ABCG2 after treatment with temozolomide, served to demonstrate that this drug increased the expression of ABCG2. This increase in expression can lead tumor cells to show acquired resistance during treatment and to give them an advantage in survival and a more aggressive phenotype, through a more active extrusion of antineoplastic drugs. This fact could be independent of the state of differentiation of the tumor cell, providing acquired resistance to both tumor cell populations without stem cell characteristics and tumor stem cells.
When we previously treated the cells with cyclopamine to inhibit the HH pathway, the resulting levels of ABCG2 expression were more variable and cyclopamine had no effect. Cyclopamine appears to be modulating the extrusion activity of ABCG2. In other cellular models, on the other hand, cyclopamine does have an additional effect on increasing the expression of ABCG2, being also dependent on the basal level of ABCG2 (at a higher baseline level of ABCG2, the increase in its expression is even greater than that induced by temozolomide). In these tumor models, inhibition of the HH pathway to eliminate tumor cells seems not to be a good therapeutic target. However, in other cellular models, inhibition of the HH pathway could be a good strategy to increase the effects of temozolomide [70,71].
Expression of genes associated with stem cells: CD133 has been identified as a marker of tumor stem cells in a wide variety of tumors, including medulloblastoma and glioblastoma [4,5,72]. Tumor stem cells are significantly enriched in CD133+ cells. In hypoxia, higher levels of CD133 expression have been observed, in relation to an increase in the tumorigenic potential of the cell line [15-17]. The high resistance shown by CD133+ tumor stem cell populations is due, among other properties, to their high levels of ABCG2 and ABCB1 [10]. In some cases, in addition, ABCG2 and CD133 are coexpressed, as in cell lines of pancreatic carcinoma, melanomas and hepatocarcinomas, among others [73-75].
In our study, very minor levels of CD133 expression were detected in parental lines in normoxia. However, it was found that many of these lines were resistant to temozolomide. Therefore, CD133 may not be responsible for the chemoresistance offered by these tumor cells to that drug. The fact that populations of CD133+ tumor stem cells show high levels of ABCG2 expression, suggests that resistance is determined by this transporter. In addition, the highest resistance to temozolomide was found in SP cells, which is also due to the greater expression of ABCG2 and not of CD133.
Possibly, tumor stem cells isolated by the CD133 marker or by the Side Population phenotype constitute different populations, are regulated by different pathways and cause drug resistance by different mechanisms.
The BMI-1 polycomb factor is necessary for the self-renewal of both normal and tumor stem cells in the hematopoietic, epithelial and nervous systems, as well as for the maintenance of cells in an undifferentiated state. Overexpression of this protein is common in medulloblastomas [76-80]. Chiba and colleagues showed that BMI-1 contributes to the maintenance of the SP population in hepatocellular carcinoma [81]. An over-expression of BMI- 1 promotes the self-renewal of stem cells or liver progenitors, and contributes to malignant transformation. In addition, they demonstrated that BMI-1 expression was higher in SP cells compared to non-SP cells. The inhibition of the expression of BMI-1 decreased the SP population, being the first time it was determined that the loss of BMI-1 in tumor stem cells could affect their capacity for self-renewal and tumorigenicity.
In all our astrocytoma cell lines we have been able to verify that there is overexpression of the gene. However, it seems not to contribute to the self-renewal of SP tumor stem cells, because they are capable of forming neurospheres (capacity for self-renewal) in a greater proportion than their parental population, but SP cells showed lower expression of BMI-1 compared to their parental line.
Bcl-2 anti-apoptotic gene expression: In addition to the chemoresistance mechanisms mediated by DNA repair pathways, chemoresistance in gliomas may be influenced by a deregulation of the genes and proteins that control apoptosis. For example, overexpression of Bcl-2 can modify the normal apoptotic response produced after DNA damage.
Bcl-2 has also been studied in the context of chemoresistance. An increase in the levels of Bcl-2 expression results in increased chemoresistance and proliferation of tumor cells [82]. Transfection of Bcl-2 to glioma cells caused a decrease in the effect of therapeutic irradiation and the cytotoxicity of antitumor agents, causing chemoresistance and decreased apoptotic response.
According to our study, the Bcl-2 gene could be of great importance in the intrinsic resistance to chemotherapy. It was expressed both in normal astrocytes and astrocytomas, protecting cells from cytotoxic agents to contribute to their survival and proliferation. Populations enriched in tumor stem cells using the CD133 marker, showed higher levels of Bcl-2, data consistent with our SP cells, which were also enriched in tumor stem cells, and where higher levels of Bcl-2 were found in almost all cases.
Bcl-2 expression changes were also studied after treatment with temozolomide, or in combination with cyclopamine. The treatment with temozolomide, as in ABCG2 and except in specific cases, produced an increase in Bcl-2 expression, being very high in the astrocyte cell line. Bcl-2 appears to be involved in the acquired resistance to chemotherapy during conventional treatments, independently of the immaturity status of the tumor cell. Treatment with temozolomide could provide tumor cells with an advantage in survival by increased expression of genes, like ABCG2 or BCL-2, associated with a phenotype similar to that of tumor stem cells.
When the cells were previously cultured with cyclopamine, except in specific cases where there was greater Bcl-2 expression with respect to temozolomide, cyclopamine did not show great effects; the same as observed with the effect of cyclopamine on ABCG2, a fact that could support the hypothesis that cyclopamine was extruded by ABCG2.
Therefore, it seems that the treatment with temozolomide provides an added acquired resistance, favoring the expression of Bcl-2, an anti-apoptotic gene that produces escape of apoptosis and drug resistance so that the cell can survive under conditions of selective pressure.
Hypoxia and hypoxia-inducible factors
Hypoxia, as an event associated with the mechanisms of carcinogenesis, can be important for tumor development, angiogenesis, or resistance to antineoplastic drugs, in addition to producing a more aggressive tumor phenotype, favoring malignant progression.
In glioma cell lines, Hypoxia-Inducible Factors (HIFs) can be expressed in both normoxia and hypoxia, and most tumors respond to hypoxia using HIF-1α [83-85]. However, some recent studies have found differences in expression both at the mRNA and protein levels, between factors HIF-1α and HIF-2α, demonstrating that HIF-2α is significantly expressed in the population of tumor stem cells but not in differentiated tumor cell populations or in normal neuronal progenitors [86]. HIF-1α, on the other hand, was expressed in both tumor and non-tumor stem cell populations, and in normal neuronal progenitor populations. HIF-2α has been shown to play an important role in the plasticity of the tumor cell phenotype. HIF-1α had no effect on the levels of gene expression associated with tumor stem cells. However, HIF-2α induced overexpression of genes associated with tumor stem cells, such as CD133 [15,16]. The genetic silencing of the two factors showed that only HIF-2α eliminated hypoxia-dependent induction of the tumor stem cell phenotype. HIF-2α is, therefore, necessary to maintain the tumor stem cell phenotype and can reprogram the dedifferentiation of non-stem tumor cells to an undifferentiated tumor stem cell phenotype.
Gene expression analysis of both factors showed that they are expressed differentially depending on whether the cells are normal or tumor cells. It was found that HIF-1α is preferably expressed in normal astrocyte cells and in their cells enriched in SP stem cells. Because both factors have common and other specific targets, it is possible that HIF-1α factor confers specific and adaptive properties to normal cells and not to tumor cells, in order to survive and proliferate during radiotherapy and chemotherapy treatments, while the HIF-2α factor seems to be more specific for tumor stem cells. On the other hand, both factors are usually more expressed in the population enriched in tumor stem cells and in the hypoxia condition.
One fact to consider, is that in LN405 and SW1783 cells, the expression of HIF-2α increases in hypoxia and experiences a large decrease in expression in SP cells cultured in hypoxia, the same effect as observed in the expression of CD133. These results can support the hypothesis that HIF-2α is the responsible factor for the positive regulation of CD133, and not HIF-1α. Therefore, HIF-2α would be responsible for the plasticity of tumor cells.
Cell cultures under hypoxic conditions provide great resistance to the tumor cells. This fact was visible in parental lines, which are not enriched in tumor stem cells of the Side Population. It seems, therefore, that a hypoxic microenvironment provides tumor cells with resistance to conventional drugs, and that being a characteristic of tumor stem cells, hypoxia provides them with a more aggressive phenotype, being able to acquire and reprogram tumor cells towards a phenotype associated with tumor stem cells.
Therefore, treatments that have tumor stem cells as the only specific targets may be an insufficient strategy for an effective treatment, because tumor cells without stem cell characteristics can acquire characteristics of tumor stem cells due to the effects of the microenvironment, such as the effect of hypoxia. Therefore, therapeutic targets that simultaneously target the hypoxic tumor microenvironment of the niche may be essential for the efficacy of therapies based on tumor stem cells [70].
DNA repair systems for genetic damage caused by temozolomide
Intrinsic or acquired resistance to cytotoxic agents remains the major obstacle in the treatment of high-grade astrocytomas, which present a variety of resistance mechanisms to antineoplastic drugs. MGMT seems to be the most important pathway in the resistance to temozolomide and other alkylating agents. Pretreatment with MGMT inhibitors, such as O6 -BG, suppresses MGMT activity and produces sensitivity to BCNU (carmustine) in xenotransplanted models that contain MGMT positive cells [87]. Other studies showed that this inhibition increased the antitumor activity of temozolomide both in vitro and in vivo [88-91]. The loss of MGMT function is normally caused by hypermethylation of regions of its promoter [92,93]. Tumors with methylated MGMT promoters are more sensitive to alkylating agents, while those with the non- methylated promoter express high levels of MGMT and are more resistant to chemotherapy. Clinically, MGMT promoter methylation is associated with a better response to these pharmacological agents, providing greater survival [94-96]. Therefore, methylation of the MGMT promoter can predict a positive therapeutic response to alkylating agents. Although very recent studies show that a subset of recurrent gliomas carry MGMT genomic rearrangements that lead to MGMT overexpression, independently from changes in its promoter methylation [97].
The results obtained in our experiments showed that the vast majority of the cell lines derived from astrocytomas showed MGMT expression and some resistance to temozolomide, suggesting that MGMT expression levels associate with a poor cytotoxic response to this chemotherapeutic agent. However, it is possible that a subtype of astrocytomas do not follow this association, since there may be tumor cells that are very sensitive to temozolomide and show high expression of MGMT. In this case, MGMT would not be a determining factor in the response of tumor cells to temozolomide.
As in previous results, it has been found that there are differences in gene expression between normal and tumor cells. In normal cells, it seems that its resistance to temozolomide is not determined by the expression of MGMT. Possibly, its chemoresistance capacity is regulated by mechanisms other than those that regulate tumor cells, and would not affect the proliferative capacity of normal cells.
We also analyzed the cytotoxic effect of temozolomide after a previous treatment with O6-BG to inhibit MGMT levels, in order to check if the cytotoxicity of temozolomide is increased, and if the resistance or sensitivity to temozolomide in our cell lines is mediated by MGMT levels. In general, a pre-treatment of temozolomide with O6 -BG results in an increase in the sensitivity of tumor cells to temozolomide. These data seem to show that MGMT can be an important marker in resistance to alkylating agents, and the use of specific inhibitors for MGMT, can be a good strategy to increase the sensitivity of tumor cells to temozolomide. It was also proven that the hypoxic microenvironment of tumor cells is able to provide resistance and confer characteristics associated with cells with a more undifferentiated phenotype. An inhibition of MGMT through the use of O6-BG, is capable of increasing the sensitivity to temozolomide in normoxic conditions. Resistance appears when cells are exposed to a hypoxic microenvironment, in which no cytotoxicity of the drug occurs. In these cases, hypoxia could provide other additional chemoresistance mechanisms.
Therefore, it is also likely that tumor stem cells show other mechanisms for repairing DNA damage in addition to those of MGMT. Therefore, the expression of MLH1 and MSH2, genes belonging to the mismatch repair (MMR) pathway, was analyzed. Some studies have shown that patients with glioma showing reduced levels of MGMT and elevated MLH1 and MSH2 have a better response to temozolomide than patients with elevated levels of MGMT and reduced levels of MLH1 and MSH2 [98]. Meanwhile, another study showed that MMR system deficiencies do not participate in chemoresistance in malignant gliomas [99- 102].
Conclusion
We could determine high expression of the two main genes of the MMR pathway in our cell lines, suggesting that cells are not deficient for MMR, and that sensitivity to treatment with temozolomide might occur. Significantly lower levels of MLH1 and MSH2 were observed in the normal astrocyte line. This fact, once again, shows differences in the expression of genes or pathways between normal cells and tumor cells, which suggests the possibility that drug resistance is regulated by different DNA repair mechanisms. Therefore, perhaps, the MMR pathway may provide resistance to temozolomide in normal astrocytes but not in astrocytoma cells, where it appears that chemoresistance is independent of the MMR pathway. In this sense, other genes of this pathway that have not been analyzed might be responsible for conferring the deficiency to the MMR system. For example, mutations or loss of MSH6 are associated with tumor progression during chemotherapy with temozolomide, and PMS2 overexpression confers tolerance to DNA damage.
Acknowledgement
Financial support for this work was provided by a grant from the Fundación Universidad de Navarra, Pamplona, Spain.
REFERENCES
- Wu C, Alman BA. Side population cells in human cancers. Cancer Lett. 2008; 268(1):1-9.
- Hadnagy A, Gaboury L, Beaulieu R, Balicki D. SP analysis may be used to identify cancer stem cell populations. Exp Cell Res. 2006;312(19):3701-3710.
- Galli R, Binda E, Orfanelli U, Cipelletti B, Gritti A, Vitis SD, et al. Isolation and characterization of tumorigenic, stem-like neural precursors from human glioblastoma. Cancer Res. 2004;64(19):7011-7021.
- Singh SK, Clarke ID, Terasaki M, Bonn VE, Hawkins C, Squire J, et al. Identification of a cancer stem cell in human brain tumors. Cancer Res. 2003;63(18):5821-5828.
- Singh SK, Hawkins C, Clarke ID, Squire JA, Bayani J, Hide T, et al. Identification of human brain tumour initiating cells. Nature. 2004;432(10):396-401.
- Hemmati HD, Nakano I, Lazareff JA, Masterman-Smith M, Geschwind DH, Fraser MB, et al. Cancerous stem cells can arise from pediatric brain tumors. Proc Natl Acad Sci USA. 2003;100(25):15178-15183.
- Taylor MD, Poppleton H, Fuller C, Su X, Liu Y, Jensen P, et al. Radial glia cells are candidate stem cells of ependymoma. Cancer Cell. 2004;8(4):323-335.
- Vescovi AL, Galli R, Reynolds BA. Brain tumour stem cells. Nat Rev Cancer. 2006;6(4):425-436.
- Ignatova TN, Kukekov VG, Laywell ED, Suslov ON, Vrionis FD, Steindler DA, et al. Human cortical glial tumors contain neural stem-like cells expressing astroglial and neuronal markers in vitro. Glia. 2002;39(3):193-206.
- Dean M, Fojo T, Bates S. Tumour stem cells and drug resistance. Nat Rev Cancer. 2005;5(4):275-284.
- Bao S, Wu Q, McLendon RE, Hao Y, Shi Q, Hjelmeland AB, et al. Glioma stem cells promote radioresistance by preferential activation of the DNA damage response. Nature. 2006;444(10):756-760.
- Shmelkov SV, St Clair R, Lyden D, Rafii S. AC133/CD133/Prominin-1. Int J Biochem Cell Biol. 2005;37(4):715-719.
- Neuzil J, Stantic M, Zobalova R, Chladova J, Wang X, Prochazka L, et al. Tumour-initiating cells vs. cancer 'stem' cells and CD133: what's in the name? Biochem Biophys Res Commun. 2007; 355(4):855-859.
- Kania G, Corbeil D, Fuchs J, Tarasov KV, Blyszczuk P, Huttner WB, et al. Somatic stem cell marker prominin-1/CD133 is expressed in embryonic stem cell-derived progenitors. Stem Cells. 2005;23():791-804.
- McCord AM, Jamal M, Shankavaram UT, Lang FF, Camphausen K, Tofilon PJ. Physiologic oxygen concentration enhances the stem-like properties of CD133+ human glioblastoma cells in vitro. Mol Cancer Res. 2009;7(4):489-497.
- Soeda A, Park M, Lee D, Mintz A, Androutsellis-Theotokis A, McKay RD, et al. Hypoxia promotes expansion of the CD133-positive glioma stem cells through activation of HIF-1alpha. Oncogene. 2009;28():3949-3959.
- Griguer CE, Oliva CR, Gobin E, Marcorelles P, Benos DJ, Lancaster JR, et al. CD133 is a marker of bioenergetic stress in human glioma. PLoS One. 2008;3(11):e3655.
- Beier D, Hau P, Proescholdt M, Lohmeier A, Wischhusen J, et al. CD133(+) and CD133(-) glioblastoma-derived cancer stem cells show differential growth characteristics and molecular profiles. Cancer Res. 2007;67(9):4010-4015.
- Goodell MA, Brose K, Paradis G, Conner AS, Mulligan RC. Isolation and functional properties of murine hematopoietic stem cells that are replicating in vivo. J Exp Med. 1996;183():1797-1806.
- Goodell MA, Rosenzweig M, Kim H, Marks DF, DeMaria M, Paradis G, et al. Dye efflux studies suggest that hematopoietic stem cells expressing low or undetectable levels of CD34 antigen exist in multiple species. Nat Med. 1997;3(2):1337-1345.
- Meeson AP, Hawke TJ, Graham S, Jiang N, Elterman J, Hutcheson K, et al. Cellular and molecular regulation of skeletal muscle side population cells. Stem Cells. 2004;22(7):1305-1320.
- Behbod F, Xian W, Shaw CA, Hilsenbeck SG, Tsimelzon A, et al. Transcriptional profiling of mammary gland side population cells. Stem Cells. 2006;24(4):1065-1074.
- Kim M, Morshead CM. Distinct populations of forebrain neural stem and progenitor cells can be isolated using side-population analysis. J Neurosci. 2003;23(33):10703-10709.
- Martin CM, Meeson AP, Robertson SM, Hawke TJ, Richardson JA, Bates S, et al. Persistent expression of the ATP-binding cassette transporter, Abcg2, identifies cardiac SP cells in the developing and adult heart. Dev Biol. 2004;265(1):262-275.
- Shimano K, Satake M, Okaya A, Kitanaka J, Kitanaka N, Takemura M, et al. Hepatic oval cells have the side population phenotype defined by expression of ATP-binding cassette transporter ABCG2/BCRP1. Am J Pathol. 2003;163(1):3-9.
- Majka SM, Beutz MA, Hagen M, Izzo AA, Voelkel N, Helm KM. Identification of novel resident pulmonary stem cells: form and function of the lung side population. Stem Cells. 2005;23(8):1073-1081.
- Summer R, Kotton DN, Sun X, Ma B, Fitzsimmons K, Fine A. Side population cells and Bcrp1 expression in lung. Am J Physiol Lung Cell Mol Physiol. 2003;285(1):L97-104.
- Yano S, Ito Y, Fujimoto M, Hamazaki TS, Tamaki K, Okochi H. Characterization and localization of side population cells in mouse skin. Stem Cells. 2005;23(6):834-841.
- Larderet G, Fortunel NO, Vaigot P, Cegalerba M, Maltere P, Zobiri O, et al. Human side population keratinocytes exhibit long-term proliferative potential and a specific gene expression profile and can form a pluristratified epidermis. Stem Cells. 2006;24(4):965-974.
- Patrawala L, Calhoun T, Schneider-Broussard R, Zhou J, Claypool K, Tang DF. Side population is enriched in tumorigenic, stem-like cancer cells, whereas ABCG2+ and ABCG2- cancer cells are similarly tumorigenic. Cancer Res. 2005;65(14):6207-6219.
- Kondo T, Setoguchi T, Taga T. Persistence of a small subpopulation of cancer stem-like cells in the C6 glioma cell line. Proc Natl Acad Sci USA. 2004;101(3):781-786.
- Hirschmann-Jax C, Foster AE, Wulf GG, Nuchtern JG, Jax TW, Gobel U, et al. A distinct "side population" of cells with high drug efflux capacity in human tumor cells. Proc Natl Acad Sci USA. 2004;101(39):14228-14233.
- Chiba T, Kita K, Zheng YW, Yokosuka O, Saisho H, Iwama A, et al. Side population purified from hepatocellular carcinoma cells harbors cancer stem cell-like properties. Hepatology. 2006;44(1):240-251.
- Haraguchi N, Utsunomiya T, Inoue H, Tanaka F, Mimori K, Barnard GF, et al. Characterization of a side population of cancer cells from human gastrointestinal system. Stem Cells. 2006;24(3):506-513.
- Mitsutake N, Iwao A, Nagai K, Namba H, Ohtsuru A, Saenko V, et al. Characterization of side population in thyroid cancer cell lines: cancer stem-like cells are enriched partly but not exclusively. Endocrinology. 2007;148(4):1797-1803.
- Szotek PP, Pieretti-Vanmarcke R, Masiakos PT, Dinulescu DM, Connolly D, Foster R, et al. Ovarian cancer side population defines cells with stem cell-like characteristics and Mullerian Inhibiting Substance responsiveness. Proc Natl Acad Sci USA. 2006;103(30):11154-11159.
- Chédeville AL, Madureira PA. The Role of Hypoxia in Glioblastoma Radiotherapy Resistance. Cancers. 2021;13(3):542.
- Monteiro AR, Hill R, Pilkington GJ, Madureira PA. The Role of Hypoxia in Glioblastoma Invasion. Cells. 2017;6(4):45.
- Livak KJ, Schmittgen TD. Analysis of relative gene expression data using real-time quantitative PCR and the 2(-Delta Delta C(T)) Method. Methods. 2001;25(4):402-408.
- Chua C, Zaiden N, Chong KH, See SJ, Wong MC, Ang BT, et al. Characterization of a side population of astrocytoma cells in response to temozolomide. J Neurosurg. 2008;109(5):856-866.
- Beier D, Rohrl S, Pillai DR, Schwarz S, Kunz-Schughart LA, Lukel P,et al. Temozolomide preferentially depletes cancer stem cells in glioblastoma. Cancer Res. 2008;68(14):5706-5715.
- Uchida N, Buck DW, He D, Reitsma MJ, Masek M, Phan TV, et al. Direct isolation of human central nervous system stem cells. Proc Natl Acad Sci USA. 2000;97(26):14720-14725.
- Bleau AM, Hambardzumyan D, Ozawa T, Fomchenko EI, Huse JT, Brennan CW, et al. PTEN/PI3K/Akt pathway regulates the side population phenotype and ABCG2 activity in glioma tumor stem-like cells. Cell Stem Cell. 2009;4(3):226-235.
- Wan F, Zhang S, Xie R, Gao B, Campos B, Mende CH, et al. The utility and limitations of neurosphere assay, CD133 immunophenotyping and side population assay in glioma stem cell research. Brain Pathol. 2010;20(2):877-889.
- Balbuena J, Pachon G, Lopez-Torrents G, Aran JM, Castresana JS, Petriz J. (2011) ABCG2 is required to control the sonic hedgehog pathway in side population cells with stem-like properties. Cytometry A. 2011;79(9): 672-683.
- Reynolds BA, Tetzlaff W, Weiss S. A multipotent EGF-responsive striatal embryonic progenitor cell produces neurons and astrocytes. J Neurosci. 1992;12(11):4565-4574.
- Bar EE, Chaudhry A, Lin A, Fan X, Schreck K, Matsui W, et al. Cyclopamine-mediated hedgehog pathway inhibition depletes stem-like cancer cells in glioblastoma. Stem Cells. 2007;25(10):2524-2533.
- Clement V, Sanchez P, de Tribolet N, Radovanovic I, Ruiz i Altaba A. HEDGEHOG-GLI1 signaling regulates human glioma growth, cancer stem cell self-renewal, and tumorigenicity. Curr Biol. 2007;17(2):165-172.
- Salgaller M, Pearl D, Stephens R. In situ hybridization with single-stranded RNA probes to demonstrate infrequently elevated gli mRNA and no increased ras mRNA levels in meningiomas and astrocytomas. Cancer Lett. 1991;57(3):243-253.
- Xiao H, Goldthwait DA, Mapstone T. A search for gli expression in tumors of the central nervous system. Pediatr Neurosurg. 1994;20(3):178-182.
- Dahmane N, Sanchez P, Gitton Y, Palma V, Sun T, Beyna M, et al. The Sonic Hedgehog-Gli pathway regulates dorsal brain growth and tumorigenesis. Development. 2001;128(24):5201-5212.
- Becher OJ, Hambardzumyan D, Fomchenko EI, Momota H, Mainwaring L, Bleau AM, et al. Gli activity correlates with tumor grade in platelet-derived growth factor-induced gliomas. Cancer Res. 2008;68(7):2241-2249.
- Parsons DW, Jones S, Zhang X, Lin JC, Leary RJ, Angenendt P. An integrated genomic analysis of human glioblastoma multiforme. Science. 2008;321(5897):1807-1812.
- Ehtesham M, Sarangi A, Valadez JG, Chanthaphaychith S, Becher MW, et al. Ligand-dependent activation of the hedgehog pathway in glioma progenitor cells. Oncogene. 2007;26(8):5752-5761.
- Xu Q, Yuan X, Liu G, Black KL, Yu JS. Hedgehog signaling regulates brain tumor-initiating cell proliferation and portends shorter survival for patients with PTEN-coexpressing glioblastomas. Stem Cells. 2008;26(3):3018-3026.
- Louro ID, Bailey EC, Li X, South LS, McKie-Bell PR, Yoder BK, et al. Comparative gene expression profile analysis of GLI and c-MYC in an epithelial model of malignant transformation. Cancer Res. 2002;62(20):5867-5873.
- Fan H, Oro AE, Scott MP, Khavari PA. Induction of basal cell carcinoma features in transgenic human skin expressing Sonic Hedgehog. Nat Med. 1997;3(5):788-792.
- Bigelow RL, Chari NS, Unden AB, Spurgers KB, Lee S, Roop DR, et al. Transcriptional regulation of bcl-2 mediated by the sonic hedgehog signaling pathway through gli-1. J Biol Chem. 2004;279(2):1197-1205.
- Xu XF, Guo CY, Liu J, Yang WJ, Xia YJ, Xu L, et al. Gli1 maintains cell survival by up-regulating IGFBP6 and Bcl-2 through promoter regions in parallel manner in pancreatic cancer cells. J Carcinog. 2009;8(5):13.
- Regl G, Kasper M, Schnidar H, Eichberger T, Neill GW, Philpott MP, et al. Activation of the BCL2 promoter in response to Hedgehog/GLI signal transduction is predominantly mediated by GLI2. Cancer Res. 2004;64(21):7724-7731.
- Chen YJ, Sims-Mourtada J, Izzo J, Chao KS. Targeting the hedgehog pathway to mitigate treatment resistance. Cell Cycle. 2007;6(15):1826-1830.
- Sims-Mourtada J, Izzo JG, Apisarnthanarax S, Wu TT, Malhotra U, et al. Hedgehog: an attribute to tumor regrowth after chemoradiotherapy and a target to improve radiation response. Clin Cancer Res. 2006;12(21):6565-6572.
- Cui D, Xu Q, Wang K, Che X. Gli1 is a potential target for alleviating multidrug resistance of gliomas. J Neurol Sci. 2010;288(2):156-166.
- Wang K, Pan L, Che X, Cui D, Li C. Gli1 inhibition induces cell-cycle arrest and enhanced apoptosis in brain glioma cell lines. J Neurooncol. 2010;98():319-327.
- Spiegl-Kreinecker S, Buchroithner J, Elbling L, Steiner E, Wurm G, Bodenteich A, et al. Expression and functional activity of the ABC-transporter proteins P-glycoprotein and multidrug-resistance protein 1 in human brain tumor cells and astrocytes. J Neurooncol. 2002;57(3):27-36.
- Bahr O, Rieger J, Duffner F, Meyermann R, Weller M, WQick W. P-glycoprotein and multidrug resistance-associated protein mediate specific patterns of multidrug resistance in malignant glioma cell lines, but not in primary glioma cells. Brain Pathol. 2003;13(4):482-494.
- Mousseau M, Chauvin C, Nissou MF, Chaffanet M, Plantaz D, Benabid A. A study of the expression of four chemoresistance-related genes in human primary and metastatic brain tumours. Eur J Cancer. 1993;29A(5):753-759.
- Abe T, Mori T, Wakabayashi Y, Nakagawa M, Cole SP, Koike K, et al. Expression of multidrug resistance protein gene in patients with glioma after chemotherapy. J Neurooncol. 1998;40(10):11-18.
- Jin Y, Bin ZQ, Qiang H, Liang C, Hua C, Jun D, et al. ABCG2 is related with the grade of glioma and resistance to mitoxantone, a chemotherapeutic drug for glioma. J Cancer Res Clin Oncol. 2009;135(10):1369-1376.
- Liu YJ, Ma YC, Zhang WJ, Yang ZZ, Liang DS,Wu ZF, et al. Combination therapy with micellarized cyclopamine and temozolomide attenuate glioblastoma growth through Gli1 down-regulation. Oncotarget. 2017;8(26):42495-42509.
- Carballo GB, Matias D, Ribeiro JH, Pessoa LS, Arrais-Neto AM, Spohr TCLS, et al. Cyclopamine sensitizes glioblastoma cells to temozolomide treatment through Sonic hedgehog pathway. Life Sci. 2020;257(15):118027.
- Singh SK, Clarke ID, Hide T, Dirks PB. Cancer stem cells in nervous system tumors. Oncogene. 2004; 23(10):7267-7273.
- Wang YH, Li F, Luo B, Wang XH, Sun HC, Liu S, et al. A side population of cells from a human pancreatic carcinoma cell line harbors cancer stem cell characteristics. Neoplasma. 2009;56(5):371-378.
- Monzani E, Facchetti F, Galmozzi E, Corsini E, Benetti A, Carvazzin A, et al. Melanoma contains CD133 and ABCG2 positive cells with enhanced tumourigenic potential. Eur J Cancer. 2007;43(5):935-946.
- Jia Q, Zhang X, Deng T, Gao J. Positive correlation of Oct4 and ABCG2 to chemotherapeutic resistance in CD90(+)CD133(+) liver cancer stem cells. Cell Reprogram. 2013;15(2):143-150.
- Liu S, Dontu G, Mantle ID, Patel S, Ahn NS, Jackson KW, et al. Hedgehog signaling and Bmi-1 regulate self-renewal of normal and malignant human mammary stem cells. Cancer Res. 2006;66(12):6063-6071.
- Molofsky AV, Pardal R, Iwashita T, Park IK, Clarke MF, Morrison SJ. Bmi-1 dependence distinguishes neural stem cell self-renewal from progenitor proliferation. Nature. 2003;425(6):962-967.
- Park IK, Qian D, Kiel M, Becker MW, Pihalja M, Weissman IL, et al. Bmi-1 is required for maintenance of adult self-renewing haematopoietic stem cells. Nature. 2003;423(3):302-305.
- Zencak D, Lingbeek M, Kostic C, Tekaya M, Tanger E, Hornfeld D, et al. Bmi1 loss produces an increase in astroglial cells and a decrease in neural stem cell population and proliferation. J Neurosci. 2005;25(24):5774-5783.
- Leung C, Lingbeek M, Shakhova O, Liu J, Tanger E, Saremaslani P, et al. Bmi1 is essential for cerebellar development and is overexpressed in human medulloblastomas. Nature. 2004; 428(3):337-341.
- Chiba T, Miyagi S, Saraya A, Aoki R, Seki A, Morita Y, et al. The polycomb gene product BMI1 contributes to the maintenance of tumor-initiating side population cells in hepatocellular carcinoma. Cancer Res. 2008;68(19):7742-7749.
- Lu Z, Wu H, Mo YY. Regulation of bcl-2 expression by Ubc9. Exp Cell Res. 2006;312(10):1865-1875.
- Zundel W, Schindler C, Haas-Kogan D, Koong A, Kaper F, Chen E, et al. Loss of PTEN facilitates HIF-1-mediated gene expression. Genes Dev. 2000;14(7):391-396.
- Lal A, Peters H, St Croix B, Haroon ZA, Dewhirst MW, Strausberg RL, et al. Transcriptional response to hypoxia in human tumors. J Natl Cancer Inst. 2001;93(17):1337-1343.
- Jensen RL. Hypoxia in the tumorigenesis of gliomas and as a potential target for therapeutic measures. Neurosurg Focus. 2006;20(4):E24.
- Li Z, Bao S, Wu Q, Wang H, Eyler C, Sathornsumetee S, et al. Hypoxia-inducible factors regulate tumorigenic capacity of glioma stem cells. Cancer Cell. 2009;15(6):501-513.
- Phillips WP, Willson JK, Markowitz SD, Zborowska E, Zaidi NH, Liu L, et al. O6-methylguanine-DNA methyltransferase (MGMT) transfectants of a 1,3-bis(2-chloroethyl)-1-nitrosourea (BCNU)-sensitive colon cancer cell line selectively repopulate heterogenous MGMT+/MGMT- xenografts after BCNU and O6-benzylguanine plus BCNU. Cancer Res. 1997;57(21):4817-4823.
- Wedge SR, Porteous JK, Newlands ES. 3-aminobenzamide and/or O6-benzylguanine evaluated as an adjuvant to temozolomide or BCNU treatment in cell lines of variable mismatch repair status and O6-alkylguanine-DNA alkyltransferase activity. Br J Cancer. 1996;74(10):1030-1036.
- Dolan ME, Mitchell RB, Mummert C, Moschel RC, Pegg AE. Effect of O6-benzylguanine analogues on sensitivity of human tumor cells to the cytotoxic effects of alkylating agents. Cancer Res. 1991;51(13):3367-3372.
- Bobola MS, Tseng SH, Blank A, Berger MS, Silber JR. Role of O6-methylguanine-DNA methyltransferase in resistance of human brain tumor cell lines to the clinically relevant methylating agents temozolomide and streptozotocin. Clin Cancer Res. 1996;2(4):735-741.
- Wedge SR, Newlands ES. O6-benzylguanine enhances the sensitivity of a glioma xenograft with low O6-alkylguanine-DNA alkyltransferase activity to temozolomide and BCNU. Br J Cancer. 1996;73(5):1049-1052.
- Middleton MR, Margison GP. Improvement of chemotherapy efficacy by inactivation of a DNA-repair pathway. Lancet Oncol. 2003;4(1):37-44.
- Esteller M, Herman JG. Generating mutations but providing chemosensitivity: the role of O6-methylguanine DNA methyltransferase in human cancer. Oncogene. 2004;23(1):1-8.
- Chen ZP, Yarosh D, Garcia Y, Tampieri D, Mohr G, Malapetsa A, et al. Relationship between O6-methylguanine-DNA methyltransferase levels and clinical response induced by chloroethylnitrosourea therapy in glioma patients. Can J Neurol Sci. 1999;26(2):104-109.
- Hegi ME, Liu L, Herman JG, Stupp R, Wick W, Weller M, et al. Correlation of O6-methylguanine methyltransferase (MGMT) promoter methylation with clinical outcomes in glioblastoma and clinical strategies to modulate MGMT activity. J Clin Oncol. 2008;26(25):4189-4199.
- Hegi ME, Diserens AC, Gorlia T, Hamou MF, de Tribolet N, Weller M, et al. MGMT gene silencing and benefit from temozolomide in glioblastoma. N Engl J Med. 2005;352(3):997-1003.
- Oldrini B, Vaquero-Siguero N, Mu Q, Kroon P, Zhang Y,Ganga MG, et al. MGMT genomic rearrangements contribute to chemotherapy resistance in gliomas. Nat Commun. 2020;11(6):3883.
- Friedman HS, McLendon RE, Kerby T, Dugan M, Bigner SH, Henry AJ, et al. DNA mismatch repair and O6-alkylguanine-DNA alkyltransferase analysis and response to Temodal in newly diagnosed malignant glioma. J Clin Oncol. 1998;16(12):3851-3857.
- Maxwell JA, Johnson SP, McLendon RE, Lister DW, Horne KS, Rasheed A, et al. Mismatch repair deficiency does not mediate clinical resistance to temozolomide in malignant glioma. Clin Cancer Res. 2008;14(15):4859-4868.
- Cahill DP, Levine KK, Betensky RA, Codd PJ, Romany CA, Reavie LB, et al. Loss of the mismatch repair protein MSH6 in human glioblastomas is associated with tumor progression during temozolomide treatment. Clin Cancer Res. 2007;13(7):2038-2045.
- Hunter C, Smith R, Cahill DP, Stephens P, Stevens C, Teague J, et al. A hypermutation phenotype and somatic MSH6 mutations in recurrent human malignant gliomas after alkylator chemotherapy. Cancer Res. 2006;66(8):3987-3991.
- Gibson SL, Narayanan L, Hegan DC, Buermeyer AB, Liskay RM, Glazer PM. Overexpression of the DNA mismatch repair factor, PMS2, confers hypermutability and DNA damage tolerance. Cancer Lett. 2006;244(2):195-202.
Citation: Balbuena J, Castresana JS, Petriz J (2021) The Role of Side Population Cells and Hypoxia in Resistance to Chemotherapy in Astrocytoma Cell Lines. J Carcinog Mutagen. 12: 361.
Copyright: © 2021 Balbuena J, et al. This is an open-access article distributed under the terms of the Creative Commons Attribution License, which permits unrestricted use, distribution, and reproduction in any medium, provided the original author and source are credited.
