Indexed In
- Academic Journals Database
- Open J Gate
- Genamics JournalSeek
- JournalTOCs
- ResearchBible
- Ulrich's Periodicals Directory
- Electronic Journals Library
- RefSeek
- Hamdard University
- EBSCO A-Z
- OCLC- WorldCat
- Scholarsteer
- SWB online catalog
- Virtual Library of Biology (vifabio)
- Publons
- MIAR
- Geneva Foundation for Medical Education and Research
- Euro Pub
- Google Scholar
Useful Links
Share This Page
Journal Flyer

Open Access Journals
- Agri and Aquaculture
- Biochemistry
- Bioinformatics & Systems Biology
- Business & Management
- Chemistry
- Clinical Sciences
- Engineering
- Food & Nutrition
- General Science
- Genetics & Molecular Biology
- Immunology & Microbiology
- Medical Sciences
- Neuroscience & Psychology
- Nursing & Health Care
- Pharmaceutical Sciences
Research - (2021) Volume 0, Issue 0
The Potential Role of Plastome as a Biomarker and Biosensor Using Real- time Quantitative Polymerase Chain Reaction
Amita Pandey*, Shifa Chaudhary and Binu BhatReceived: 05-Oct-2021 Published: 26-Oct-2021, DOI: 10.35248/2153-0602.21.s7.004
Abstract
Plastids are semiautonomous eukaryotic organelles specific to plants performing many crucial and critical functions including photosynthesis, energy generation, development, stress perception, storage, flowering, and fruit ripening. Studies have shown that the number of chloroplast, a plastid subtype is affected by biotic and abiotic stresses and the Plastome Copy Number (PCN), circular DNA molecules present in the plastids are regulated by developmental stage and environmental stimuli. This study for the first time proposes the use of PCN as a biomarker and biosensor based on parsing real-time qPCR data obtained over a period of two years by using plastid tRNA specific primers from leaves and lint samples of cotton and seed samples of cotton, rice, soybean, maize, and sesame. PCN can be used because as opposed to nuclear DNA the PCN is modulated by both internal and external factors, this method does not require a prior knowledge of plastome sequence as the primers used are universal primers targeted to plastome of all the plant genus, the PCN is much higher than the nuclear, and PCN can be determined rapidly by qPCR assays. Analysis of mean Ct values, mean log PCN values and range of log PCN values of cotton seed and cotton raw, which are seed containing samples of cotton showed that of the samples processed and obtained from different sources over a period of two years the PCN was highly invariable within the group showing a difference of up to 4 plastomes i.e. log 0.58 between different samples, indicating a potential use of PCN as biomarker for plant genus determination. Moreover, observation of lower mean PCN (log 2.9) and higher range PCN (log 3.09) for broken dehusked rice (RS) compared to higher mean PCN (log 3.86) and lower range PCN (log 0.05) for hull covered Rice Paddy (RP), where the hull protects the rice seed during post-harvest processing and storage, suggests that PCN be an indicator of seed quality. To support our assumption that PCN can be modulated by abiotic factors rice seeds were treated with high temperature and moisture, the seeds exposed to high temperature exhibited higher mean Ct values when compared to untreated seeds, indicating a decrease in PCN. In conclusion, PCN can be potentially used as a biomarker and a biosensor.
Keywords
Plastids; Plastome; Plastome copy number; Real-time qPCR; Plant quality assessment
Introduction
Plastids are semi-autonomous organelles distinguishing plant cells from other eukaryotic cells, acquired by endosymbiosis of a photosynthetic prokaryote by a eukaryotic cell [1]. Although, Plastids such as chloroplast perform the critical function of carbon fixation and energy generation through photosynthesis, parts of metabolic pathways such as lipid biosynthesis and amino acid metabolism also occur in plastids [2,3]. Other members of the plastid family play pivotal roles in storage, coloration, gravitropism, stomatal functioning, and perception [4]. Like mitochondria, plastids are maternally inherited and therefore highly conserved between species derived initially from small, undifferentiated proplastids found in meristematic cells, which later differentiate into subtypes depending on the cell type during developmental processes such as seed germination, flowering, and ripening [5]. Additionally,plastid biogenesis and differentiation has been associated with environmental stress [6,7]. Studies in Arabidopsis showed that plastids undergo process of degradation due to high light intensity, Botrytis infection and senescence resulting in reduction of size and number of chloroplast in the leaves of Arabidopsis [8].
The plastid genome/DNA or plastome is 120-160 kbp of about 22 to 200 circular DNA copies with 100-120 highly conserved genes [9]. The plastome copy number has been shown to vary during plant development when compared to nuclear genome [10,11]. Moreover, plastid biogenesis and differentiation has been shown to be associated with plant development and environmental stress [12,13]. Chloroplast regulates their own degradation during stress condition by inducing autophagy [14]. Several studies have associated plastids with plant stress including presence of sensory plastids localized to the epidermis and vascular parenchyma,regulating retrograde signaling coordinating the expression of nuclear genes encoding organellar proteins (Fernandez and Strand, 2008), biosynthesis of phytohormones including Abscisic Acid (ABA), Jasmonic Acid (JA), Salicylic Acid (SA), which are known for their role in biotic and abiotic stresses , Reactive Oxygen Species (ROS) production, known for its role in pathogen killing, cell wall strengthening, activating defense gene expression, production and signaling of phytohormones [15-19].
Chloroplast, amyloplast and chromoplast are the most studied plastid subtypes because of their direct relevance to nutritional quality of crops. Chloroplast are the main photosynthetic plastids affecting overall quality of plant products, amyloplast store starch in roots, tubers, and seed endosperm, and chromoplast, rich in carotenoids, present in vegetables and fruits [20]. Studies have shown that the plastid and plastome copy in these plant organs can be affected by biotic and abiotic stresses during development and post-harvest storage. Drought and high temperature affect the seed filling process, affecting the final quality and quantity of seed yield. Despite the fact that dry seeds are metabolically quiescent, exposure to higher moisture and temperature can induce ROS production and lipid peroxidation damaging cellular machinery and DNA [21- 23]. Seeds are not only stored for human consumption but also for preservation of biodiversity in seed banks. Therefore, it is critical to regularly monitor seed viability and quality by seed germination activities, which is time consuming process.
Nucleic acid amplification based assays have been used for assessing seed health/quality [24,25], by detecting seed pathogens. However, these assays are not designed to assess damage caused by abiotic stresses.
This study proposes application of Plastome Copy Number (PCN) determined by of real-time Quantitative Polymerase Chain Reaction (qPCR) in plant organs including seed (with and without husk), leaf, and lint in assessing effect of biotic and abiotic stresses on seed quality/health. The technique is proposed based on previous research that plastid biogenesis and PCN are affected by plant stresses, whereas the nuclear genome ploidy is static. Samples for this study parsed the data collected over a period of two years for Genetically Modified Organism (GMO) event detection using CaMV35S promoter specific primers. Chloroplast tRNA specific primers were used for extraction control. The study calculated PCN and range of PCN for all the samples and provides evidence and explanation for observed differences and similarities between different plant organs and plants. The study also provides explanation to support use of range of PCN for monitoring quality/ health of plant based products including seeds, leaves, and lint.
Materials and Methods
Plant material
Seeds of cotton, rice, soybean, maize, sesame, and paddy and cotton plant material such as lint, raw cotton, and leaf were obtained for GMO event detection over a period of two years. Visual observation of samples was noted; rice seeds were broken and of different varieties (different colors), raw cotton was a mixture of lint and seeds, cotton leaves were green and of different sizes, and maize seeds were dried and of different varieties.
Abiotic stress experiments: Rice seeds exposed high temperature (50°C) and moisture for 5 to 6 days. DNA was isolated from 170 mg seed tissue using Qiagen kit. 20 ng of the DNA was used subsequently for real-time qPCR with chloroplast specific primers.
Extraction procedure for fiber and seeds
To 300 mg of homogenized fiber, leaves, seeds or grains added 1.5 ml of pre-warmed (65°C) CTAB extraction buffer [CTAB (20g/l), NaCl (1.4 M/l), Tris-Cl (0.1M/l), EDTA (0.2 M/l, pH 8.0] and vortex. Added α-amylase (rice seeds), RNase A, mixed gently, and incubated at 65°C for 10 minutes. Subsequently, added Proteinase K and incubated at 65°C for 30 min., thereafter spun at 14000 rpm for 10 min. Collected the supernatant and added 1 volume of chloroform and mixed thoroughly, followed by centrifugation at 14000 rpm, and collection of aqueous phase. To this added 2 volumes of CTAB precipitation buffer [CTAB (20 g/l), NaCl (0.04 M/l)] and ammonium acetate solution (leaf samples) and incubated at room temperature without agitation. After spinning at 14000 rpm discarded the supernatant and dissolved the DNA pellet in NaCl (1.2 M/l) and chloroform (1:1). Centrifuge at 14000 rpm for 10 min. and to the aqueous phase added 0.6 volume chilled isopropanol and incubated at room temperature for 20 min. Subsequently it was spun at 14000 rpm for 15 min. and discarded the supernatant, washed the pellet with 70% ethanol and suspended pellet in TE [Tris-Cl (0.01 M/l), Na2 EDTA (0.001 M/l), pH 8.0].
Extraction procedure by kit method
Procedure followed to extract DNA was essentially as mentioned in the user manual of Qiagen DNeasy Plant Mini Kit.
Reagents required for real time-qPCR assay
Premix Ex Taq master mix, SYBR Premix Ex Taq, primers and probes for CaMV35S promoter, and primers for chloroplast gene SYBR green based, ROX dye, sterile nuclease free water, Tris-EDTA (TE) buffer (Table 1).
|
CR |
CL |
Clt |
CS |
RS |
RP |
SS |
MS |
SeS |
|---|---|---|---|---|---|---|---|---|---|
Mean |
3.81 |
4.18 |
3.22 |
3.85 |
2.9 |
3.86 |
1.96 |
5.05 |
6.49 |
Range |
0.31 |
4.11 |
3.63 |
0.58 |
3.09 |
0.05 |
1.17 |
1.94 |
0.31 |
Table 1: Mean and range of primers for chloroplast gene.
Real time-quantitative Polymerase Chain Reaction (Real time-qPCR)
All the reagents are thawed, vortex briefly and centrifuged before use. A master mix contained SYBR Premix Ex Taq (2X), ROX dye (50X), Primers (10 μM), DNA (20 ng), sterile water. Certified Reference Material (CRM) was obtained included cotton (MON15985-7) and rice (LLRice62) from The American Oil Chemists Society (AOCS), which served as a positive control. Chloroplast tRNA primers were used as internal positive control (IPC) to demonstrate DNA extraction had occurred successfully.
The real-time qPCR was performed under the following conditions in Applied Biosystem 7300; 2 min at 50°C, 10 min at 95°C (Denaturation, 1 cycle), 15 sec at 95°C (Denaturation, 1 cycle), 1 min at 60°C (Annealing and Extension, 40 cycles), 95°C/15 sec, 60°C/30 sec, 5°C/15 min (Dissociation, 1 cycle). Reverse and forward primers used for chloroplast and CaMV35S promoter are as described previously [26].
Statistical analysis
Statistical analysis was performed using one-way ANOVA. ‘p’ value was calculated using ‘p’ value calculator with Fstatistic, Dfb, and Dfw values. Students TTEST was performed for pairwise analysis of abiotic stress data. A p value of<0.05 is considered to be statistically significant.
Results
For plastome analysis using real-time qPCR technique, a gradient PCR was performed to determine the optimum conditions for amplification of desired amplicon. Subsequently, a product of approximately 600 bp was observed for both cotton and rice (Supplementary Figure 1), which was confirmed by sequencing and blast to be of chloroplast tRNA (Data not shown).
Standard curves were generated for cotton CRM with chloroplast tRNA and CaMV 35S promoter specific primers for determination of PCR efficiency, slope and intercept. For chloroplast specific primers an efficiency of 127% was achieved and for 35S promoter specific primers an efficiency of 83% was achieved (Data Not Shown). R2 values of 0.99 and 0.98 were observed for chloroplast and 35S promoter specific primers, respectively (Figures 1A and 1B).
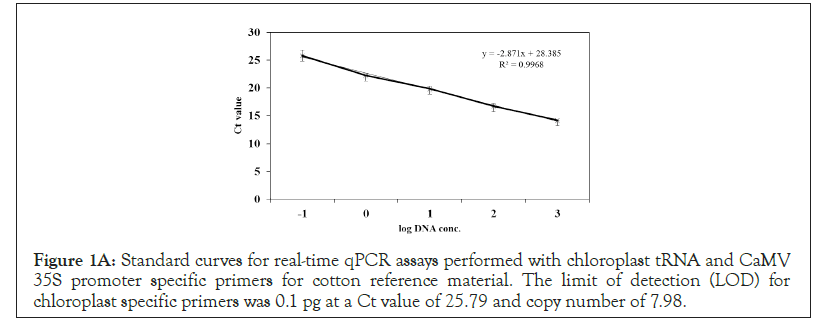
Figure 1A: Standard curves for real-time qPCR assays performed with chloroplast tRNA and CaMV 35S promoter specific primers for cotton reference material. The limit of detection (LOD) for chloroplast specific primers was 0.1 pg at a Ct value of 25.79 and copy number of 7.98.

Figure 1B: The limit of detection (LOD) for CaMV 35S specific primers was 0.1 pg at a Ct value of 37.54 and a copy number of 6.18.
Five log DNA values corresponding to 0.1 picogram (pg) (-1 log), 1 pg (0 log), 10 pg (1 log), 100 pg (2 log), and 1000 pg (3 log) of DNA concentration were used for generation of the standard curves. Real-time qPCR was performed in Applied Biosystem 7300. SYBR green and FAM probe were used for detection of chloroplast and CaMV 35S amplicons (Table 1). PCR efficiencies and R2 values were calculated from the linear equation.
The Ct value for 1 picogram for chloroplast specific primers was 25.79, whereas 35S primers exhibited a value of 37.54 (Figures 1A and 3B). The Ct values for PCR blank, which did not contain DNA was observed as undetermined and 41.87 for chloroplast and 35S promoter specific primers pairs, respectively (Data Not Shown). A slope of -2.87 and -3.84 was observed for chloroplast and 35S promoter specific primers, respectively (Figures 1A and 1B) and an intercept of 28.38 and 40.58 was observed for chloroplast and 35S promoter specific primers, respectively (Figures 1A and 1B).
Chloroplast tRNA specific primers were used for performing real-time qPCR with DNA obtained from different cotton plant organs including Cotton Seeds (CS), Cotton Leaves (CL), Cotton Lint (Clt) and Cotton Raw (CR). The mean Ct values observed for CS and CR (seed containing samples) were 13.45 and 13.61, respectively (Figure 2).
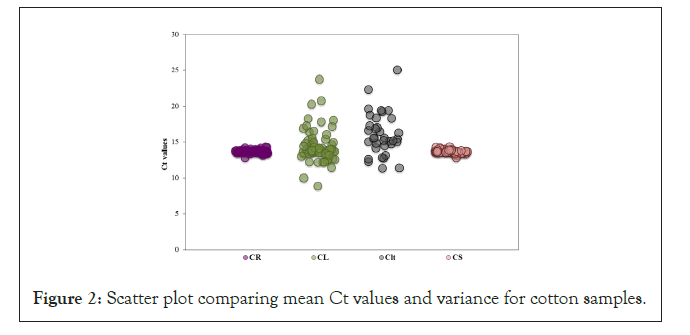
Figure 2: Scatter plot comparing mean Ct values and variance for cotton samples.
20 ng genomic DNA was used for real-time qPCR using chloroplast tRNA specific primers from different cotton organs including 78 Cotton Seed (CS), 61 Cotton Leaf (CL), 34 Cotton Lint (Clt) and 48 Cotton Raw (CR) samples. Real-time qPCR was performed in ABI 7300 real-time machine using SYBR green as fluorescent dye. One-way ANOVA analysis was performed, where a significant difference of was observed in the mean Ct values of all the groups i.e. ‘p’ value of 0.00001. CL and Clt samples exhibited high variance in Ct values when compared to CS and CR samples.
Whereas, the mean Ct value for CL and cotton Clt were observed to be 14.42 and 16.05, respectively. CS (2.47%) and CR (1.79%) showed less percent variance of Ct values, whereas a high variance was observed within the group composed of CL (18.75%) and Clt (16.7%) (Supplementary Table 1). A one-way ANOVA analysis was performed, which showed statistically significant difference (0.0001), i.e. ‘p’ values less than 0.05, between all the four cotton samples. Similarly, a significant difference (0.0001) was observed for Clt and CL (Data not shown). Whereas, no significant difference was observed between CR and CS (0.02).
The mean Ct values of different seed samples in increasing order were as follows; SeS (9.76), RP (13.42), CS (13.45), MS (13.82), RS (17.11), and SS (22.72) (Figure 3). It was also observed that RS (17.66%) and MS (12.51%) exhibited highest variation within the groups, whereas as RP exhibited lowest variance (0.86%) among all groups (Supplementary Table 1). One-way ANOVA analysis showed a significant difference (0.00001) between the mean Ct values of different seed groups.
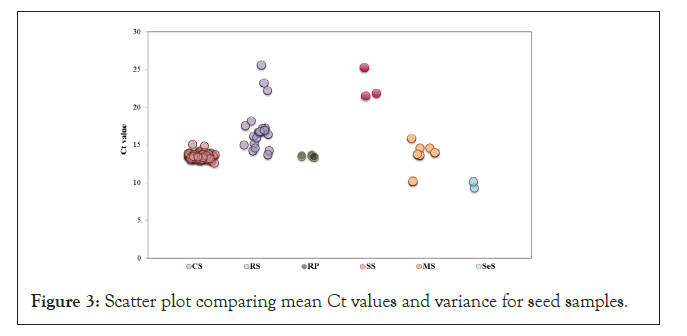
Figure 3: Scatter plot comparing mean Ct values and variance for seed samples.
The PCN was determined by using mean Ct, slope and intercept values obtained from the standard curve generated with chloroplast specific primers (Figure 1A). The observed mean log PCN values for seed samples were in the following order; SeS (6.49)>MS (5.05)>RP (3.86)>CS (3.85)>CR (3.81)>RS (2.90)>SS (1.96) (Figure 4 and Supplementary table 2). Similarly, the observed mean log PCN values for cotton plant samples were as follows; CL (4.18)>CS (3.85)>CR (3.81)>Clt (3.22) (Figure 4 and Supplementary table 2). The number of plastome copies were observed to be highest in SeS (3 million copies) and lowest in SS (90 copies) (Supplementary table 2). Moreover, comparison using one-way ANOVA analysis exhibited a statistically significant difference for the seed sample groups (0.00001) and when all groups (0.00001) were taken together.
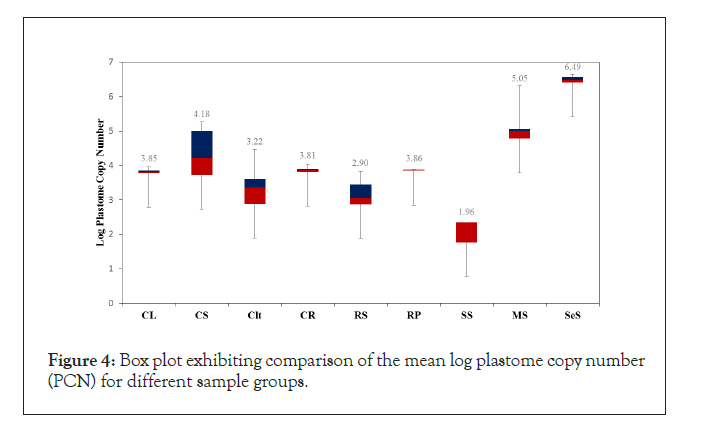
Figure 4:Box plot exhibiting comparison of the mean log plastome copy number (PCN) for different sample groups.
In order to determine the variation in PCN observed for samples of each group received over a period of 2 years, the range of PCN was calculated by generating a box plot and subtracting minimum log PCN values from maximum log PCN values for each sample group (Figure 4 and Supplementary Table 2). The range of PCN was observed to be highest for CL (4.11) followed by Clt (3.63) and RS (3.09), which is equivalent, to a variation of up to maximum of 12882.5 plastome copies. Whereas the observed range was lowest for CS (0.31,), CR (0.58), SeS (0.31) and RP (0.05) (Supplementary Table 2), which is equivalent to variation of up to a maximum of 3 plastome copies with in a group of samples processed over a period of two years.
Rice seeds were treated with high temperature (T-2) and moisture (T-1) for 5 to 6 days to assess the effect of abiotic stress on PCN. Seeds treated with HT showed an increase in mean Ct value (27.59) when compared to seeds treated with moisture (24.80) or untreated seeds (24.20) (Figure 5A). A standard curve was generated and copy number was calculated from the Ct values, slope and intercept. The copy number calculated for the three groups were as follows; UT (10043.43), T-1 (7007), and T-2 (1394.13).
During the course of evolution plastids have differentiated to perform functions other than photosynthesis and storage including stress perception and response, flowering, fruit ripening, endosperm development and root gravitropism [27].Studies have shown that the plastid number and subtype in a plant species is modulated by internal (cell type) and environmental factors such as light, temperature, and nutrition [28].Moreover, development and plant stress have been shown to affect the PCN, circular DNA present inside plastids [29]. In addition to being indispensable for plants plastid have found application in the field of synthetic biology for expression of foreign proteins [30]. Plastome has been used as biomarker for plant species identification differentiating ploidy levels studying transgene introgression and as a meta- barcoding marker for plant dietary analysis [31-35]. Plastid dynamics can be studied by isolating intact plastids via centrifugation of cell homogenates and fluorescent microcopy, however to study plastome and PCN, PCR and real-time qPCR techniques have been adopted, which are rapid and less laborious process [36,37].
This study investigated existence the potential use of a PCN in determination of plant genus/species and quality of plant material including seeds, leaves, and lint. Studying PCN dynamics was selected for this study due to two reasons; first plastid number and therefore PCN are affected by developmental stage and environmental factors when compared to the nuclear DNA ploidy levels, which remains static and secondly, the plastome is high copy number compared to the nuclear genome per cell, requiring minute amount of starting material for the assays. This study parsed the data obtained from real-time qPCR assays performed for GMO event detection using chloroplast tRNA and CaMV 35S promoter specific primers over a period of 2 years. The study proposes use of highly conserved chloroplast tRNA specific primers, which eliminates the requirement for a prior knowledge of plastome sequence for individual plant species. Based on seed data analysis the study proposes that the PCN is constant and specific to a given plant genus and therefore can be used as a biomarker. Similar data analysis of revealed that the PCN was affected by quality of seeds, lint and age of leaves, hence supporting their use as a biosensor of biotic and abiotic conditions encountered by plants and plant products during growth, processing or storage.
Discussion
Real-time qPCR assays were performed for determining the PCN in samples of cotton, cotton seed, cotton lint, cotton raw, rice, rice paddy, maize, soybean and sesame, which are important fiber, oil and food crops by amplifying an approximately 600 bp amplicon using chloroplast tRNA specific primers and confirmed by sequencing (Supplementary Figure 1, Sequencing Data Not Shown). Gossypium hirsutum L., a tetraploid with 26 chromosomes was used for standard curve generation is a GMO cotton with 35S promoter integrated into the nuclear DNA. This study shows that real-time qPCR can be used for differentiating nuclear DNA from the chloroplast DNA, based on the Ct values. Mean Ct values of 37.54 and 25.74 were observed for CaMV 35S promoter and chloroplast specific primers, respectively at LOD of one picogram DNA concentration (Figures 1A and 1B), indicating that plastome exists at a higher copy number compared to nuclear DNA. These results are supported by studies, which show that while a cell has a single nucleus, there are numerous plastids and each plastid contains many circular DNA molecules or plastomes [38]. This study provides evidence supporting the presence of many plastomes, by observation of lower Ct value and higher copy number i.e. 87000 copies in 1 ng DNA for chloroplast specific primers, compared to higher Ct values and lower copy number i.e. 66000 copies in 1 ng of DNA for 35S promoter specific primers (Figures 1A and 1B). Although, the observed PCN was higher for chloroplast, the log value difference might have been greater between nuclear and chloroplast DNA if the size of the amplicon for chloroplast (600 bp) and CaMV35S promoter (82 bp) has been more comparable, therefore for further studies a house keeping gene with similar size of amplicon can be used. The consistency of the technique and reliability of the data obtained was supported by generating standard curves, which exhibited an efficiency of 127% for chloroplast primers and 83% for CaMV 35S primers and R2 values of 0.99 and 0.98 for chloroplast and 35S specific primers, respectively (Figures 1A and 1B). Efficiency of real-time qPCR reflects that with each cycle DNA is doubled and R2 value exhibits existence of a good correlation between the x and y axes values implicating that if either one of the value (x or y) is known the other can be correctly calculated by the linear equation (Figures 1A and 1B).
Analysis of the Ct values for CS (13.45) and CR (13.61) tested over a period of two years exhibited little variance (Supplementary Table 1), as all the observed Ct values were close to the mean Ct value indicating that the plastome in seed containing samples of cotton is highly constant and tightly regulated probably because seeds are vehicles for plant propagation, ensuring continuation of species and have a protective impermeable seed coat (Figure 2),. Additionally, these results were supported by observation of a narrow range for log PCN values for CS (0.31) and CR (0.58) implicating a variation of up to only 4 plastomes between different samples processed and procured from various sources during the two year time period (Figure 5 and Supplementary Table 2). Additionally, ANOVA analysis revealed no significant difference between CS and CR mean log PCN values (‘p’ value of 0.3, Data not shown). All these observations support the use of qPCR for determining PCN and quality of seeds. Previous studies have shown that the PCN is regulated during development and DNA damage in seeds has been linked to storage under non-ambient conditions [39] therefore these results might also indicate consistent and ambient environmental conditions encountered by seeds during development particularly during seed filling stage and/or post-harvest storage or processing.
This study further analyzed the PCN in different seed sample groups by performing ANOVA analysis of the mean Ct values, CS (13.45), RS (17.11), RP (13.42), SeS (9.76), MS (13.85), SS (22.72), which revealed a significant difference (0.0001) between the six groups (Figure 3, Data not shown), indicating that the PCN is specific to a plant genus. However, to establish a firm relation between PCN and genus further seed samples have to be analyzed for RP, MS, SS and SeS. Similarly, ANOVA analysis revealed a significant difference (0.0001) for the mean log PCN values for different seed samples including cotton (3.85), rice (2.9), paddy (3.86), soybean (1.96), maize (5.05) and sesame (6.49) (Figure 4). Our rationale of using qPCR and PCN as a biomarker for genus identification is further supported by the observations, where the oil producing seeds including MS and SeS exhibited higher mean log PCN values when compared to non-oil seeds (Figure 4, Supplementary Table 2). Studies have shown that triacylglycerols (TAGs), the major storage form of seed oil are synthesized and stored in plastids [40].
Analysis of the mean Ct values for RS (17.11) and RP (13.42) showed significant differences (0.0001) (Figure 3), where RS (17.66) showed higher percent variance when compared to RP (0.86) (Supplementary Table 1), similarly, the range of log PCN was different for RS (3.09) and RP (0.05) (Supplementary Table 2), indicating very less difference in PCN for RP than for RS (Figure 3).
Equal amount (20 ng) of genomic DNA from 78 Cotton Seed (CS), 20 Rice Seed (RS), 3 Soybean Seed (SS), 7 Maize Seed (MS), 2 Sesame Seed (SeS) and 3 Rice Paddy (RP) samples was used for real- time qPCR using chloroplast tRNA specific primers. Plot showing a mean Cycle Threshold (Ct) value was generated. Real-time qPCR was performed in ABI 7300 real time machine using SYBR green as fluorescent dye to detect amplification. One-way ANOVA analysis was performed, where a significant difference of was observed in the mean Ct values of all the seed groups i.e. ‘p’ value of 0.00001. Highest variance in the Ct values was observed for RS samples.
These differences in the mean Ct, log PCN and range PCN were explained by visual examination of RS samples, which were composed of broken grains, whereas grains were covered with a protective hull in the RP samples, indicating that post-harvest processing of the grains can compromise the grain quality (Figure 4).
Cotton seed (CS), cotton leaf (CL), cotton lint (Clt), cotton raw (CR), rice seed (RS), rice paddy (RP), maize seed (MS), soybean seed (SS), sesame seed (SeS) mean log PCN value was calculated from Ct values using the formula, copy number (CN) = 10(Ct- Intercept)/(Slope). Blue and red boxes represent the samples above and below the mean log PCN value. A statistically significant difference (0.0001) was observed between different sample groups calculated by performing on-way ANOVA analysis. To determine variance within a sample group, log range PCN was calculated, which revealed that maximum variance was observed for CL and Clt sample groups.
These results support the use of qPCR and PCN as an indicator of seed quality, which has been shown to be affected by various biotic and abiotic stresses during growth and storage [41,42].
The hypothesis that PCN determined by qPCR can be used as a tool for assessment of plant product quality was further supported by analysis of mean log Ct and PCN values for CL (14.36, 4.18) and Clt (15.68, 3.22) sample groups. The Ct values showed high variance from the mean Ct values for CL (18.75%) and Clt (16.7%), similarly, the two groups also exhibited highest log range PCN values, CL (4.11) and Clt (3.63) of all the sample groups analyzed. These variations in PCN values could be supported by visual examination of samples, where leaf samples processed over a period of two years were of different sizes and lint (single celled trichome) of different sizes. Previous studies have also shown that plastome is affected by various internal and external factors [43,44].
To provide experimental support for use of PCN as indicator of genus and quality, rice seeds were exposed to abiotic stresses including high moisture (T-1) and temperature (T-2) [45-47]. The results obtained showed that abiotic stresses can affect the PCN, a statistically increase in mean Ct value for rice seeds treated with high temperature (28.38) was observed when compared to untreated (24.71) and moisture treated seeds (25.99) (Figure 5A).
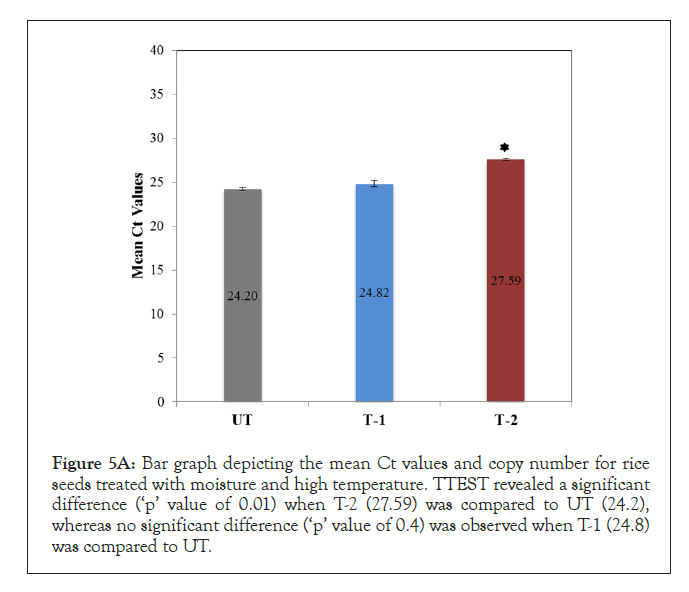
Figure 5A: Bar graph depicting the mean Ct values and copy number for rice seeds treated with moisture and high temperature. TTEST revealed a significant difference (‘p’ value of 0.01) when T-2 (27.59) was compared to UT (24.2), whereas no significant difference (‘p’ value of 0.4) was observed when T-1 (24.8) was compared to UT.
DNA was isolated from rice seeds were treated with moisture (T- 1), high temperature (T-2) and stored at room temperature under normal humidity (UT). Real-time qPCR was performed using 20 ng DNA using chloroplast specific primers in ABI 7300 machine. SYBR green was used as fluorescent dye for detecting amplification.
A standard curve was generated and copy number was calculated based on the Ct values, slope and intercept (Supplementary Figure 2) [48-55]. The copy number was found to be decrease at high temperature treatment when compared to untreated seeds (Figure 5B). These preliminary experiments indicated that seeds when stored under non-ambient conditions undergo a change in PCN.
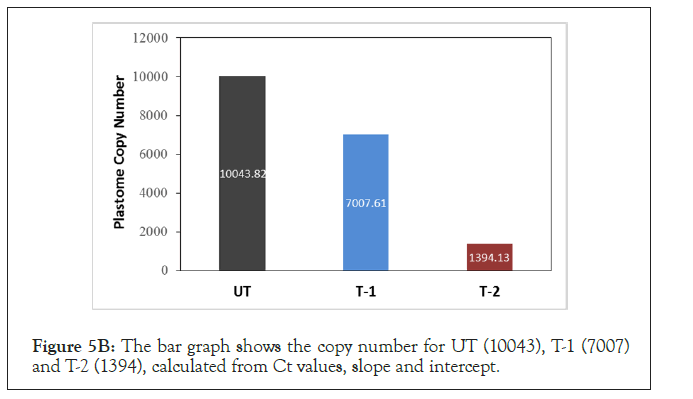
Figure 5B:The bar graph shows the copy number for UT (10043), T-1 (7007) and T-2 (1394), calculated from Ct values, slope and intercept.
Conclusion
Based on data analysis and preliminary experiments it can be concluded that real-time qPCR can be used for determining the PCN, which can be subsequently used for assessing quality of plant products such as seeds, acting as a biosensor. Analysis of PCN dynamics can be further used for genus identification, thereby acting as a biomarker. The range of log PCN can be used as an indicator of conditions under which plant products have been stored after harvesting. This method can possibly find industrial application in determining the quality of commercially available oil seeds, herbs (parsley, tea, coffee), carotenoid rich eggs and cereals to name a few plant-based food product. This study further proposes use of qPCR in metabolic engineering in plastids for determining the copy number of transgene and regulating conditions required for maintaining optimum PCN and plastid number in a plant organs for optimum production of valuable metabolites and proteins. Additionally, this method can be used for monitoring viability of seeds in seed bank replacing the laborious process of seed germination to monitor viability.
Funding
Not applicable.
Conflicts of Interest
None reported.
Ethics Approval
Not required.
Consent of Participate
p>All others have contributed to the manuscript preparation.Consent of Publication
All authors have read and approved manuscript.
REFERENCES
- Gray MW.The endosymbiont hypothesis revisited. International Review of Cytology. 1992; 141:233-357.
- Galili G. Regulation of lysine and threonine synthesis. The Plant Cell. 1995;7: 899-906.
- Ohlrogge J, Browse J. Lipid biosynthesis. The Plant Cell. 1995; 7: 957-970.
- Rolland N, Bouchnak I, Moyet L, Salvi D, Kuntz M. The main functions of plastids. Methods Mol. Biol. 2018;1829: 73-85.
- Waters M, Pyke K. Plastid development and differentiation. In: Møller SG, ed. Plastids. Oxford, UK: Blackwell .2004;4: 30-59.
- Fernández AP, Strand A. Retrograde signaling and plant stress: plastid signals initiate cellular stress responses. Curr Opin Plant Biol. 2008; 11(5): 509-13.
- Jarvis P, López-Juez E. Biogenesis and homeostasis of chloroplasts and other plastids. Nat Rev Mol Cell Biol. 2013;14(12): 787-802.
- Zechmann B. Ultrastructure of plastids serves as reliable abiotic and biotic stress marker. PLoS One. 2019;14(4): e0214811.
- Renner O. Die pflanzlichen plastiden als selbstandige elemente der genetischen konstitution. Ber. math.-phys. Klasse S€achs. Akad. Wiss. Leipzig. 1934;86: 241-266.
- Oldenburg DJ, Bendich AJ. DNA maintenance in plastids of plants. Plant Sci Front. 2015; 6: 883.
- Greiner S, Golczyk H, Malinova I, Pellizzer T, Bock R, Börner T, Herrmann RG. Chloroplast nucleoids are highly dynamic in ploidy, number, and structure during angiosperm leaf development. Plant J. 2020; 102(4): 730-746.
- Inaba T, Ito-Inaba Y. Versatile roles of plastids in plant growth and development. Plant Cell Physiol. 2010;51(11): 1847-1853.
- Sadali NM, Sowden RG, Ling Q, Jarvis RP. Differentiation of chromoplasts and other plastids in plants. Plant Cell Rep. 2019; 38(7): 803-818.
- Woodson JD. Chloroplast stress signals: regulation of cellular degradation and chloroplast turnover. Curr Opin Plant Biol. 2019; 52: 30-37.
- Beltrán J, Wamboldt Y, Sanchez R, LaBrant EW, Kundariya H, Virdi KS, et al. Specialized Plastids Trigger Tissue-Specific Signaling for Systemic Stress Response in Plants. Plant Physiol. 2018;178(2): 672-683.
- Rekhter D, Lüdke D, Ding Y, Feussner K, Zienkiewicz K, Lipka V,et al. Isochorismate-derived biosynthesis of the plant stress hormone salicylic acid. Science. 2019; 365(6452): 498-502.
- León J. Role of plant peroxisomes in the production of jasmonic acid-based signals. Subcell Biochem. 2013;69: 299-313.
- Seo M, Koshiba T. Complex regulation of ABA biosynthesis in plants. Trends Plant Sci. 2002;7(1): 41-48.
- Lu Y, Yao J. Chloroplasts at of the crossroad photosynthesis, pathogen infection and plant defense. Int J Mol Sci. 2018;19(12): 3900.
- Price CA, Hadjeb N, Newman LA, Reardon EM. Chromoplasts. Methods Cell Biol. 1995; 50: 189-207.
- McDonald MB. Seed deterioration: Physiology, repair and assessment. Seed Sci. Technol. 1999;27: 177-237.
- Kurek K, Plitta-Michalak B, Ratajczak E. Reactive Oxygen Species as Potential Drivers of the Seed Aging Process. Plants (Basel). 2019; 8(6): 174.
- Waterworth WM, Bray CM, West CE. The importance of safeguarding genome integrity in germination and seed longevity. J Exp Bot. 2015; 66(12): 3549-3558.
- Thierry M, Chatet A, Fournier E, Tharreau D, Ioos R. A PCR, qPCR, and LAMP Toolkit for the Detection of the Wheat Blast Pathogen in Seeds. Plants (Basel). 2020; 9(2): 277.
- Kamber T, Malpica-López N, Messmer MM, Oberhänsli T, Arncken C, Alkemade JA, et al. A qPCR Assay for the Fast Detection and Quantification of Colletotrichum lupini. Plants (Basel). 2021; 10(8): 1548.
- Taberlet P, Gielly L, Pautou G, Bouvet J. Universal primers for amplification of three noncoding regions of chloroplast DNA. Plant Mol. Biol. 1991;17: 1105-1109.
- Pyke KA, Page AM. Plastid ontogeny during petal development in Arabidopsis. Plant Physiol. 1998; 116(2): 797-803.
- Solymosi K, Lethin J, Aronsson H. Diversity and Plasticity of Plastids in Land Plants. Methods Mol Biol. 2018; 1829: 55-72.
- Sakamoto W, Takami T. Chloroplast DNA Dynamics: Copy Number, Quality Control and Degradation. Plant and Cell Physiology. 2018; 59(6): 1120-1127.
- Jensen PE, Scharff LB. Engineering of plastids to optimize the production of high-value metabolites and proteins. Curr Opin Biotechnol. 2019;59: 8-15.
- Magdy M, Ou L, Yu H, Chen R, Zhou Y, Hassan H,et al. Pan-plastome approach empowers the assessment of genetic variation in cultivated Capsicum species. Hortic Res. 2019; 6(1): 108.
- Li W, Liu Y, Yang Y, Xie X, Lu Y Yang Z, et al. Interspecific chloroplast, genome sequence diversity and genomic resources in Diospyros. BMC Plant Biol.2018;18(1): 210.
- Gulsen O, Ceylan A. Elucidating polyploidization of bermuda grasses as assessed by organelle and nuclear DNA markers. OMICS. 2011; 15(12):903-912.
- Woo H-J, Lim M-H, Shin K-S, Martins B, Lee B-K, Cho H-S, Mallory-Smith CA. Development of a chloroplast DNA marker for monitoring of transgene introgression in Brassica napus L. Biotechnol Lett. 2013;35(9): 1533-1539.
- Mallott EK, Garber PA, Malhi RS. trnL outperforms rbcL as a DNA metabarcoding marker when compared with the observed plant component of the diet of wild white-faced capuchins (Cebus capucinus, Primates). PLoS One. 2018;13(6): e0199556.
- Miflin BJ, Beevers H. Isolation of Intact Plastids from a Range of Plant Tissues. Plant Physiol. 1974;53(6):870-874.
- Sakamoto W, Takami T. Chloroplast DNA dynamics: copy number, quality control and degradation. Plant and Cell Physiology. 2018;59: 1120-1127.
- Martin W, Rujan T, Richly E, Hansen A, Cornelsen S, Lins T,et al. Evolutionary analysis of arabidopsis, cyanobacterial, and chloroplast genomes reveals plastid phylogeny and thousands of cyanobacterial genes in the nucleus. Proc Natl Acad Sci USA 2002;99(19): 12246-12251.
- Zoschke R, Liere K, Börner T. From seedling to mature plant: Arabidopsis plastidial genome copy number, RNA accumulation and transcription are differentially regulated during leaf development. Plant J. 2007; 50: 710-722.
- Li N, Meng H, Li S, Zhang Z, Zhao X, Wang S, et al. Two Plastid Fatty Acid Exporters Contribute to Seed Oil Accumulation in Arabidopsis. Plant Physiol. 2020;182(4): 1910-1919.
- Wang W, He A, Peng S, Huang J, Cui K, Nie L. The Effect of storage condition and duration on the deterioration of primed rice seeds. Front Plant Sci. 2018;9 : 172.
- Wijewardana C, Reddy KR, Krutz LJ, Gao W, Bellaloui N. Drought stress has transgenerational effects on soybean seed germination and seedling vigor. PLoS One. 2019; 14(9): e0214977.
- Baumgartner BJ, Rapp JC, Mullet JE. Plastid transcription activity and DNA copy number increase early in barley chloroplast development. Plant Physiol. 1989; 89(3): 1011-1018.
- de Vries J, Archibald JM. Plastid genomes Current Biology. 2018;28(1): R329-R341.
- Figlioli F, Sorrentino MC, Memoli V, Arena C, Maisto G, Giordano S, et al. Overall plant responses to Cd and Pb metal stress in maize: Growth pattern, ultrastructure, and photosynthetic activity. Environ Sci Pollut Res Int. 2019; 26(2): 1781-1790.
- Dupont FM. Metabolic pathways of the wheat (Triticum aestivum) endosperm amyloplast revealed by proteomics. BMC Plant Biol. 2008; 8:39.
- Grigorova B, Vassileva A, Klimchuk D, Vaseva I, Demirevska K, Feller U. Drought, high temperature, and their combination affect ultrastructure of chloroplasts and mitochondria in wheat (Triticum aestivum L.) leaves. Journal of Plant Interactions. 2012 ;7(3):204-213.
- Kawano SS, Tano, Kuroiwa T. Preferential digestion of chloroplast nuclei (nucleoids) during senescence of the coleoptile of Oryza sativa. Protoplasma. 1989;152: 65-68.
- López-Juez E. Plastid biogenesis, between light and shadows. Journal of Experimental Botany. 2007; 58(1): 11-26.
- Marano MR, Serra EC,Orellano EG, Carrillo N. The path of chromoplast development in fruits and flowers. Plant Sci. 1993; 94:1-17.
- Mellor SB, Behrendorff JBYH, Nielsen AZ, Jensen PE, Pribil M. Non-photosynthetic plastids as hosts for metabolic engineering. Essays Biochem. 2018; 62(1):41-50.
- Nguyen TP, Cueff G, Hegedus DD, Rajjou L, Bentsink L. A role for seed storage proteins in Arabidopsis seed longevity. J Exp Bot. 2015;66(20): 6399-6413.
- Pervaiz T, Sun X, Zhang Y, Tao R, Zhang J, Fang J. Association between Chloroplast and Mitochondrial DNA sequences in Chinese Prunus genotypes (Prunus persica, Prunus domestica, and Prunus avium). BMC Plant Biol. 2015 ;15: 14.
- Su S-H, Gibbs NM, Jancewicz AL, Masson PH. Molecular Mechanisms of Root Gravitropism. Current Biology. 2017; 27: R964-R972.
- Thomson WW, Whatley JM. Development of non-green plastids. Annual Review of Plant Physiology. 1980; 31: 375-394.
Citation: Pandey A, Chaudhary S, Bhat B (2021) The Potential Role of Plastome as a Biomarker and Biosensor Using Real-time Quantitative Polymerase Chain Reaction. J Data Mining Genomics Proteomics.S7:004.
Copyright: © 2021 Pandey A, et al. This is an open-access article distributed under the terms of the Creative Commons Attribution License, which permits unrestricted use, distribution, and reproduction in any medium, provided the original author and source are credited.
