Indexed In
- Genamics JournalSeek
- Academic Keys
- JournalTOCs
- China National Knowledge Infrastructure (CNKI)
- Access to Global Online Research in Agriculture (AGORA)
- Centre for Agriculture and Biosciences International (CABI)
- RefSeek
- Directory of Research Journal Indexing (DRJI)
- Hamdard University
- EBSCO A-Z
- OCLC- WorldCat
- Scholarsteer
- SWB online catalog
- Publons
- Euro Pub
- Google Scholar
Useful Links
Share This Page
Journal Flyer

Open Access Journals
- Agri and Aquaculture
- Biochemistry
- Bioinformatics & Systems Biology
- Business & Management
- Chemistry
- Clinical Sciences
- Engineering
- Food & Nutrition
- General Science
- Genetics & Molecular Biology
- Immunology & Microbiology
- Medical Sciences
- Neuroscience & Psychology
- Nursing & Health Care
- Pharmaceutical Sciences
Research Article - (2020) Volume 11, Issue 10
The Effect of Blending Ratio on Rehological Property of Wheat Based Composites Dough
Solomon Duguma Urigacha*Received: 19-Oct-2020 Published: 31-Oct-2020, DOI: 10.35248/2157-7110.20.11.847
Abstract
This study was conducted to determine the effect of wheat, soybean, and tef flour blending ratio on the rheological property of wheat-based composites dough. The experiment was conducted using a custom design. The corresponding proportion of wheat from 70% to 90%, soybean 5% to 15%, and tef 5% to 15% were taken from a similar study, and using wheat (100%) flour bread as a control. Supplementing soybean and tef to wheat increased Dough Development Time (DDT), dough Stability Time (ST), Time to Breakdown (TB), Farinograph Quality Number (FQN), of the blended dough and decreased Water Absorption (WAS) and Mixing Tolerance Index (MTI). Maximum WAS was obtained at control bread. DDT and ST were optimum at 70% wheat, 15% soybean and 15% tef, and 75% wheat, 15% soybean, and 10% tef, respectively. High values of TB (18.00 min) and FQN (180.00 FU) were obtained at the levels of wheat 70%, soybean 15%, and tef 15%. In general, the proportion of wheat from 80% to 85%, soybean from 5% to 10%, and tef from 5% to 10% were found optimum for the rheological property of wheat-based composite dough.
Keywords
Blending ratio; Dough; Farinograph; Rheological property
Introduction
Bread is one of the major products of baked foods and is consumed worldwide [1]. Bread products and production techniques vary from country to country. Basic ingredients are wheat flour, water, yeast, and salt [2,3]. Other ingredients that may be added include flours of other cereals, legumes, fat, malt flour, yeast foods, emulsifiers, milk and milk products, fruit, and gluten [3]. With appropriate process optimization, breads with acceptable quality can be made with the addition of nontraditional ingredients [4].
In bread making, the physical properties of the dough determine the quality of the finished product. The procedure in which wheat flour, salt, yeast, and bread additives are treated to produce a homogeneous mixture is called dough mixing. Gluten is the main factor defining dough rheology, and since the dough mixing stage influences gluten development, it is thus a component of the chief factor in dough formation. Dough development during mixing is the phase of the bread-making process where gluten functionality is critical. The dough mixing process in bread making has the further important objective of physically developing the gluten proteins into a coherent three-dimensional structure that will impart to the dough the desired degree of plasticity, elasticity, and viscosity. As mixing proceeds, the initial incoherent dough mass develops viscoelastic properties [2]. It is an important factor in bread making that dough temperature should be kept under control during dough mixing.
Wheat is a good source of calories and other nutrients but its protein is of lower nutritional quality than milk, soy, pea and lupin proteins as its protein is deficient in essential amino acids such as lysine and threonine [5]. It is known that legumes contribute significantly the protein, mineral and B-complex vitamin needs of people in developing countries. Soybean (Glycine max) is a source of high-quality cheap protein that is often used to improve protein quantity and quality of most cereals and starch-based foods. Its use in the production of bread as composite flour has been reported [6]. The principal use of tef grain for human food is the Ethiopian bread (injera). Injera is a major staple food and provides approximately two-thirds of the diet in Ethiopia [7]. Even, the reported high iron content of tef injera has been refuted by some workers, the lack of anemia in Ethiopia was implicated due to the available iron from injera [8]. Several studies about the influence of the addition of cereal flours such as sorghum, maize, and barley, as well as rich lysine legumes to wheat flours on the physicochemical properties of wheat bread dough and the quality of its final products have been reported in the last three decades [9]. In this research, an attempt was made to study rheological property of cereal-legume composite dough.
Materials and Methods
Experimental site
These experiments were done at Wolkite University College of Engineering and Technology in the Food Process Engineering Laboratory.
Experimental design
In this study, the effect of the blending ratio on rheological properties of wheat-based composite dough was studied using the custom design. The blending ratio of wheat were ranged from 70% to 90% whereas tef and soybean from 5% to 15%. The constraints proportions are decided based on a previous study [10-12] where the percentage of wheat, and tef, and soybean ranged from 80% to 100% and 0% to 20%, respectively. 100% wheat flour dough was used as a control in this study. The formulations had 12 runs and it was done in three replications.
To get the formulation JMP version 8 was used as shown in Table 1.
| Run | Wheat | Soybean | Tef | Response |
|---|---|---|---|---|
| 1 | 0.80 | 0.15 | 0.05 | - |
| 2 | 0.80 | 0.10 | 0.10 | - |
| 3 | 0.70 | 0.15 | 0.15 | - |
| 4 | 0.80 | 0.05 | 0.15 | - |
| 5 | 0.75 | 0.15 | 0.10 | - |
| 6 | 0.75 | 0.10 | 0.15 | - |
| 7 | 0.85 | 0.05 | 0.10 | - |
| 8 | 0.85 | 0.10 | 0.05 | - |
| 9 | 0.70 | 0.15 | 0.15 | - |
| 10 | 0.80 | 0.15 | 0.05 | - |
| 11 | 0.80 | 0.05 | 0.15 | - |
| 12 | 0.90 | 0.05 | 0.05 | - |
Table 1: Experimental design.
Mixture model has no constant term β0 (intercept) and squared terms β11X12. In building the model, a regression equation is established to describe the relationship between the response y and the variables X. Second-order model was generated for the three mixture components as follows.
Y=β1X1+β2X2+β3X3+β12X1X2+β13X1X3+β23X2X3
Where Y is predicted response; β1, β2, and β3 are linear coefficients; β12, β13, and β23 are the cross product (interaction) coefficients; X1, X2, and X3 are independent variables.
Raw materials collection
The materials for the investigation, bread wheat (Digalo variety), and tef (Quncho variety) were collected from Debre Zeit Agricultural Research Center and the soybean (Afgat variety) from Awassa Agricultural Research Center. All the samples were cleaned manually to remove foreign matters, immature and damaged seeds.
Milling and flour production
Cleaned wheat and tef grain were milled into flour using cottage commercial grain mill. Following milling, the flour was sifted to pass through 710 μm test sieve [13], sealed in plastic bags, and stored at dry and darkroom temperature until the experiment was conducted.
The soybean was cleaned/sorted for physical impurities. The soybean was blanched in a boiling water bath (95°C) for 20 minutes to arrest the lipoxygenase enzyme [14,15] and dried at (100-120)°C for 3-4 hours in an oven [14]. Then the soybeans were roasted until light brown to inactivate/reduce the antinutritional factor and to remove seed coats (decorticate) using a commercial mill. The decorticated beans were manually winnowed to separate the hulls and milled to flour using a commercial mill. The flour was sifted to pass through a 710 μm test sieve, sealed in plastic bags, and stored at dry and darkroom temperature until analysis.
Rheological analysis
Dough strength was measured by Farinogragh according to [16] method No. 54-21 of constant dough weight method at (30 ± 0.2)°C using a 300 g mixing bowl, operating at 63 rpm. Farinogragh values: Water Absorption (WAS in %), Dough Development Time (DDT in min), Stability Time (ST in min), Mixing Tolerance Index (MTI in FU) and Time to Breakdown (TB in min) was evaluated by AACC method using the Farinogram software (Brabander ® Farinogragh version: 2.3.6, 1996-2005, Microsoft Corporation).
Statistical analysis
At least a triplicate data was analyzed and modeled using the statistical software JMP™ 8, 2008 (by SAS Institute Inc., Cary, NC, USA). A polynomial equation was fitted to the data to obtain a regression equation. Statistical significance terms in the models were identified. Data obtained were analyzed through Analysis of Variance (ANOVA), using the General Linear Models Procedure (GLM) [17] and the Least Significant Difference (LSD) were calculated on SAS package. Significance was judged if the probability level of the F-statistic calculated from the data was less than 0.05.
Results and Discussions
Rheological properties of dough
Rheological properties of the dough depending on the quantity and quality of the gluten protein fraction. This is because a certain quantity and quality of gluten proteins must be present for flour to form the sufficiently cohesive dough to trap the gas produced during the fermentation process [18]. The rheological behaviors were evaluated by using Brabender Farinograph in terms of Water Absorption (WAS) (%), Dough Development Time (DDT) (min), Dough Stability (ST) (min), Mixing Tolerance Index (MTI) (FU), Time to Breakdown (TB) (min) and Farinograph Quality Number (FQN) of composite flour dough’s samples.
Water absorption (WAS%): Water absorption is the point chosen by the baking industry which represents a target water-to-flour ratio in bread dough. It is important to determine taste and texture of bread and dough performance during proofing and baking. The water absorption data of the blend bread are shown in (Table 2). Blending of wheat, soybean and tef had a significant (p<0.05) effect on the water absorption of the blend flour. Highest value (57.66%) was obtained when 80% wheat, 10% soybean and 10% tef were blended at 30°C. The lower value (56.33%) was obtained when 70% wheat, 15% soybean and 15% tef were blended at 30°C. This decrease might be because of reduced level of gluten in the blend. The results indicated that addition of tef flour caused non-significant increase in water absorption. Several studies also reported that the dough made from composite flour absorbed more water than that made from wheat flour alone [19,20]. The absorption of more water during mixing is a typical characteristic of composite starches [21].
| Run | w | s | t | WAS (%) | DDT (min) | ST (min) | MTI (Fu) | TB (min) | FQN |
|---|---|---|---|---|---|---|---|---|---|
| 1 | 0.80 | 0.15 | 0.05 | 57.53 ± 0.05ab | 11.10 ± 0.26d | 6.70 ± 0.10c | 29.00 ± 0.50k | 16.80 ± 0.20b | 168.00 ± 2.00b |
| 2 | 0.80 | 0.10 | 0.10 | 57.66 ± 0.25ab | 10.06 ± 0.30e | 5.70 ± 0.20d | 44.50 ± 0.50i | 13.23 ± 0.25d | 132.33 ± 2.51d |
| 3 | 0.70 | 0.15 | 0.15 | 56.33 ± 0.91e | 14.30 ± 0.30a | 10.53 ± 0.49b | 45.00 ± 0.00i | 18.00 ± 0.00a | 180.00 ± 0.00a |
| 4 | 0.80 | 0.05 | 0.15 | 57.20 ± 0.34bcd | 7.96 ± 0.15g | 3.93 ± 0.05g | 70.33 ± 0.28c | 9.73 ± 0.11f | 98.00 ± 0.00f |
| 5 | 0.75 | 0.15 | 0.10 | 57.40 ± 0.17bc | 13.66 ± 0.15b | 12.76 ± 0.32a | 47.00 ± 0.20h | 16.56 ± 0.38b | 165.66 ± 3.78b |
| 6 | 0.75 | 0.10 | 0.15 | 57.30 ± 0.00bcd | 10.33 ± 0.05e | 7.00 ± 0.00c | 51.50 ± 0.50f | 12.80 ± 0.30e | 128.00 ± 3.00e |
| 7 | 0.85 | 0.05 | 0.10 | 57.13 ± 0.23bcd | 7.20 ± 0.00h | 3.00 ± 0.00i | 74.00 ± 0.00b | 8.76 ± 0.05g | 87.66 ± 0.57h |
| 8 | 0.85 | 0.10 | 0.05 | 57.00 ± 0.69bcde | 10.23 ± 0.05e | 5.13 ± 0.05e | 40.00 ± 0.00j | 13.73 ± 0.25c | 137.33 ± 2.52c |
| 9 | 0.70 | 0.15 | 0.15 | 56.76 ± 0.11cde | 11.33 ± 0.15d | 2.86 ± 0.05i | 47.83 ± 0.29g | 14.10 ± 0.10c | 141.00 ± 1.00c |
| 10 | 0.80 | 0.15 | 0.05 | 57.10 ± 0.69bcd | 12.46 ± 0.41c | 4.70 ± 0.00f | 26.00 ± 0.00l | 17.86 ± 0.11a | 178.66 ± 1.15a |
| 11 | 0.80 | 0.05 | 0.15 | 57.20 ± 0.10bcd | 8.43 ± 0.11f | 3.36 ± 0.21h | 77.83 ± 0.29a | 9.40 ± 0.30f | 94.00 ± 3.00g |
| 12 | 0.90 | 0.05 | 0.05 | 56.60 ± 0.52de | 8.03 ± 0.15g | 3.73 ± 0.06g | 55.50 ± 0.50e | 12.73 ± 0.15e | 127.33 ± 1.52e |
| Control | 1 | 0 | 0 | 58.20 ± 0.10a | 6.73 ± 0.30i | 2.73 ± 0.15i | 57.00 ± 1.00d | 8.40 ± 0.40g | 84.00 ± 4.00h |
| Mean | 57.18 ± 0.58 | 10.14 ± 2.35 | 5.55 ± 2.97 | 51.19 ± 15.42 | 13.24 ± 3.32 | 132.46 ± 33.21 | |||
| Range | 56.33-58.20 | 6.73-14.30 | 2.73-12.76 | 26.00-77.83 | 8.40-18.00 | 84.00-180.00 |
Values are in Mean ± SD. Means within a column with the same letter are not significantly different (p>0.05) (a>b>c…..k>l). w, s and t are fractions of wheat, Soybean and tef, respectively
Table 2: Farinograph characteristics of the blended flours.
The combined effect of wheat, soybean, and tef had a significant (p<0.05) effect on the water absorption of the blended bread. All liner terms (except wheat flour dough) had an insignificant effect on the water absorption of the blend bread. The interaction terms (W*S) and (S*t) had non-significant (p>0.05) effect on water absorption of the blend bread, except the interaction term of wheat and soybean had a significant (p<0.05) effect on the water absorption, which significantly increased the water absorption of the blend bread. The following model was developed to predict the water absorption content of the blend flours as shown (Figure 1).
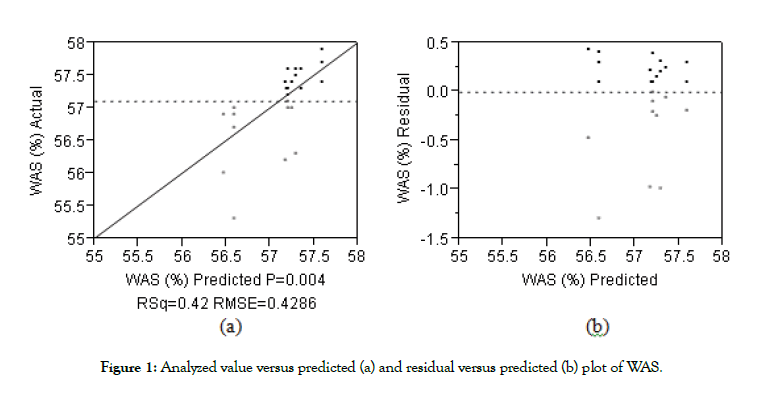
Figure 1: Analyzed value versus predicted (a) and residual versus predicted (b) plot of WAS.
WAS=53.22W-25.38S-65.58t+117.47(W*S)+164.13(W*t)+138.52( S*t) (R2=0.42)
Where WAS is predicted water absorption (%); W: Wheat (%); S: Soybean (%); t: Tef (%),
Dough Development Time (DDT): Development time is the time from the first addition of water to the time the dough reaches the point of greatest torque. During this phase of mixing, the water hydrates the flour components and the dough is developed. Blending of wheat, soybean and tef had a significant (p<0.05) effect on the dough development time of the blend flour (Table 2). Longest time (14.30 min) was obtained when 70% wheat, 15% soybean and 15% tef were blended at 30°C. The longest DDT for this blend could be due to the lowest fraction of wheat flour in the blend which resulted in the lowest gluten content which absorbs the water. Furthermore, the highest proportion of soybean (15%) has resulted in the long DDT, as shown in the data, probably because of the high fat and fiber content which interferes with water absorption. Dough development time increases with the increase in the proteolytic degradation of protein [22]. This is also may be due to decrease in their gluten contents and weakening of protein network due to proteolytic activity of composite flours. The shortest time (period) (6.73 min) was obtained at 100% wheat (the control). The lowest value of dough development time was recorded for wheat dough with the highest gluten (Figure 2).
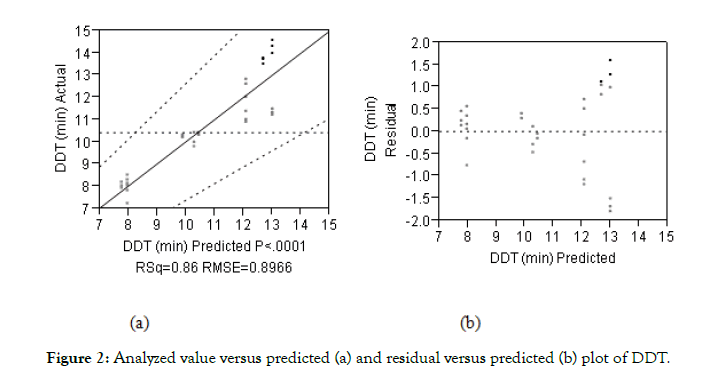
Figure 2: Analyzed value versus predicted (a) and residual versus predicted (b) plot of DDT.
The combination of wheat, soybean and tef had significant (p<0.0001) effect on dough development time of the blend flour. The linear terms of wheat (p<0.05) had significant effect on the blend. However, the liner terms of soybean and tef showed insignificant (p>0.05) effect on the dough development time. All the interaction terms had no significant (p>0.05) effect on the amount of dough development time in the blend. The following model was developed to predict dough development time.
DDT=5.42W+54.91S-34.48t-12.31(W*S)+47.68(W*t)+108.37(S*t) (R2=0.86)
Where DDT is Predicted dough development time (min); W: Wheat (%); S: Soybean (%); t: Tef (%)
Dough Stability Time (ST): Dough stability time is the time in minutes during which the curve remains on 500 BU line. The stability time is the gluten quality parameters which describe the visco-elastic properties of formed gluten complex. There were significant differences (p<0.05) in the dough stability time of the composite flours (Table 2). The longest (12.76 min.) was observed for the blend of 75% wheat, 15% soybean and 10% tef and the shortest (2.73 min.) was observed for control flour (100% wheat). The long ST values are associated with the relatively low starch (70% and 75%) and high soybean (10% and 15%) contents. Likewise, the short ST values correspond to blends with relatively high starch (≥ 80%) and low soybean (5%) contents. The dough stability time recorded increased with higher levels of soy substitution; increasing from 7% with whole wheat flour to 17.0% with 30% substitution [23].
The stability time had increased with the addition of soybean flours. Similar results were obtained by Khalil et al. [24] who found that the dough stability time of wheat flour blended with cassava flour markedly increased at 30% level of substitution (Figure 3).
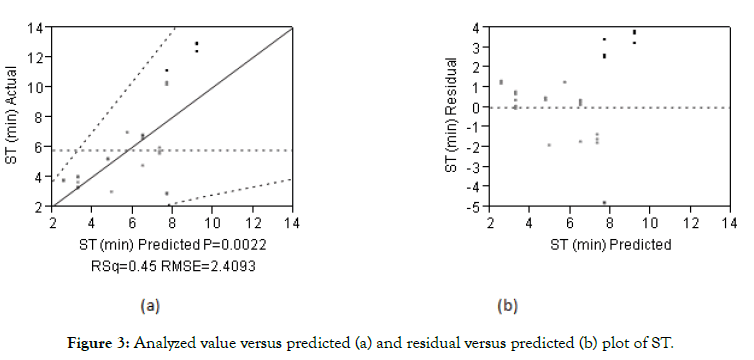
Figure 3: Analyzed value versus predicted (a) and residual versus predicted (b) plot of ST.
The combined effect of wheat, soybean and tef had significant (p<0.05) changes on the dough stability time of the blended flour. The linear terms of wheat and soybean had no significant (p>0.05) effect on the dough stability time of the blend flour. However, the linear term of tef had a significant (p<0.05) effect on the dough stability time. The interaction terms of (W*S) and (S*t), had no significant effect (p>0.05) on the dough stability time whereas that of (S*t) had. The following model was developed to predict the dough stability time.
ST=-6.68W-51.22S-664.75t+102.18(W*S)+828.85(W*t)+979.05(S *t) (R2=0.45)
Where ST is Predicted stability time (min); W: Wheat (%); S: Soybean (%); t: Tef (%)
Mixing Tolerance Index (MTI): Mixing tolerance index is used by bakers to determine the amount that dough will soften throughout mixing. Blending of wheat, soybean and tef had significant (p<0.05) influence on the mixing tolerance index (Table 2). The highest value (77.83 Fu) was observed for the blend of 80% wheat, 5% soybean and 15% tef and the lowest (26.00 Fu) was observed for the blend of 80% wheat, 15% soybean and 5% tef flour blend. Blending wheat flour with tef had somewhat increase the mixing tolerance index (Figure 4).
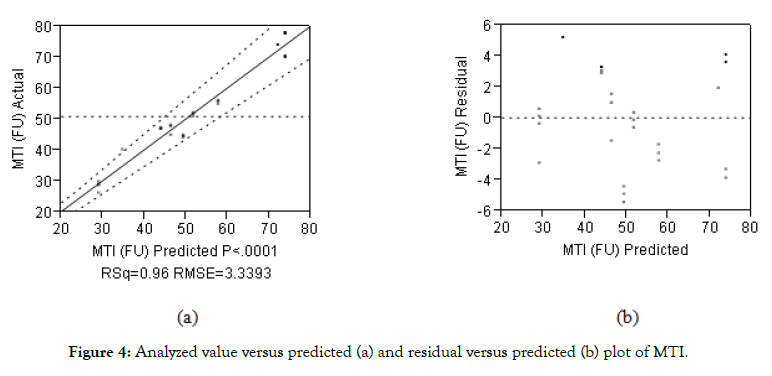
Figure 4: Analyzed value versus predicted (a) and residual versus predicted (b) plot of MTI.
The combination of wheat, soybean and tef had a significantly (p<0.0001) affected the mixing tolerance index. The linear terms of wheat, soybean and tef (p<0.0001) had significant effect on the mixing tolerance index of the blends. The result showed when the level of tef increased in the blend the mixing tolerance index also increased. Wheat is known to have low MTI [23]. The addition of tef and soybean had increased the MTI of the blend. The interaction terms of (W*S) and (W*t) had significant effect on the MTI of the blend flour. As compared to the control (100% wheat sample) the MTI values of the blend flours were significantly (p<0.05) lower. This is due to the presence of low amount of wheat flour in the blend. The interaction terms of (S*t) (p>0.05) had no significant effect on the mixing tolerance index of the blend. The following model was developed to predict the mixing tolerance index of the blend.
MTI=71.46W+2503.8S-1766.52t-3410.55(W*S)+2489.44(W*t)- 772.82(S*t) (R2=0.96)
Where MTI is Predicted mixing tolerance index (Fu); W: Wheat (%); S: Soybean (%); t: Tef (%)
The analyzed (experimental) value versus predicted to MTI (Figure 4a) was correlated with the experimental data as demonstrated by regression coefficient (R2=0.96). The majority of the points were randomly distributed nearby the diagonal line.
The residual versus predicted plot is presented in Figure 4b. The points were randomly distributed about the zero value horizontal line on the vertical axis. This indicates that the model was adequate in describing the data.
Time to Breakdown (TB): Time to break down is a time from start of mixing until there has been a decrease of 30 FU from peak point. The data of time to break down of the dough of the blended flours are shown in Table 2. Blending of wheat, soybean and tef had significant effect (p<0.05) on time to break down of the dough. The highest (17.86 min) was observed for blending of 80% wheat, 15% soybean and 5% tef flour and the lowest (8.40 min) observed for 100% wheat (control) flour. This may be due to the high fiber contents of soybean flour. The result in this work is within the range (2.90-25.4) minutes reported by Maghirang et al. for hard red winter wheat (Figure 5) [25].
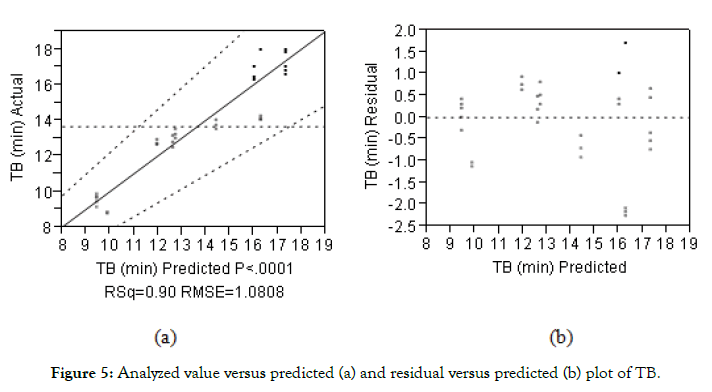
Figure 5: Analyzed value versus predicted (a) and residual versus predicted (b) plot of TB.
The combining wheat, soybean and tef brought significant (p<0.0001) effect on time to break down of the blend dough. The linear terms of wheat showed significant (p<0.05) effect on the time to break down of the blend. The effect of linear term of soybean and tef, and all interaction terms were insignificant (p>0.05). The following model was developed to predict time to break down of the blend.
TB=14.09W+133.36S+245.76t-91.01(W*S)+331.01(W*t)- 271.98(S*t) (R2=0.89)
Where TB is Predicted time to break down (Fu); W: Wheat (%); S: Soybean (%), t: Tef (%)
Farinograph Quality Number (FQN): The farinograph quality number of the flour dough was significantly (p<0.05) affected by the wheat, soybean and tef blending (Table 2). The FQN of the blend product had ranged from (84.00-180.00) FU. The highest value (180.00FU) was obtained when 70% wheat flour, 15% soybean and 15% tef flour were blended. The lowest value (84.00FU) was for 100% wheat flour (control). The farinograph quality number of composite flour dough’s increased as the soybean and tef flours blending ratios increased in wheat flour (Figure 6).
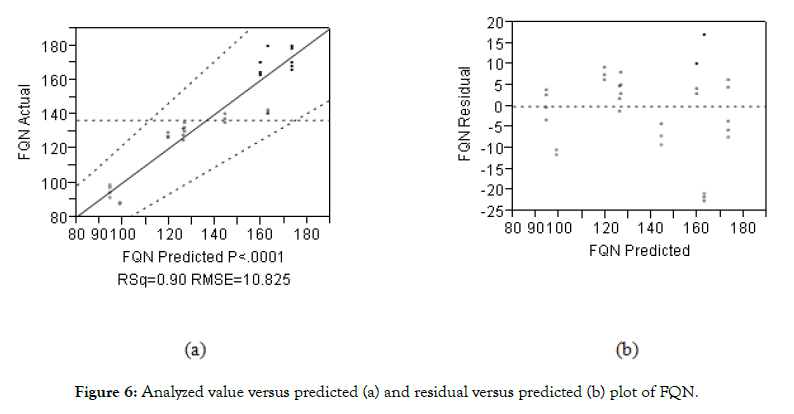
Figure 6: Analyzed value versus predicted (a) and residual versus predicted (b) plot of FQN.
The combined effect of wheat, soybean and tef was significant (p<0.0001) on FQN of the blend dough. The linear term of wheat had a significant (p<0.0001) effect on the FQN of the blend. The effect of linear term of soybean and tef, and all interaction terms (W*S), (W*t) and (S*t) were insignificant (p>0.05). The following model was developed to predict FQN of the blend.
FQN=141.00W+1354.33S+2481t-933.33(W*S)-3333.33(W*t)- 2800.00(S*t) (R2=0.89)
Where FQN is Predicted Farinograph Quality Number (Fu); W: Wheat (%); S: Soybean (%),
t: Tef (%)
Conclusions
Rheological property of wheat composite dough analysis is important to determine the final quality of bread. Supplementing soybean and tef to wheat increased Dough Development Time (DDT), dough Stability Time (ST), Time to Breakdown (TB) and Farinograph Quality Number (FQN) of the blend dough and decrease Water Absorption (WAS) and Mixing Tolerance Index (MTI) of wheat base composite dough. It was thus concluded that, the proportion of wheat from 80% to 85%, soybean from 5% to 10% and tef from 5% to 10% were optimum levels for rheological property of the wheat-based composite dough. An optimum mixing level is important in determining rheological property of wheatbased composite dough.
REFERENCES
- Bakke A, Vickers Z. Consumer liking of refined and whole wheat breads. J Food Sci. 2007;72:S473-S480.
- Martin P. Controlling the breadmaking process: the role of bubbles in bread. Cereal Foods World. 2004;49:72.
- Sluimer P.Principles of breadmaking: functionality of raw materials and process steps. St. Paul, MN: American Association of Cereal Chemists. 2005.
- Siddiq M, Nasir M, Ravi R, Butt MS, Dolan KD, Harte JB. Effect of defatted maize germ flour addition on the physical and sensory quality of wheat bread. LWT-Food Sci Technol. 2009;42:464-470.
- Dewettinck K, Van Bockstaele F, Kühne B, Van de Walle D, Courtens TM, Gellynck X. Nutritional value of bread: Influence of processing, food interaction and consumer perception. J Cereal Sci. 2008;48:243-257.
- Basman A, Köksel H, Ng PK. Utilization of transglutaminase to increase the level of barley and soy flour incorporation in wheat flour breads. J Food Sci. 2003;68:2453-2460.
- Asrat W, Frew T. Utilization of tef in Ethiopian diet. InProceedings of the International workshop on tef genetics and improvement 2000:16-19.
- Ketema S. Eragrostis tef (Zucc.) Trotter. Promoting the conservation and use of underutilized and neglected crops. 1997.
- McWatters KH, Phillips RD, Walker SL, McCullough SE, Wilmot YM, Saalia FK, et al. Baking performance and consumer acceptability of raw and extruded cowpea flour breads. J Food Qual. 2004;27:337-351.
- Islam T, Chowdhury A, Islam M, Islam S. Standardization of bread preparation from soy flour. Int J Sustainable Crop Prod. 2007;2:15-20.
- Mohammed MI, Mustafa AI, Osman GA. Evaluation of wheat breads supplemented with teff ('Eragrostis tef (ZUCC.') Trotter) grain flour. Aust JCropSci. 2009;3:207.
- Olaoye OA, Onilude AA, Idowu OA. Quality characteristics of bread produced from composite flours of wheat, plantain and soybeans. Afr J Biotechnol. 2006;5:1102-1106.
- Kebede L.Effect of extrusion operating conditions on the physicochemical and sensory properties of grain teff puffed products(Doctoral dissertation, Thesis Submitted to School of Graduate Studies, Haramaya University).
- IITA I. Soybeans for good health: How to grow and use Soybeans in Nigeria. IITA publication. 1990:23.
- Raji AG, Famurewa JA. Parameters affecting milling qualities of undefatted soybeans (Glycine max, L. Merill)(2): selected physical properties. Int J Food Eng. 2005;1.
- AACCC. Approved methods of the American association of cereal chemists. Methods. 2000;54:21.
- SAS Institute. SAS/STAT user's guide: version 6. SAS Institute Incorporated. 1990.
- Chung OK, Park S. Functional properties of wheat flour components and basic ingredients in breadmaking. InICC-SA symposium 1997.
- Lee MR, Swanson BG, Baik BK. Influence of amylose content on properties of wheat starch and breadmaking quality of starch and gluten blends. Cereal Chem. 2001;78:701-706.
- Morita N, Maeda T, Miyazaki M, Yamamori M, Miura H, Ohtsuka I. Dough and baking properties of high‐amylose and waxy wheat flours. Cereal Chem. 2002;79:491-495.
- Doxastakis G, Zafiriadis I, Irakli M, Marlani H, Tananaki C. Lupin, soya and triticale addition to wheat flour doughs and their effect on rheological properties. Food Chem. 2002;77:219-227.
- Thiele C, Gänzle MG, Vogel RF. Contribution of sourdough lactobacilli, yeast, and cereal enzymes to the generation of amino acids in dough relevant for bread flavor. Cereal Chem. 2002;79:45-51.
- Okoye JI, Nkwocha AC, Ogbonnaya AE. Production, proximate composition and consumer acceptability of biscuits from wheat/soybean flour blends. Continental J Food Sci Technol. 2008;2:6-13.
- Khalil AH, Mansour EH, Dawoud FM. Influence of malt on rheological and baking properties of wheat–cassava composite flours. LWT-Food Sci Technol. 2000;33:159-164.
- Maghirang EB, Lookhart GL, Bean SR, Pierce RO, Xie F, Caley MS, et al. Comparison of quality characteristics and breadmaking functionality of hard red winter and hard red spring wheat. Cereal Chem. 2006;83:520-528.
Citation: Urigacha SD (2020) The Effect of Blending Ratio on Rehological Property of Wheat Based Composites Dough. J Food Process Technol 11:847
Copyright: © 2020 Urigacha SD. This is an open-access article distributed under the terms of the Creative Commons Attribution License, which permits unrestricted use, distribution, and reproduction in any medium, provided the original author and source are credited.
