Indexed In
- Open J Gate
- RefSeek
- Hamdard University
- EBSCO A-Z
- Scholarsteer
- Publons
- Euro Pub
- Google Scholar
Useful Links
Share This Page
Journal Flyer
Open Access Journals
- Agri and Aquaculture
- Biochemistry
- Bioinformatics & Systems Biology
- Business & Management
- Chemistry
- Clinical Sciences
- Engineering
- Food & Nutrition
- General Science
- Genetics & Molecular Biology
- Immunology & Microbiology
- Medical Sciences
- Neuroscience & Psychology
- Nursing & Health Care
- Pharmaceutical Sciences
Research - (2021) Volume 9, Issue 9
The Determinants of Audit Fees: Evidence from Private Banks in Ethiopia
Workneh Dilie*Received: 24-Jul-2021 Published: 16-Aug-2021, DOI: 10.35248/2472-114X.21.9.224
Abstract
The main objective of this study was to investigate factors determining audit fees in Ethiopian private banks, with specific emphasis on how the client size, client profitability, client complexity, audit risk, audit firm size, audit tenure and audit report lag impact on audit fee. This was informed by the fact that most research on audit fee models has been done in developed countries while little study is available in developing countries like Ethiopia. The study was based on a sample of 10 private banks covering a time period of nine years from 2009 to 2017 (90 observations). The data employed in this study was secondary data from annual reports of the banks. Panel data regression analysis based on fixed effects model was used in the analysis of the variables in this study. The panel fixed effects regression result’s coefficient of determination (R2) was 0.6349 implying that 63.49% of the variation in audit fees is explained by the variables in the study, while 36.51% of the audit fee variance is explained by the error term. The results of the study indicated that the amount of audit fees is significantly influenced by client size, client complexity, and audit tenure. However, this research revealed that there was no significant relationship between audit fee and client profitability, audit firm size, audit risk and audit report lag.
Keywords
Audit fees; Audit tenure; Private banks
Introduction
Auditing as defined by the American Accounting Association, AAA (1973) is a ‘systematic process of finding and evaluating evidence regarding statements about economic actions and events to establish the degree of correspondence between the statements and established criteria and communicating the results to interested users’. It serves a vital economic purpose and plays an important character in serving the public interest to strengthen accountability and reinforce trust and confidence in financial information and reporting. Annual audit is compulsory for companies, including insurance companies in Ethiopia. However, in recent years, and in the light of massive corporate scandals, there is ongoing global demand for improvements in audit quality [1].
The Ethiopian audit market environment has unique features unlike the audit market in other developed as well as developing countries. First, the audit market has two sub markets i.e. the external audit of state owned enterprises and the market for private audit firms authorized by The fall of high profile giant companies (Enron, WorldCom) at the down of the century in the west raised significant criticism on the auditing profession. This was mainly due to the fact that auditors were implicated in many of the cases. It was revealed that auditors drive higher non-audit fees and abnormally higher audit fees which motivate them to lose their independence [2].
Although there have been numerous studies on audit fee determination, most of these have been conducted using data in developed countries [3]. To date, there has been little work done on developing countries especially issues on auditor independence, audit quality, audit delays, and audit fee determinants [4] conclude that the significance of certain variables changes according to each country’s characteristics and period of analysis; they recommended that models be revised periodically. As such, this study tried to contribute in addressing this imbalance by having a closer look on audit fee determination of private banks in Ethiopia.
Despite the significance of financial institutions to the economy, accounting researchers have done little worldwide to investigate the various relationships that exist between the financial institutions and their auditors especially regarding the factors that influences pricing of audit engagement [5]. In Ethiopia, as a financial institution, the banking business plays significant intermediary roles in terms of saving, enhancing private investment, creation of job opportunities and ensuring various development related projects [6]. However, the accounting and auditing practice remains at its infant stage. It is a well known fact that the banking industry provides a market for external auditors operating in Ethiopia.
Moreover, how auditors price audit services provided to their clients has not been researched. Thus, this study investigated how auditors price audit services and what factors determine pricing of such services in private banks in Ethiopia.
In the case of Ethiopia, the determinants of audit fees are unexplored areas. As per knowledge of the researcher, there are only two studies done in relation to determinants of audit fees studied by [7] on audit fees determinants and audit quality of commercial banks, and [2] on factors affecting audit fees of private banks. However, these researchers have ignored important variables like audit tenure and audit report lag (time lag) that determine audit fees which are widely employed in literatures of other countries. Hence, the researcher has examined how and to what extent these two new variables determine audit fees of insurance companies in Ethiopia in addition to five other variables mostly used by literatures in other countries such as client size, client profitability, client complexity, audit risk and audit firm size which were also employed by the above researchers.
Besides, the variables employed by the researchers pointed above are inconsistent in which [7] has used liquidity, efficiency, and profitability variables while [2] did not employ these variables who rather used board characteristics and audit committee characteristics which are not used by [7] Thus, the researcher has tried to solve such inconsistencies by employing the most common variables listed above which are widely used in previous literatures of other countries. Moreover, as per the researcher’s knowledge and access, it is unfortunate that no single study has been done on determinants of audit fees in insurance industry of Ethiopia. Therefore, this study tried to fill the stated gaps in the literature by examining factors that determine audit fees casing private banks in Ethiopia.
Objective of the Study
General Objective
The general objective of this study was to investigate the major determinantes of audit fees in the case of Ethiopian private banks.
Specific Objectives
In addition to the above general objective, the study has the following specific objectives:
➢ To examine the impact of client size on audit fees charged by audit firms to private banks in Ethiopia
➢ To examine the impact of client profitability on audit fees charged by audit firms to private banks in Ethiopia
➢ To examine the impact of client complexity on audit fees charged by audit firms to private banks in Ethiopia
➢ To investigate the impact of audit risk on audit fees charged by audit firms to private banks in Ethiopia
➢ To examine the impact of audit firm size on audit fees charged by audit firms to private banks in Ethiopia
➢ To investigate the impact of audit tenure on audit fees charged by audit firms to private banks in Ethiopia
➢ T o investigate the impact of audit report lag on audit fees charged by audit firms to private banks in Ethiopia
Research hypothesis
After the researcher has reviewed related literatures the following hypotheses were developed:
1. Ho: Client size has a positive and significant relationship with audit fees
2. Ho: Client profitability has a positive and significant relationship with audit fees.
3. Ho: Client complexity has a positive and significant relationship with audit fees.
4. Ho: Audit risk has a positive and significant relationship with audit fees.
5. Ho: Audit firm size has a positive and significant relationship with audit fees
6. Ho: Audit tenure has a positive relationship with audit fees
7. Ho: Audit report lag has a positive relationship with audit fees
Research Design and Methodology
Research design
The primary objective of this study was to examine the impact of client size, client profitability, client complexity, audit risk, audit firm size, audit tenure, and audit report lag on audit fees paid by private banks to audit firms in Ethiopia. To achieve theresearch objective, explanatory research design was employed. The explanatory type of research design helps to identify and evaluate the causal relationships between the different variables under consideration [8].
Research method
Therefore, in order to achieve the objectives of the study and test the hypothesis formulated in the study, quantitative method was used by constructing an econometric model to identify and measure the determinants of audit fees since this method is well suited for such relationships.
Sample of the study
The target population for this study consists of all private banks operating in Ethiopia. The sample frame for the study was decided based on the availability annual audited financial statement data from 30 June 2009 - 30 June 2017. To achieve the research objectives, purposive sampling was used so as to include all target established and serving within the period of times pecified above. Accordingly, the sample size for the study is private banks operating over the period of nine years (90 observations)..
Data types and collection metods
This study has employed only secondary data type and source because this research study was more dependent on company financial data. The structured review of published annual reports and other documents were used.
Methods of data analysis
Descriptive statistics like mean, minimum, maximum, and standard deviation was used to describe the nature of the data set and the variables of interest. Panel data regression analysis was used to determine the relationships between audit fees and its determinants and to test the hypothesis thereon. Panel data analysis is a method of studying a particular subject within multiple sites, periodically observed over a defined time frame. The panel data analysis for this study was carried out using STATA (version 12) software package (Table 1).
| Variable | Measurement or Proxy | Expected sign | |
|---|---|---|---|
| Dependent variable | Audit fee | Natural logarithm of audit fee | (+) |
| Independent variables | Client size | Natural logarithm of total assets | (+) |
| Client complexity | Total receivables divided by total assets | (+) | |
| Client profitability | Net income divided by total assets or return on assets (ROA) | (+) | |
| Client risk (Audit risk) | Total liabilities divided by total assets or Leverage ratio | (+) | |
| Audit firm size | Dummy variable given the value of 1 if a client is audited by grade ‘A’ auditor and 0 otherwise | (+) | |
| Audit tenure | Dummy variable given the value of 1 if a typical auditor serves its client more than 3 consecutive years and 0 if it serves less than 3 years | (+) | |
| Audit report lag | The number of days from the year end date to the date where financial statements are issued (audit report date) | (+) | |
Table 1: Measurement and expected sign of the variables used in the study.
Source: Driven from Literature
Model specification
The panel data model is specified and discussed as follows:
Ln(AdFee)it = β0 + β1Ln(Tast)it + β2(ROA)it + β3(Comp)it + β4(ARisk)it + β5(BIG)it + β6(AudTen)it + β7(Tlag)it + εit
Where, Ln(AdFee): the natural logarithm of audit fees
Ln(Tast): the natural logarithm of total assets which was a proxy used to measure client size
ROA: is the return on asset which was a proxy used to measure client profitability in this study
Comp: client complexity measured as the ratio of total receivables to total assets
ARisk: audit risk which was measured as the ratio of total liabilities to total assets
BIG: audit firm size, which in this case, was measured as a dummy variable and the value of ‘1’ is assigned if the client is audited by grade ‘A’ audit firm and ‘0’ otherwise
AudTen: audit tenure, which in this case, was measured as a dummy variable with the value of ‘1’ if Audten>3yearsand ‘0’ otherwise
Tlag: time lag (audit report lag) which was measured as the number of days from the fiscal year end date to the date where audit report is issued
i and t represent individual cross-sectional unit and time respectively.
Result and Discussion
Descriptive statistics
This section presents the descriptive statistics of dependent and independent variables used in the study for the sample private banks in Ethiopia (Table 2).
| Items | Mean | Minimum | Maximum | Std Dev | Observations |
|---|---|---|---|---|---|
| AdFee | 91656 | 25300 | 414016 | 87427.03 | 90 |
| Size(in ‘000’) | 640252.5 | 32475.02 | 4123652 | 752667.5 | 90 |
| ROA | 0.08 | -0.10 | 0.16 | 0.04 | 90 |
| Comp | 0.16 | 0.05 | 0.37 | 0.07 | 90 |
| ARisk | 0.67 | 0.47 | 0.79 | 0.08 | 90 |
| BIG | 0.72 | 0 | 1 | 0.45 | 90 |
| AudTen | 0.39 | 0 | 1 | 0.49 | 90 |
| Tlag | 130.5 | 47 | 592 | 98.71 | 90 |
Table 2: Descriptive statistics of dependent and independent variables.
Source: Own computation from the data based on financial statements of Insurance Companies.
According to the above table, AdFee measured by the natural logarithm of audit fees paid by the sample insurers has a mean value of Birr 91,656. This means that private banks in Ethiopia pay audit fees of Birr 91,656 on average during the study period. The minimum audit fee paid by the sampled insurance companies during the study period was Birr 25,300 while the maximum audit fee paid during the study period was Birr 414,016. The standard deviation of Birr 87,427.03 implies that the audit fee deviates from its mean to both sides by Birr 87,427.03.
The independent variable, size, which was measured by the natural logarithm of total assets of sample insurance companies, has a mean value of Birr 640,252,500 total assets. This means that the average size of the sample private banks in Ethiopia has total assets of Birr 640,252,500. The minimum size of the sample private banks during the study period has total assets of Birr 32,475,020 and the maximum size has total assets of Birr 4,123,652,000. Size deviates from its mean by Birr 752,667,500 total assets to both sides.
The other independent variable, ROA which was measured by dividing net income to total assets of sampled insurers during the study period has a mean value of 0.08 cents, which implies that for every unit increase in the investment of assets, on average, private banks in Ethiopia earn a return of 8%. The minimum value of ROA during the study period was -0.10 or -10% and the highest value of ROA was 0.16 or 16%. The value of ROA deviates from its mean to both sides by 4% percent. It measures the efficient use of assets to earn income.
As it is shown in table 4.1 above, the other variable used in the study was the Comp which was measured as total receivables divided by total assets. The complexity variable has a mean value of 16%, which means that from their investment in assets. The minimum receivable investment during the study period was Birr 0.05 cents and the maximum amount was Birr 0.37 cents. The standard deviation of Birr 0.07 cents means that complexity deviates from its mean to both sides by Birr 0.07 cents.
ARisk (Audit Risk) represented by total liabilities divided by total assets of the sample private banks in the study period has a mean value of 67%. The minimum leverage ratio during the study period was Birr 0.47and the maximum amount of leverage ratio during the study period was 0.79 and it deviates from its mean by 0.08 cents.
Moreover, Aud Ten which was measured as a dummy variable valued 1 if the client-auditor relationship is more than three years and 0 if less than three years has a mean value of 0.39 which is an average period during which a typical auditor serves a client given a dummy value and a standard deviation of 0.49 which shows its deviation from the center (mean). Similarly, as a dummy variable, it has a minimum value of 0 and a maximum value of 1.
Finally, the Tlag variable measured as the number of days from the yearend date to the date where financial statements are issued or the audit report date has a mean value of 130.5 days. The minimum time lag between the yearend date and the audit report date was 47 days during the study period and the maximum time lag was 592 days during the study period. The standard deviation of 98.71 reveals that the time lag deviates from its mean by 98.71 days to both sides during the study period.
Correlation Analysis
(Table 3)
| Variables | AdFee | Size | ROA | Comp | ARisk | Big | AudTen | Tlag |
|---|---|---|---|---|---|---|---|---|
| AdFee | 1.0000 | -- | -- | -- | -- | -- | -- | -- |
| Size | 0.7342 | 1.0000 | -- | -- | -- | -- | -- | -- |
| ROA | 0.3961 | 0.3934 | 1.0000 | -- | -- | -- | -- | -- |
| Comp | -0.3713 | -0.6003 | -0.4445 | 1.0000 | -- | -- | -- | -- |
| ARisk | 0.1357 | 0.0715 | -0.2135 | 0.3301 | 1.0000 | -- | -- | -- |
| Big | 0.4104 | 0.3182 | 0.0920 | -0.0078 | -0.0864 | 1.0000 | -- | -- |
| AudTen | 0.3536 | 0.3692 | 0.1226 | -0.1994 | 0.1535 | -0.0141 | 1.0000 | -- |
| Tlag | 0.5937 | 0.5649 | 0.1508 | -0.1145 | 0.3913 | 0.1669 | 0.2150 | 1.0000 |
Table 3: Correlation matrix of dependent and independent variables.
Source: Own computationfrom the data based on financial statements of Insurance Companies.
The correlation matrix above shows that audit fee has a strong positive correlation with size of private banks by the value of 0.7342, with time lag by the value of 0.5937, with BIG or auditor size by the value of 0.4104. Additionally, audit fee has a relatively strong positive correlation with return on assets (ROA) by the value of 0.3961 and with audit tenure by the value of 0.3536. On the other hand, audit fee has negative correlation with complexity by the value of 0.3713. Besides, audit fee has weak positive correlation with audit risk by the value of 0.1357.
Client size is found highly positively correlated with audit fee at 73.42 percent and this is due to its high explanatory power in the audit fee model which is consistent with prior research [9-15]. It can be inferred here that from the relationship explained above, the independent variables have a relatively higher relationship with the dependent variable of the selected private banks and it therefore means thatthe selected independent variables can explain the dependent variable with a considerable degree.
Normality test
The best way to evaluate how far the used data are normal is to look at a graph and see if the distribution highly deviates from a bell-shaped normal distribution. Therefore, graphical (histogram) and non-graphical (skewness/ kurtosis) tests of normality were used to test normality in this study (Figures 1 and 2).

Figure 1: Histogram showing normal distribution.

Figure 2: Skewness/Kurtosis tests for normality.
Practically, in this study, p-value is found to be 0.3877 (greater than 0.05) from the above Skewness/Kurtosis test leading to the acceptance of the null hypothesis that indicates the residual values are normally distributed (Table 4).
| Variables | Size | ROA | Comp | ARisk | Big | AudTen | Tlag |
|---|---|---|---|---|---|---|---|
| Size | 1.0000 | -- | -- | -- | -- | -- | -- |
| ROA | -0.2237 | 1.0000 | -- | -- | -- | -- | -- |
| Comp | 0.5765 | 0.0763 | 1.0000 | -- | -- | -- | -- |
| ARisk | 0.0350 | -0.0186 | -0.4124 | 1.0000 | -- | -- | -- |
| Big | -0.3826 | 0.0985 | -0.2219 | 0.0288 | 1.0000 | -- | -- |
| AudTen | -0.4014 | -0.0142 | -0.0649 | -0.0538 | 0.1490 | 1.0000 | |
| Tlag | -0.2144 | 0.1383 | -0.1236 | -0.1087 | 0.0779 | -0.0381 | 1.0000 |
Table 4: Correlation Matrix between explanatory variables.
Multicollinearity Test
Usually, as a rule of thumb, multi-collinearity exists if the inter-correlation between two independent variables is more than 0.80 [16]. As it can be seen from the above table, the highest correlation coefficient is 0.5765, which is the value of the correlation between client size and complexity followed by -0.4014, which is the value of the correlation between client size and audit tenure, and -0.3826, which is the value the correlation between client size and BIG (audit firm size) respectively. Therefore, based on the correlation matrix above, there is no problem of multi-collinearity in this studysince values of the correlation coefficient between the independent variables of the study are all below the usual threshold (0.8). As a conclusion, almost all variables have low correlation power and this implies no multi-collinearity problem between explanatory variables
Multicollinearity can also be detected by the Variance Inflation Factor (VIF) technique, which is a statistic calculated for each variable in the model. In this case, if the VIF for a given variable is greater than 10 and 1/VIF for that variableis less than the level of significance (0.05), it signals that the variable is multi-collinear with others in the model and may need to be excluded from the model (Figure 3).
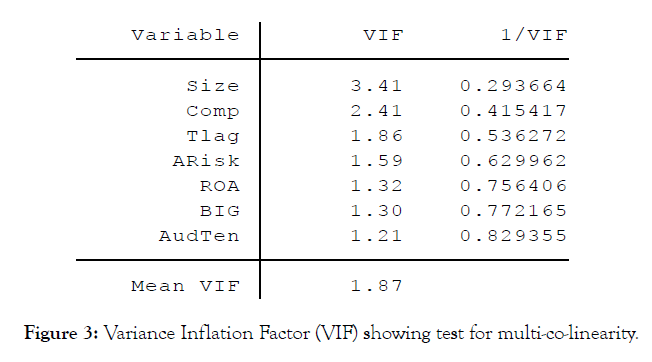
Figure 3: Variance Inflation Factor (VIF) showing test for multi-co-linearity.
Therefore, in this study, there is no evidence of the presence of multi-collinearity problem since the VIF is less than 10 and 1/VIF is greater than the level of significance (0.05) for all variables of the study.
Heteroscedasticity Test
As shown above, there is no evidence of the presence of heteroscedasticity in this study since the p-value is in excess of 0.05(level of significance) whereby the null hypothesis that there is no heteroscedasticity (homoscedasticity) is accepted(Figure 4).
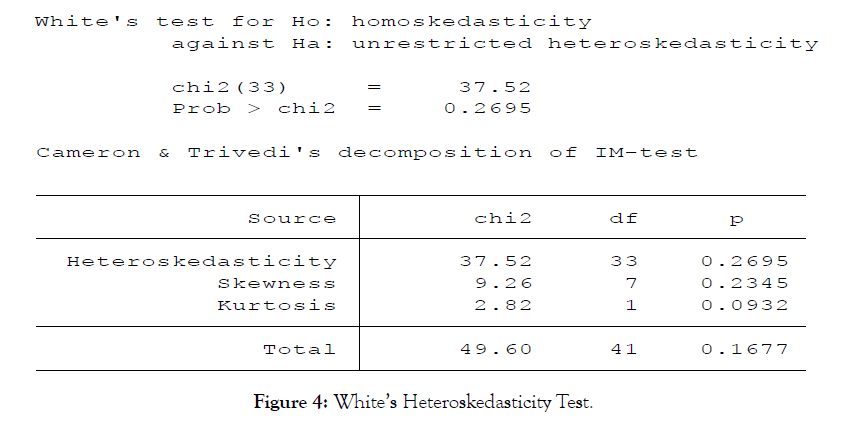
Figure 4: White’s Heteroskedasticity Test.
Autocorrelation Test
Figure 5 below presents the Wooldridge test for autocorrelation in panel data of this study. The null hypothesis is that there is no autocorrelation and accordingly if the p- value is less than the level of significance, the null hypothesis is rejected and vice versa. Hence, it can be seen here that the result shows very strong evidence to support the null hypothesis at the 5% level of significance and hence the null hypothesis is accepted since the p-value is greater than the 5% level of significance which simultaneously means that there is no autocorrelation problem in this study(Figure 5).

Figure 5: Autocorrelation Test.
Hausman Test: Fixed Effect versus Random Effect Models
In financial research, there are two major classes of panel estimator approaches that can be employed. Namely, the fixed effects model and random effects model [17]. The question here is which model is more appropriate, fixed effect model or random effect model in this research. In order to isolate which model is appropriate, the researcher has used the Hausman test. The null hypothesis for this test is that the random effect model is appropriate and the alternative hypothesis is that the fixed effects model is appropriate. Accordingly, if the null hypothesis is rejected then, fixed effects model is used (Figure 6).
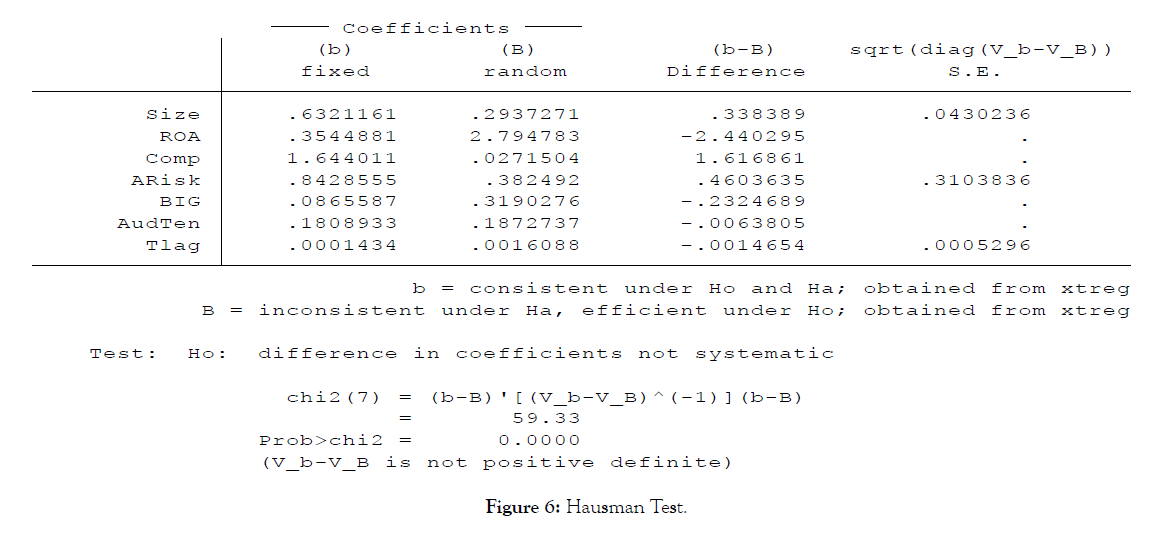
Figure 6: Hausman Test.
The result of the Hausman test above shows that there is a very strong evidence (P-value = 0.0000) against the null hypothesis at the 5% level of significance. That is, the test suggested that the fixed effects estimate is preferable to the random effects estimate. Accordingly, the analysis and discussion of the resultsof this study were based on the fixed effects estimates.
Results of the fixed effects model
The statistical software package (STATA version 12) result of fixed effect estimates are presented in table 4.10 below. This result was the one used for the analysis and interpretation of results for this study against the hypotheses and research questions developed earlier in the paper. Thus, in this study, the following time and entity fixed effects regression result was used (Figure 7).
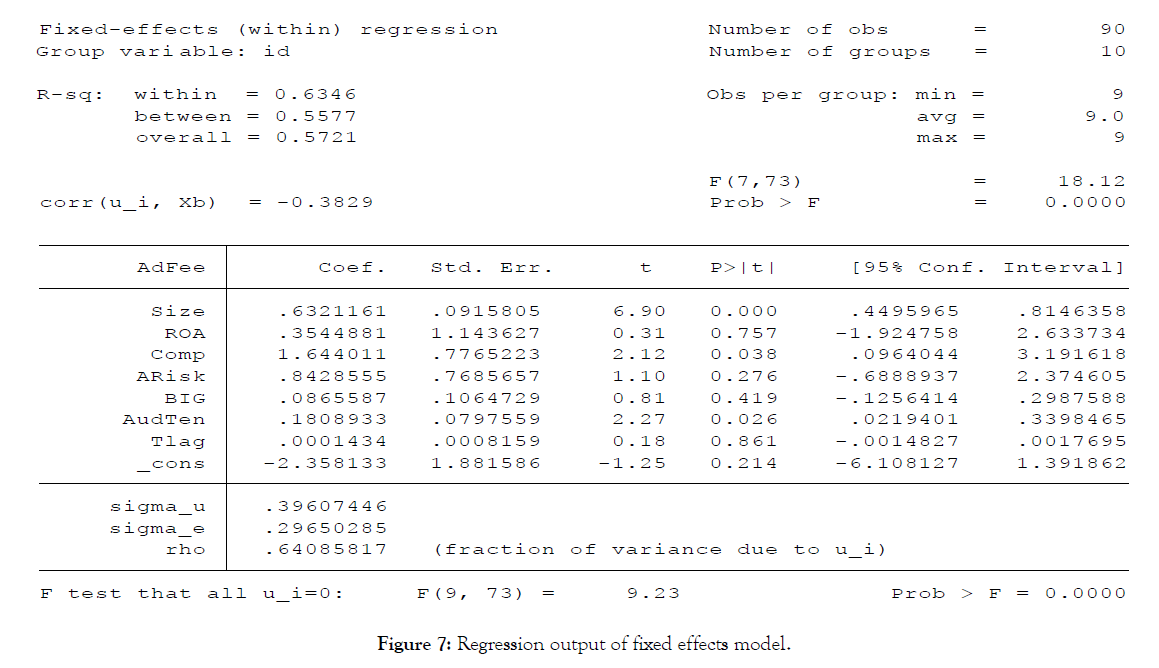
Figure 7: Regression output of fixed effects model.
Discussion
The preceding sections presented the overall results of the study. Thus, this section discussed in detail the analyses and interpretation of the results for each explanatory variable and their importance in determining audit fee.
Client size
The results of the fixed effect model indicated that client size had a positive relationship with audit fee, and highly significant (p-value = 0.000) even at 1%. Thus, the result confirmed a priori hypothesized sign. The null hypothesis is rejected and the result supported the above alternative hypothesis i.e. asclientsize increases audit fee increases. Other variables holding constant, a one percent increase in InsuranceCompanies’ sizehas a resultant increaseof 63.21% percent on audit fee. The significant and positive association between audit fee and client size as per the result of this study is in line with previous literatures and studies (Simunic, 1980;Palmrose, 1986;Joshi and AL-Bastaki, 2000; Carson et al., 2004; Besacier & Alain Schatt, 2006; Kiptum, 2013;Tamrat, 2014; Kikhia, 2015; Getachew, 2016)which concludedthat theclient size is the most important factor that influences audit fees.
Client profitability
According to the results of the fixed effects model, profitability has a positive relationship with audit fee. However, the relationship was highly insignificant (p-value = 0.757) at the 5% level of significance. This insignificant result is consistent with findings by [18]who found insignificant result for profitability. However, the positive result is consistent with a study by [11] who argued that highly profitable firms usually pay more fees in view of the fact that higher profits may require rigorous audit testing of the validity for the recognition of revenue and expenses which requires more audit time. The positive result is also in line with a study by [2] who found a positiverelationship between profitability and audit fees using Ethiopian commercial banks as a case study.
Client complexity
Similar to the researcher’s expectation, complexity of insurance companies as shown above, has significant and positive (P-value = 0.038) impact on the audit fees paid by insurance companies at 5% significance level. Accordingly, the null hypothesis is rejected andthe alternative hypothesis isaccepted. This means that a one unit increase in complexity leads to a Birr 1.64 increase in audit fees paid by insurance companies in Ethiopia. This result is in compliance with previous studies who concluded that as the audit client becomes more complex, more time and effort is needed to perform the external audit work. This is logically true because a more complex audit client means a more diverse organizational structure, and harder to review transactions. This increased audit effort is expected to lead to an increase in the level of audit fees.
Audit risk
The result of this study indicated that audit risk is insignificant (P-value=0.276) determinant of audit fees paid by insurance companies in Ethiopia at the 5% significance level. To conclude, audit risk is found to be insignificant factor for deciding the audit fee issues of auditors and insurance companies in Ethiopia. This result is consistent with a study by Al-Harshani and Kiptum who did not found a significant relationship between client risk and audit fees. However, the positive relationship between client risk and audit fee found in this study is in line with many previous literatures.
Audit firm size
As the fixed effects estimation result reveals, the audit firm size classified based on Grade A, B and C is insignificant (P-value=0.419) determinant of audit fee of insurance companies in Ethiopia. Such inconsistent result might simply be attributed to the fact that the Accounting and Auditing Board of Ethiopia(AABE) has currently overlooked the classification of size of audit firms as big or small based on Grade A, B, and C levels rather it states that any certifiedand authorized audit firm licensed under this board can audit any client. Empirically, this insignificant result is similar to results from a research done by Rusmantoa and Waworuntub who found an insignificant relationship between Big 4 audit firm and audit fee. Similarly, Al‐Harshani did not provide significantevidence of the expected relation between external audit fees and the audit firm size. However, the alternative hypothesis claimed that auditor size has a positive association with audit fee, which implies that audit fee is higher for large firms and lower for small firms. The positive result of this study supports many prior researchers.
Audit tenure
The results of the study indicated that audit tenure has a positive relationship and the relationship was significant (p-value = 0.026) at the 5% level of significance. Thus, the result was in accordance with the researcher’s expectation. That is, as the client-auditor relationship becomes longer, audit fees paid by the client to the auditor increases. Moreover, a one percent increase in audit tenure is associated with a 2.6% increase in audit fees paid by insurance companies in Ethiopia. This result is consistent with a study done by Bedard and Johnstone cited in Urhoghide and Izedonmi who examined the relationship between audit partner tenure, audit planning and audit fees. Their results reveal a strong association between audit fees and audit tenure of American companies.
Audit report lag
As the fixed effects estimation result indicated, the time lag between yearend date and audit report date is insignificant (P-value=0.861) determinant of audit fees paid byinsurance companies in Ethiopia. Out of 12 studies that examined this issue, a meta analysis by Hay et al. stated that6 of them have reported an insignificant result. Basically, the alternative hypothesis claimed that time lag has a positive association with an audit fee,which implies that audit fee is higher for a longer time lag and lower for shorter time lags. The result of this study confirms that time lag positively affects audit fee even if it was insignificant.
The positive result of this study supports the argument made by Kiptum and Hay et al. who respectively stated that longer time lag is an indication of financial challenges such as challenges to the internal control systems and such a company needs more audit work which results in more time on the audit and therefore high audit fees charged, and is sometimes interpreted as an indication of the efficiency of an audit because a longer delay is likely to indicate problems during the course of the audit, difficulties in resolving sensitive audit issues, or more complex financial reports to prepare which consequently is expected to have a positive association with audit fees.
Conclusions and Recommendations
The main objective of this study was to examine or investigate the determinants of audit fees paid by insurance companies in Ethiopia. Accordingly, the study revealed certain basic facts about private banks audit payment along with factors determining it. Basically, the following are the conclusions drawn:
❖ It is well known that auditing serves a vital economic purpose and plays an important role in serving the public interest to strengthen accountability and reinforce trust and confidence in financial information and reporting. Besides, an annual audit is compulsory for companies, including private banks in Ethiopia. For that reason, there is an ongoing global demand for improvements in audit quality.
❖ Methodologically, the researcher adapted the ‘traditional’ model of audit fees’ determinants, which has today become the standard, introduced by Simunic and frequently adjusted since then to specific contexts. The researcher did the same to fit the Ethiopian specific feature of the audit market as carried out in insurance companies.
❖ The study indicated that the audit fees charged by Ethiopian audit firms to private banks in Ethiopia were found to be very low comparing to audit fees charged by audit firms to clients in other countries.
❖ The regression results of the study’s audit fee model verified that 63.46 percent of the change in the dependent variable was explained by the independent variables that were selected and included in the model. This implies that audit fees paid by private banks in Ethiopia were highly explained by the selected independent variables.
❖ The findings of this study also indicated that complexity and audit tenure were positively related to audit fees and significant in determining audit fees paid by Ethiopian private banks.
❖ The result, in contrary to most previous researches, verified that audit risk and audit firm size variables do not have influence on private banks audit payment. Furthermore, profitability and audit report lag were also found to be insignificant. Therefore, these variables do not have influence on audit fees paid by Ethiopian private banks since the study could not get enough statistical significance. Fortunately, all independent variables selected for this study were found to have a positive relationship with the dependent variable in line with the researcher’s expectation.
Based on the above conclusions of the study, the researcher recommends the following points:
➢ There is an ongoing global demand for improvements in audit quality and the demand for audit services comes from company owners, outside investors, company managers, governments and the general public. Hence, this fact entails that both clients and auditing firms should consider the factors cautiously to decide on audit fees.
➢ The findings of the study indicated that the variables of client size, complexity, and audit tenure were positively and significantly related to audit fees. Therefore, both insurance companies and auditors should give a greater deal of attention to these significant variables in determining their audit pricing.
➢ In the market for audit services, the fear of losing the clients and revenues generated from the various assurance activities may compromise the auditor’s independence. Moreover, both auditors and clients should consider the impact of audit tenure on audit fees on the one hand and its impact on compromising the independence of auditors on the otherwhich simultaneously means auditors face the risk of litigationsince this new variable was found to significantly influence the variation in audit fees of insurance companies in Ethiopia.
➢ The results of this study also indicated that the audit fees charged by Ethiopian audit firms to their clients (insurance companies) in Ethiopiawerefound to be very low comparing to audit fees charged by audit firms to clients in other countries, for example, the neighbouring country Kenya during almost similar study periods. Hence, both clients and audit firms in Ethiopia should have a special course of discussion regarding this issue since this variation might have an impact on the quality of theaudit provided by the audit firms.Finally, as a concluding remark, in today’s dynamic environment, more challenges are in store for both the auditor and the client especially in the fee-setting process. Thus, both parties should understand the factors behind the audit fee charged so that things are bound to become clearer.
REFERENCES
- Soyemi KA, Olowookere JK. Determinants of External Audit Fees: Evidence from the Banking Sector in Nigeria. Res J Fin Account. 2013; 4(15): 50-58.
- Tamrat A. Audit fees determinants and audit quality in Ethiopian commercial banks, A Thesis Submitted to the Department of Accounting and Finance College of Business and Economics. 2014.
- Kasim MN. The Determinants of Audit Fees for SMEs in Malaysia and Implications of MIA Guidelines, Research report in partial fulfillment of the requirements for the degree of Master of Business Administration. 2005.
- Karim AKMW, Moizer P. Determinants of audit fees in Bangladesh.Int J Account. 1996; 31(4): 497-509.
- Fields LP, Fraser DR, Wilkins MS. An investigation of the pricing of audit services for financial institutions. J Account Public Policy 2004; 23(1):53– 77.
- Teklit A, Kaur. Determinants of insurance companies’ profitability: Analysis of insurance sector in Ethiopia. Int J Res Fin Mktg.2015; 7(4): 124-137.
- Getachew L. Factors affecting audit fees in private commercial banking industries in Ethiopia. 2016.
- Mistre S. The Determinants of Profitability on Insurance Sector: Evidence from Insurance Companies in Ethiopia. 2015.
- Simunic DA. The Pricing of Audit Services: Theory and Evidence. J Account Res. 1980; 18(1) 161-190
- Palmrose ZV. Audit fees and auditor size: Further evidence. J Account Res. 1986; 24(1): 97–110.
- Joshi PL, Al-Bastaki H. Determinants of Audit Fees: Evidence from the Companies Listed in Bahrain. Int J Audit2000; 4(2): 129-138.
- Carson E, Fargher N, Simon DT, Taylor MH. Audit Fees and Market Segmentation – Further Evidence on How Client Size Matters within the Context of Audit Fee Models. Int J Audit 2004; 8(1): 79–91.
- Besacier NG, Schatt A. Determinants of Audit Fees for French Quoted Firms. Manag Audit J 2006; 22(2):139-160.
- Kiptum KE. Determinants of Audit Fees for Listed Firms in Kenya. University of Nairobi. 2013.
- Kikhia HY. Determinants of Audit Fees: Evidence from Jordan. Accounting and Finance Research, 2015; 4(1): 42-53.
- Gujarati DN. Basic Econometrics, 4th Edition, Boston: McGraw-Hill. 2003.
- Brooks C. Introductory Econometrics for Finance, 2nd Edition, Cambridge University Press, 2008; New York.
- Ling GP, Yee GP, Liang LJ, Peck Y, San TH. The Determinants of Audit Fees among Listed Manufacturing Companies in Malaysia. 2014.
Citation: Dilie W (2021) The Determinants of Audit Fees: Evidence from Private Banks in Ethiopia. Int J Account Res 9:224. doi: 10.35248/2472- 114X.21.9.224
Copyright: © 2021 Dilie W. This is an open-access article distributed under the terms of the Creative Commons Attribution License, which permits unrestricted use, distribution, and reproduction in any medium, provided the original author and source are credited.
