Indexed In
- Open J Gate
- Genamics JournalSeek
- Academic Keys
- JournalTOCs
- ResearchBible
- Ulrich's Periodicals Directory
- Access to Global Online Research in Agriculture (AGORA)
- Electronic Journals Library
- RefSeek
- Hamdard University
- EBSCO A-Z
- OCLC- WorldCat
- SWB online catalog
- Virtual Library of Biology (vifabio)
- Publons
- MIAR
- Geneva Foundation for Medical Education and Research
- Euro Pub
- Google Scholar
Useful Links
Share This Page
Journal Flyer

Open Access Journals
- Agri and Aquaculture
- Biochemistry
- Bioinformatics & Systems Biology
- Business & Management
- Chemistry
- Clinical Sciences
- Engineering
- Food & Nutrition
- General Science
- Genetics & Molecular Biology
- Immunology & Microbiology
- Medical Sciences
- Neuroscience & Psychology
- Nursing & Health Care
- Pharmaceutical Sciences
Research Article - (2021) Volume 0, Issue 0
The Delta Variant: The Choice between Spreading Vaccines or Guns
Umberto Cornelli*Received: 06-Aug-2021 Published: 27-Aug-2021, DOI: 10.35248/2155-9597.21.S11.001
Abstract
Background: The COVID-19 pandemic has affected the whole world since 2020 and, despite the vaccination programme under way, it is still not under control, apparently due to the Delta variant.
Objective: To compare the death rates following the vaccination campaign in 52 countries (47 European countries, the USA, India, Russia, Brazil, and Mexico). Weekly periods between August 2020 and 26 July 2021 were considered. The correlation between the number of vaccinations, LEEDELS data (Life Expectancy, Ecological, Demographic/ Social and Lifestyle Variables) and defence expenditure will be calculated to determine which variables are connected with vaccination campaigns.
Methods: The number of weekly deaths and vaccinations were retrieved for the 52 countries from the WHO coronavirus dashboard. The LEEDELS data and military expenses were taken from the Atlante Geografico Agostini 2020 and CIA World Factbook 2020-2021. The weekly death ratio was calculated considering a time lag of three weeks between infection and death. The statistical evaluation of the correlation between LEEDELS data and number of vaccinations was calculated using Spearman's ρ.
Results: The death rates in the European countries considered following the start of the vaccination campaign are lower than in the other countries analysed. The data for the last week (26 July) in Europe, the USA, India, Brazil, Russia, and Mexico were 3.91, 19.03, 13.02, 21.38, 31.78, and 54.49 respectively. The LEEDELS data relating to wealth were all positively correlated with the number of shots administered, while defence expenditure was negatively correlated.
Conclusion: Vaccination seems to be effective in protecting against COVID-19, but it cannot be employed as the sole measure against viral infection since there is still a threat that some countries (the USA, Russia, India, Brazil, and Mexico) export the infection in the form of the Delta or other variants. The resources to provide and administer vaccines are more fundamental than defence expenditure.
Keywords
COVID-19; Vaccination; LEEDELS; Delta
Introduction
The first wave (W1) of COVID-19 started around January 2020 in China. In just a few months, it gave rise to a pandemic with a first wave peak of about 6.8 deaths per 105 inhabitants in the world between March and May 2020. In the period between May and October 2020, the pandemic fluctuated at between 4 and 6 deaths per 105 inhabitants per week, and after October 2020 the number of deaths started to grow again giving rise to other waves and reaching 12-13 deaths per 105 inhabitants per week (Figure 1).
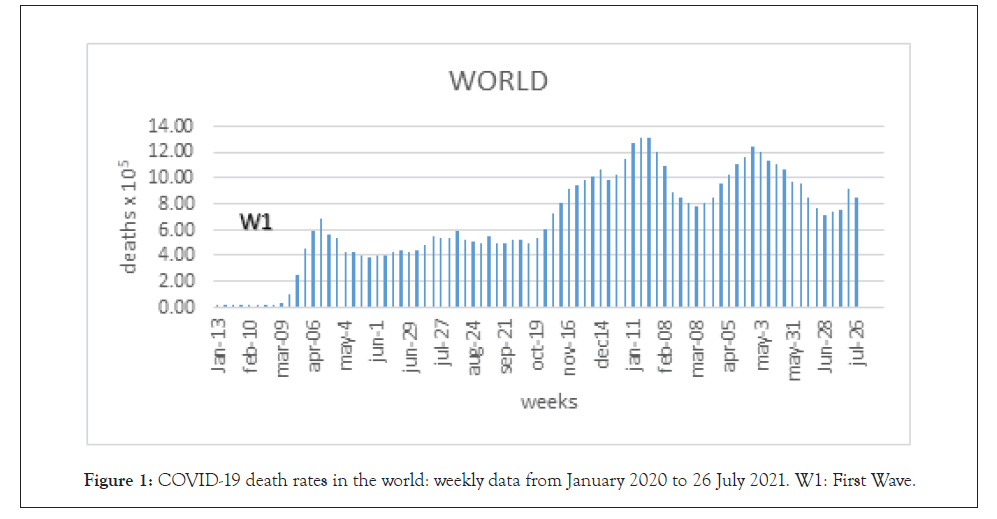
Figure 1: COVID-19 death rates in the world: weekly data from January 2020 to 26 July 2021. W1: First Wave.
The trends were different in almost all countries, and in Europe, the number of deaths/ week was less dramatic since it never exceeded 5.5 per 105 inhabitants (Figure 2).
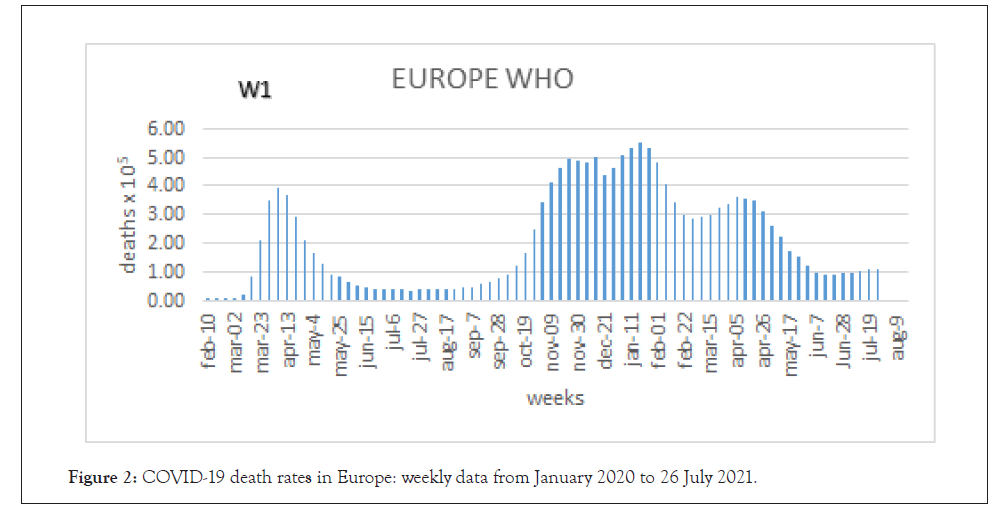
Figure 2: COVID-19 death rates in Europe: weekly data from January 2020 to 26 July 2021.
At the end of W1 in Europe (Figure 2), during the months between June and August 2020, there was a clear flattening in the death rate curve, which gave the impression the pandemic was under control. Considering the death rate from August 2020 to 26 July 2021 in the 47 European countries considered, which excluded Russia (taken separately), Belarus, and Kazakhstan, the number of deaths per week did not exceed 0.28 per 105 inhabitants (Figure 3).
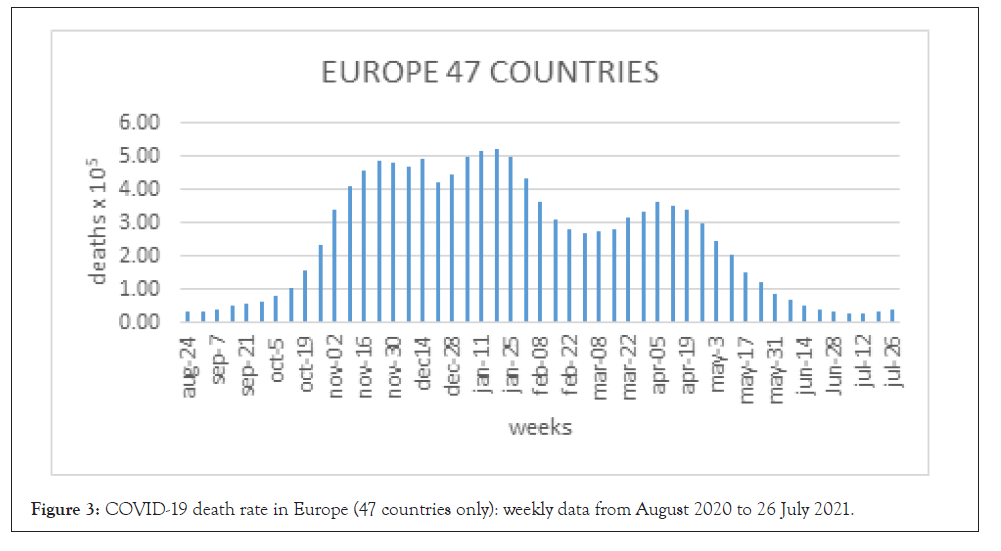
Figure 3: COVID-19 death rate in Europe (47 countries only): weekly data from August 2020 to 26 July 2021.
During the same period, countries such as the USA (Figure 4), India (Figure 5), Brazil (Figure 6), Russia (Figure 7), and Mexico (Figure 8) experienced a much higher number of deaths/week/ inhabitants, and these countries were able to “export” COVID-19, since insufficient measures were taken to prevent it from being spread abroad [1,2]. The consequence was that the number of COVID-19 cases started to grow again in Europe, causing a much higher number of deaths than during the first wave (W1).
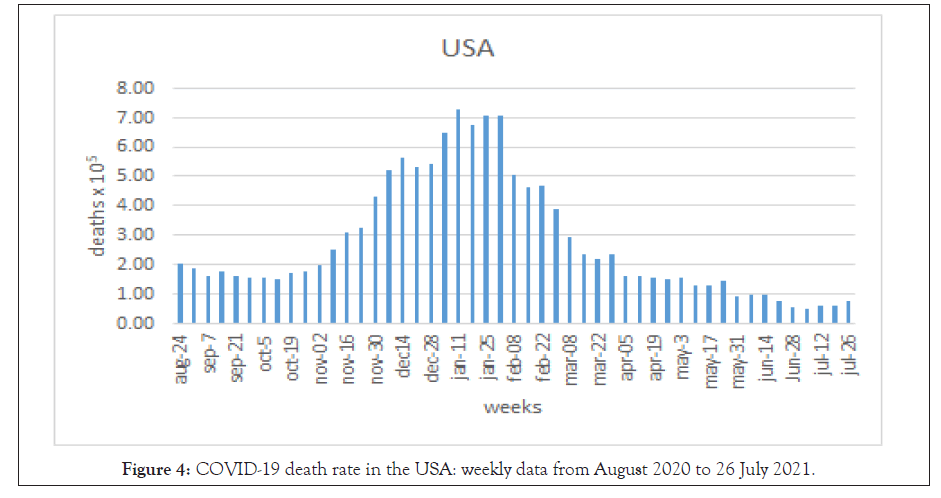
Figure 4: COVID-19 death rate in the USA: weekly data from August 2020 to 26 July 2021.
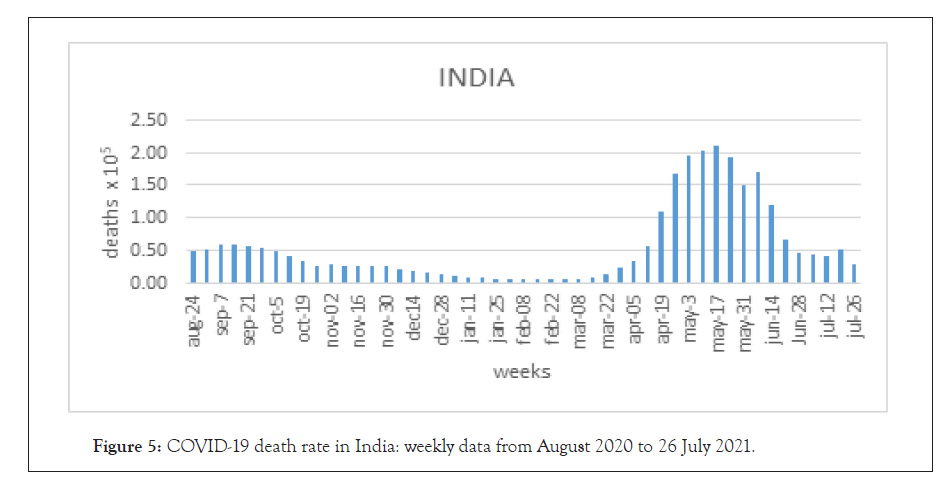
Figure 5: COVID-19 death rate in India: weekly data from August 2020 to 26 July 2021.
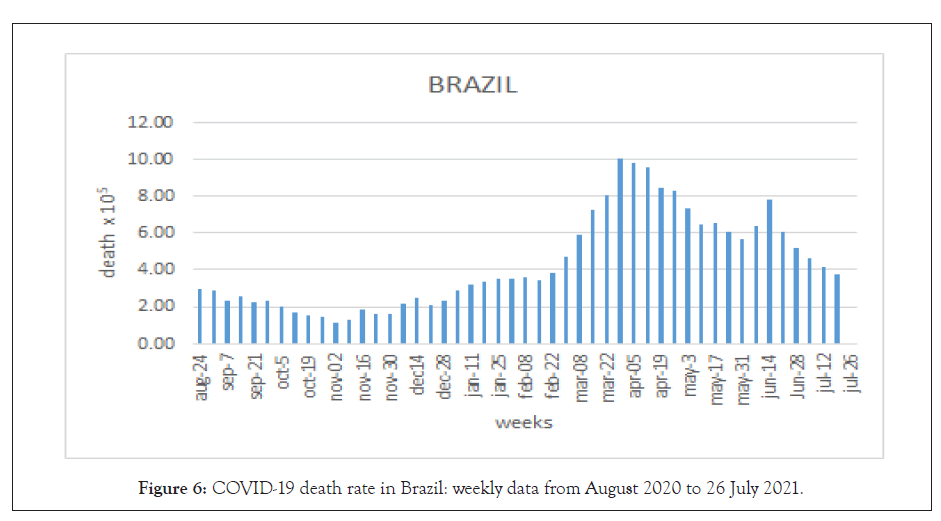
Figure 6: COVID-19 death rate in Brazil: weekly data from August 2020 to 26 July 2021.
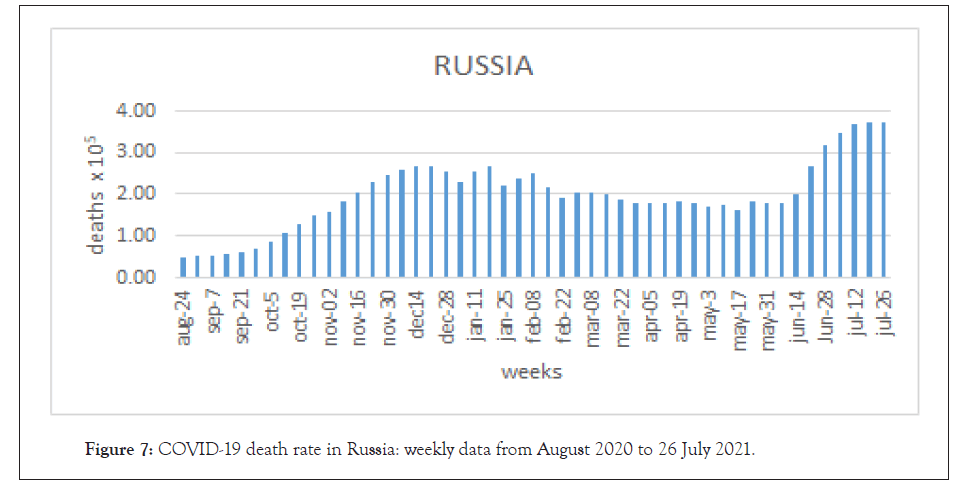
Figure 7: COVID-19 death rate in Russia: weekly data from August 2020 to 26 July 2021.
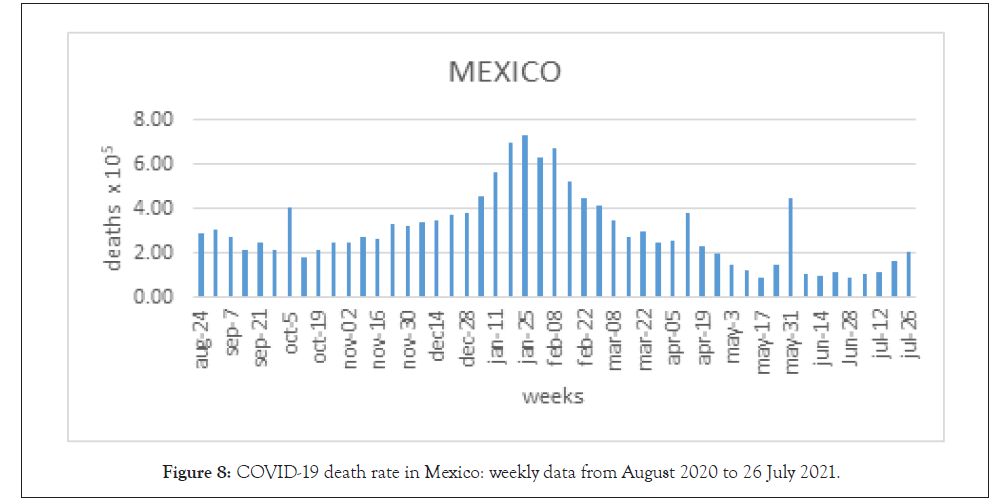
Figure 8: COVID-19 death rate in Mexico: weekly data from August 2020 to 26 July 2021.
The vaccination programmer in Europe started in December 2020/ January 2021, and a clear drop in the number of deaths occurred in most countries, in keeping with the effect of the different vaccinations. It however became evident that vaccinations were not sufficient on their own to eliminate viral spread [2].
During the period considered in this study, death rates are still high in some countries, such as Brazil, Russia, and Mexico, probably because these countries are far from achieving herd immunity (Table 1). Contrary to common belief about the Delta (or Indian) variant, India seems to be much less affected despite the lowest number of vaccinations.
| Country | Vaccine coverage × 103 inhabitants at June 25 2021* | Deaths rate × 105 inhabitants at July 26 2021 |
|---|---|---|
| Europe | 930 | 0.36 |
| USA | 1084 | 0.77 |
| India | 320 | 0.28 |
| Brazil | 638 | 3.4 |
| Russia | 392 | 3.73 |
| Mexico | 522 | 2.03 |
*: Last data available in WHO records
Table 1: Vaccine shots per 103 inhabitants in various countries and deaths per 105 inhabitants.
Despite the effort made by the local Russian Health Authorities and the early start to the vaccination programme (December 2020), there was a sudden dramatic increase in the number of deaths after an initial slow fall (Figure 13), with a small decrease in the last few weeks.
The aim of this study was to analyses the death rate due to COVID-19 in 52 countries (47 European countries, the USA, Russia, India, Brazil, and Mexico) during the period when the Delta variant was considered the most common form. The relationship between the number of vaccination shots administered, LEEDELS variables and defence expenditure was also analysed.
Materials and Methods
The death rate per 103 inhabitants due to COVID-19 was calculated on a weekly basis using the data available from the WHO Coronavirus Dashboard [3]. A total of 52 countries were considered. The time period analysed went from 21 December 2020 (before the vaccination programme) up to 26 July 2021.
The cases/death ratio was calculated considering a three-week lag between infection and death. The LEEDELS data (life expectancy, ecological, demographic and lifestyle variables) for 2020 were taken from the Atlante Geografico De Agostini, the CIA World FactBook 2020-2021, and Life expectancy in the World [4-6]. The Defence expenditure was also considered.
The LEEDELS data consist of:
Life expectancy (years)
65 years+/other population, or old age dependency
Population density (inhabitants/Km2)
Urban population (% of inhabitants in cities)
GDP (Gross Domestic Product in USD)
Defence expenditure (% of GDP)
Education (% of GDP)
Hospital beds (number of beds/1000 inhabitants)
Particulate matter (PM 2.5-10 mg/m3)
Cars (number of cars/1000 inhabitants)
Mobile phones (number of mobile phones/1000 inhabitants)
Internet (number of connections/1000 inhabitants).
Statistical evaluation
Mean values and standard deviations were calculated for all the LEEDELS data. Spearman's ρ was used to assess any correlation between deaths and vaccinations. The trends in the curves were calculated using Prediction Profiler analysis. All the analyses were done using JMP14 Pro software produced by the SAS institute.
Results
Death ratio
The death ratio × 103 inhabitants (deaths/positive case) for Europe, the USA, India, Russia, Brazil, and Mexico are shown in Figures 9-14 respectively.
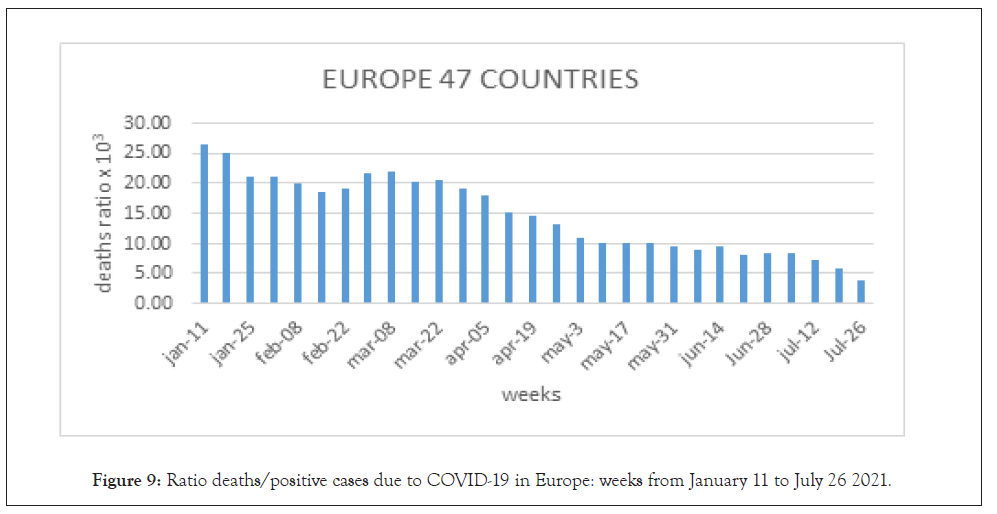
Figure 9: Ratio deaths/positive cases due to COVID-19 in Europe: weeks from January 11 to July 26 2021.
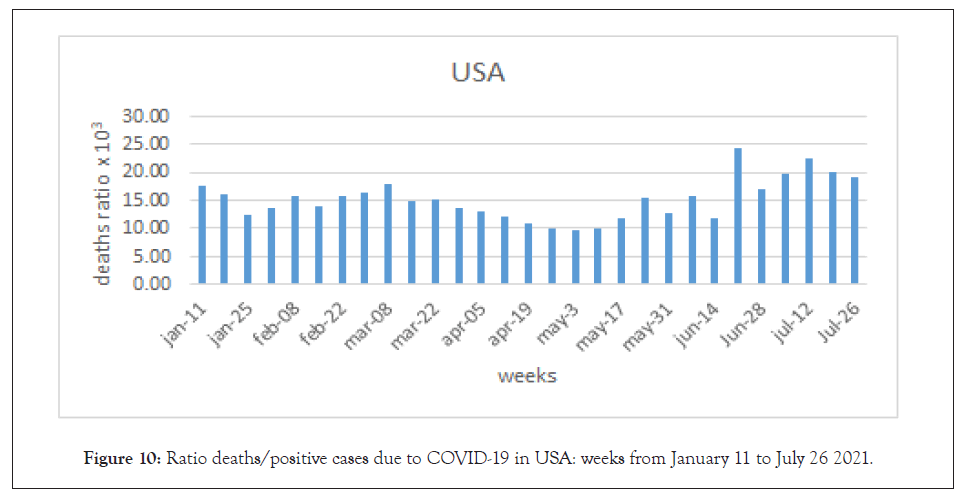
Figure 10: Ratio deaths/positive cases due to COVID-19 in USA: weeks from January 11 to July 26 2021.
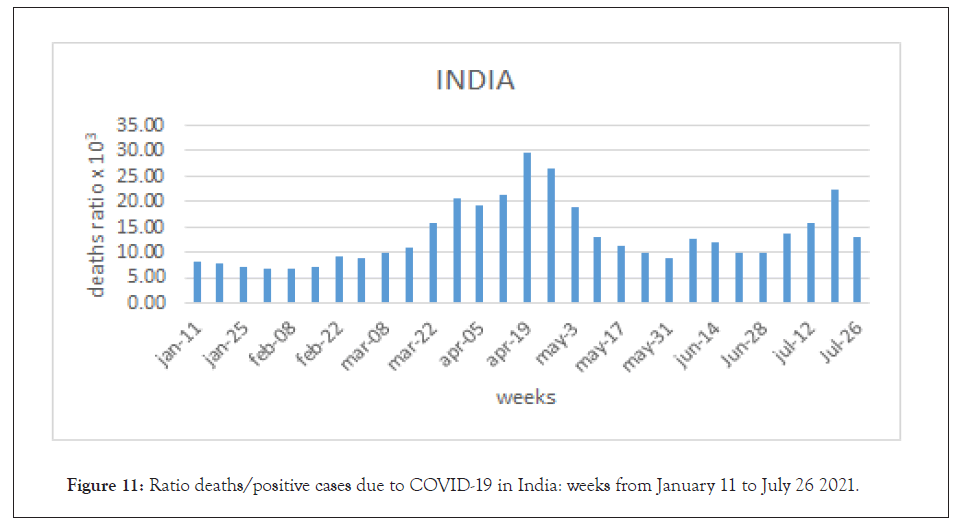
Figure 11: Ratio deaths/positive cases due to COVID-19 in India: weeks from January 11 to July 26 2021.
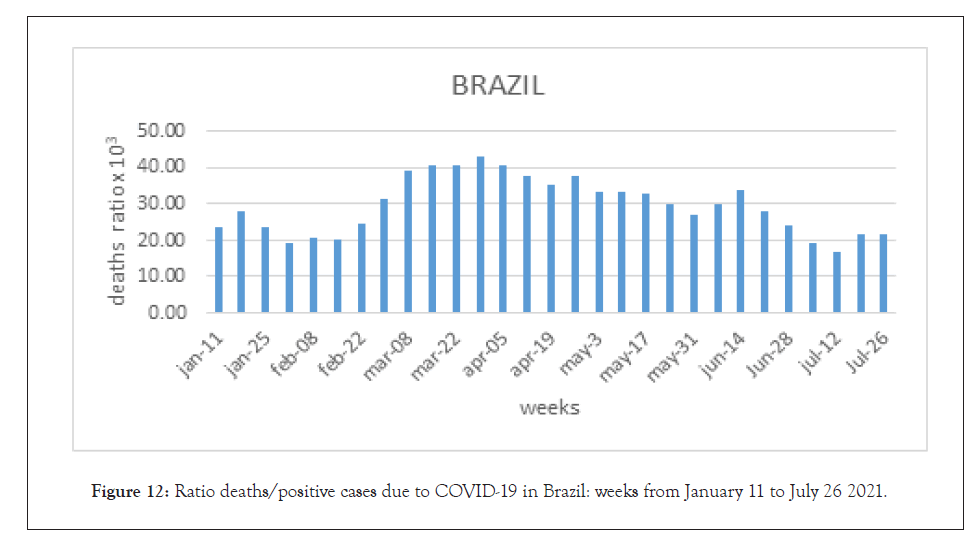
Figure 12: Ratio deaths/positive cases due to COVID-19 in Brazil: weeks from January 11 to July 26 2021.
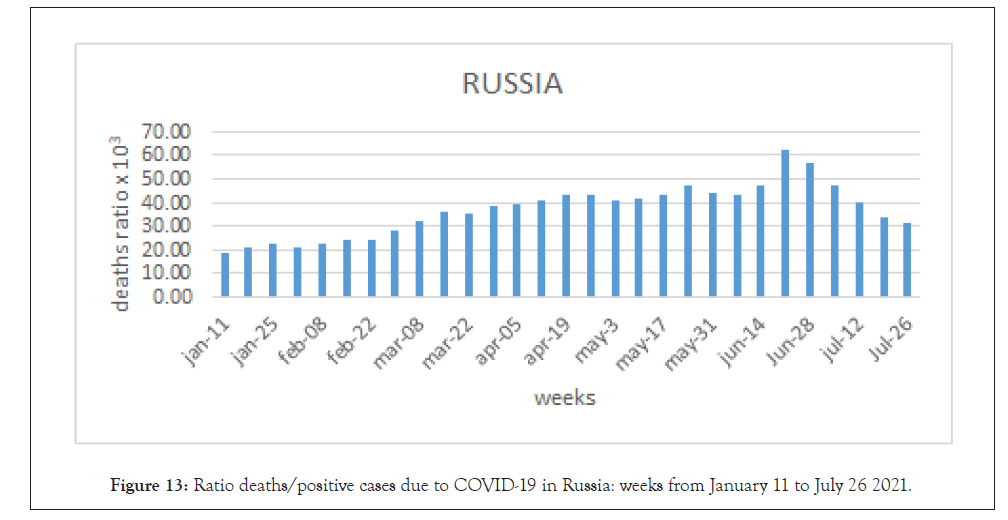
Figure 13: Ratio deaths/positive cases due to COVID-19 in Russia: weeks from January 11 to July 26 2021.
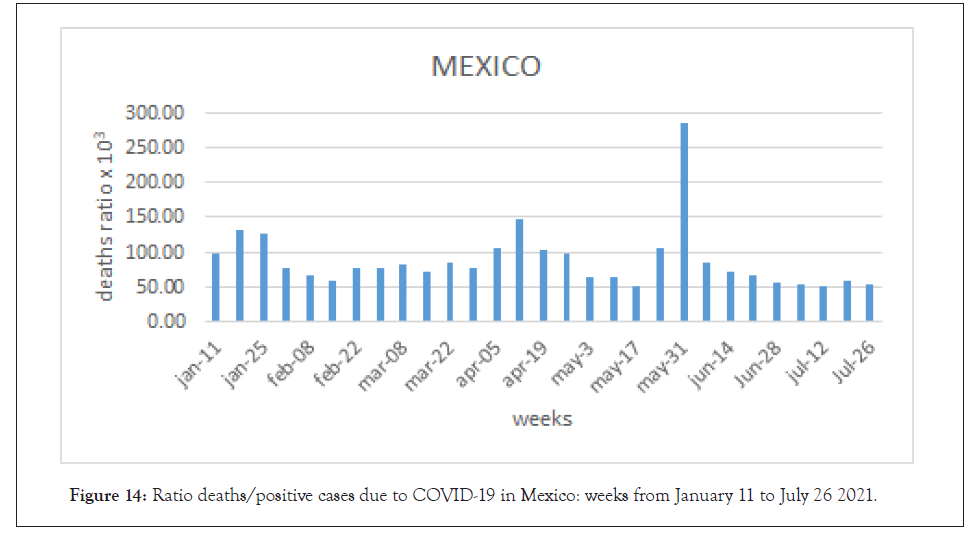
Figure 14: Ratio deaths/positive cases due to COVID-19 in Mexico: weeks from January 11 to July 26 2021.
The death ratio curves are different in each country, and the ratios were very variable following the start of the vaccination programme, with fluctuations mostly characterized by an initial increase (except India). Considering only the weeks of July 2021, the data in the countries studied also behaves very differently (Table 2).
| Country | Weekly deaths ratio x 103 positive cases | |||
|---|---|---|---|---|
| Jul-05 | Jul-12 | Jul-19 | Jul-26 | |
| Europe | 8.27 | 7.29 | 5.88 | 3.91 |
| USA | 19.82 | 22.52 | 20.09 | 19.03 |
| India | 13.65 | 15.86 | 22.23 | 13.02 |
| Brazil | 19.27 | 16.71 | 21.78 | 21.38 |
| Russia | 46.95 | 40.29 | 34.14 | 31.78 |
| Mexico | 54.54 | 50.35 | 58.99 | 54.94 |
Table 2: Weekly death ratio (deaths/positive cases) from 5 to 26 July 2021.
Europe seems to be the most protected, Russia and Mexico recorded the highest values, with respectively about 10 ad 15 times higher death ratio than Europe. This may be due both to a different variant of the virus and the low vaccine coverage. The relationship between vaccinations, LEEDELS and defence expenditure are reported in Table 3.
| Variable | Unit | Spearman's ρ | ρ |
|---|---|---|---|
| Life expectancy | years | 0.8446 | <0.001 |
| Old age dependency | %>65 years | 0.1796 | > 0.05 |
| Population density | Inhabitants/km2 | 0.4353 | <0.01 |
| Urban population | % inhabitants in cities | 0.5536 | <0.001 |
| Gross Domestic Product (GDP) | USD | 0.553 | <0.001 |
| Education | % of GDP | 0.344 | > 0.05 |
| Hospital beds | % of GDP | -0.0451 | > 0.05 |
| Defence expenditure | % of GDP | -0.4418 | <0.01 |
| Particulate Matter (PM) | 2.5-10 mgm3 | -0.194 | > 0.05 |
| Cars | Number/103 inhabitants | 0.7108 | <0.001 |
| Mobile phones | Number/103 inhabitants | 0.0938 | > 0.05 |
| Internet | Number/103 inhabitants | 0.4565 | <0.01 |
Table 3: Correlation between LEEDELS and vaccination shots and Correlation between number of vaccination doses, LEEDELS variables and defence expenditure.
Life expectancy and the variables connected with wealth are significantly correlated to the number of shots administered. Population density and urban population are consistent with much easier access to vaccine clinics. Among the negatively correlated variables, the only statistically significant one is defence expenditure.
Discussion
The main limitation of these data is the number of countries that were considered, which account for only a part of the world. However, the aim was to compare Europe (European Council countries) with countries with a high number of inhabitants that reported much higher death rates in August 2020, when the pandemic seemed to be under control in Europe.
A further limitation lies in the deaths/positive cases ratio, which was calculated considering a three-week lag. This length of time was arbitrarily chosen as the average time it takes to go from infection to death. The lack of precise figures on the Delta variant is another limitation. However, according to the information available, it was taken as the main variant, particularly in the most recent stage of the pandemic.
Despite these limitations some interesting conclusions can be drawn from this study. Vaccination is confirmed as an important means of tackling the pandemic, but it is not sufficient alone. The trend in the various countries is not yet under control, since no clear decrease is occurring (Table 2), and -except in Europe where there are about 4 deaths per 105 infected cases/week-all the countries analysed report significantly much higher deaths per 103 infected cases/week.
One may not exclude that the therapy for COVID-19 can be different in each country despite the common protocols available in the literature. However, the differences among countries are very consistent.
In other words, Europe may still “import” the virus, regardless of the variant, as happened at the end of the first wave. The USA, Brazil, India, Russia, and Mexico may still “export” the virus and measures should be taken to prevent this from occurring. Vaccine specificity for a given variant does not seem to be a real issue, since the percentage of protection from death is considered sufficient for all the most common variants [7].
Vaccination is the simplest measure available, although it does not completely solve the pandemic, and it seems that more than two shots may be needed for complete coverage. However, the various clinically important variants around are controlled by vaccination at the moment. More effort should be put into determining the characteristics of the “non-lethal variants” which are currently the most frequent in terms of numbers and are probably compatible with humans as part of our metaorganism. The Delta drift appears to be more a matter of “viral fashion” than a severe threat since in India, at July 26, shows much lower figures than Russia or Mexico (Table 2), despite the lowest rate of vaccinations
Regarding vaccinations, it has become clear that more effort should be devoted to this measure since it has been seen to be affected by the resources available in the various countries. On the subject of the LEEDELS variables, the positively correlated ones are linked to wealth whereas defence expenditure is instead the only negatively correlated one. In the end, the real issue is to use the available resources properly. Besides COVID-19, the media are turning their attention to climate change and war, which are more infectious than the pandemic. Despite all this dramatic evidence, the world still seems more concerned with providing guns.
Conclusion
The COVID-19 pandemic is still not under control, and vaccination seems the only way to tackle the problem, although it cannot be used alone. It is reasonable to expect other variants besides the Delta variant to arise, until hopefully a non-lethal variant becomes part of our metaorganism.
Funding
This research received no financial support.
Conflict of Interest
There are no conflicts of interest.
Ethical Statement
This manuscript is original, has not been published before, and is not being considered for publication elsewhere.
REFERENCES
- Cornelli U, Belcaro G, Recchia M. COVID-19 Vaccination: hopes and facts to cover incompetence. J Bacteriol Parasitol. 2021;12(3):1-22.
- Cornelli U, Belcaro G, Recchia M (2021) The many waves of COVID-19 in European countries. (1st edn), Lambert Academic Publishing, Saarbrücken, Saarland, Germany.
- WHO Coronavirus (COVID-19) Dashboard. World Health Organization. 2021.
- Geographical Atlas De Agostini 2020 Deluxe Edition. DeA Planeta Libri. 2020.
- Central Intelligence Agency. The CIA world factbook 2020-2021. Skyhorse Publishing, New York, USA, 2020.
- Life expectancy in the World Population. Worlddometer. 2021.
- Bernal JL, Andrews N, Gower C, Gallagher E, Simmons R, Thelwall S, et al. Effectiveness of covid-19 vaccines against the B.1.617.2 (Delta) variant. New Engl J Med. 2021;1(1):1-7.
Citation: Cornelli U (2021) The Delta Variant: The Choice between Spreading Vaccines or Guns. J Bacteriol Parasitol. S11: 001.
Copyright: © 2021 Cornelli U. This is an open-access article distributed under the terms of the Creative Commons Attribution License, which permits unrestricted use, distribution, and reproduction in any medium, provided the original author and source are credited.
