


Indexed In
- CiteFactor
- RefSeek
- Directory of Research Journal Indexing (DRJI)
- Hamdard University
- EBSCO A-Z
- Scholarsteer
- Publons
- Euro Pub
- Google Scholar
Useful Links
Share This Page
Journal Flyer

Open Access Journals
- Agri and Aquaculture
- Biochemistry
- Bioinformatics & Systems Biology
- Business & Management
- Chemistry
- Clinical Sciences
- Engineering
- Food & Nutrition
- General Science
- Genetics & Molecular Biology
- Immunology & Microbiology
- Medical Sciences
- Neuroscience & Psychology
- Nursing & Health Care
- Pharmaceutical Sciences
Research Article - (2023) Volume 11, Issue 2
Symmetry Breaking as "Master Switch" for Agglomeration Policy
Akifumi Kuchiki1* and Hideyoshi Sakai22Department of Liberal Arts, Hiroshima City University, Hiroshima, Japan
Received: 20-Apr-2023, Manuscript No. RPAM-23-21094; Editor assigned: 24-Apr-2023, Pre QC No. RPAM-23-21094(PQ); Reviewed: 08-May-2023, QC No. RPAM-23-21094; Revised: 15-May-2023, Manuscript No. RPAM-23-21094(R); Published: 22-May-2023, DOI: 10.35248/2315-7844.23.11.392
Abstract
An agglomeration is an organization composed of segments that can be classified into the four categories of infrastructure, institutions, human resources and living conditions. The master switch for agglomeration policy is the construction of segments that satisfy the ‘symmetry breaking’ conditions in a monopolistic framework within new economic geography. We use symmetry breaking conditions derived from the synthesized general equilibrium model of Krugman and Alonso using quasi-linear log utility. The activation of the master switch in the construction of an urban agglomeration can break the symmetry equilibrium, leading to a cumulative process of agglomeration segment construction. In the case of an urban agglomeration such as Sapporo, Japan, the segments constituting the master switch are the development of the area surrounding Sapporo Station to lower the elasticity of substitution between any two varieties and Japan Railway reconstruction and the revision of its timetable to lower the commuting costs.
Keywords
Krugman’s general equilibrium model; Central Business District (CBD); Segments of an urban agglomeration; Master switch; Symmetry breaking
Introduction
Agglomeration policy has provided an effective methodology for regional development in Asia. Asia is regarded as the global growth center for the 21st century due to the recent rapid development of industrial districts for manufacturing industries, particularly since the 1980s [1]. However, many regions across the globe have attempted to construct of agglomerations, although these are yet to be completed.
With regard to institutional theory for technology-based economies, theoretical concepts tend to be related to organization fields and context [2]. For example, Hall and Jones conclude that institutions, including laws and regulations such as tax systems, in the organization fields are as important to economic development as are endowments such as physical and human resources [3]. An agglomeration is an organization that has a specific objective and is composed of the above segments of institutions and endowments.
We classify the segments of an agglomeration into the four categories of physical infrastructure, institutions, human resources, and living conditions. The segments comprising an agglomeration differ according to the type of agglomeration; that is, urban city, information communication technology industry, tourism industry, or manufacturing industry, as shown in Appendix Tables A1, A2, A3, and A4, respectively.
Kanai and Ishida highlighted the importance of cumulative processes as the construction of the segments of an agglomeration is both time-consuming and funding-reliant [4]. Fujita and Kuchiki and Kuchiki, Mizobe and Gokan applied the flowchart approach to the development of cumulative processes [5,6]. Architectural theory in sequencing economics on agglomeration by Kuchiki focuses on the processes and seeks to find the optimum sequencing for efficient segment construction [7]. According to Kuchiki, the concept of ‘economies of sequence’ is defined as the sequencing of any two segments from among the set of segments that constitute an agglomeration toward the efficient construction of that agglomeration [8].
With respect to the symmetry breaking conditions of equilibrium, the model of Fujita, Krugman, and Venables suggested that the growing integration of the European market could break the symmetry of Europe’s multiple-industry geography, leading to a “cumulative” process of concentration that produces Americanstyle concentricity [9]. Kuchiki suggested that policymakers must satisfy the conditions of location as the location of a region is an initial condition for policymakers within the region [10]. The symmetry breaking conditions in spatial economics are the initial conditions, or the master switch for agglomeration policy. Accordingly, the segments for satisfying the conditions are the segments constituting the first order in their sequencing.
The relation between the segments that satisfy the symmetry breaking conditions as the master switch for sequencing the segments of an agglomeration toward their efficient construction is shown in Table 1. Kuchiki used the symmetry breaking conditions derived from the model of Henkel in central place theory [10,11]. The model is a “partial equilibrium” analysis of a tourism industry agglomeration in spatial economics.
| S.no | The Condition of Symmetry Breaking | |
|---|---|---|
| 1 | General Equilibrium Model | Partial Equilibrium Model |
| Krugman (1991) | Henkal et al. (2000) in central place theory | |
| Urban agglomeration (Central business districts) |
Tourism industry agglomeration | |
| This paper | Kuchiki (2021 b) | |
| 2 | Master Switch for Agglomeration Policy | |
| Four Categories of Segments: Infrastructure, institutions etc. | ||
| 1. To lower the elasticity of substitution of the differentiated goods | 1. To lower the elasticity of substitution of the differentiated goods | |
| 2. To reduce commuting costs | 2. To reduce transport costs | |
| 3 | A Cumulative Process of Concentration Begins | |
Table 1: Master switch for agglomeration policy [34].
However, the symmetry breaking conditions derived from the “general equilibrium” model in a monocentric city setting have not yet been applied in the cumulative process of agglomeration.
The purpose of this paper is to examine whether activating the master switch of an urban agglomeration can break the symmetry equilibrium, leading the cumulative process of segment construction in an urban agglomeration, as shown in Figure 1.

Figure 1: Hypothesis on master switch and symmetry breaking. Author’s illustration based on Tables 2, 3, 4 and Appendix Table B1.
| Hypothesis | Lag years | F-Test | p-value | Period | Order of difference |
|---|---|---|---|---|---|
| (t) Pop. of Sapporo causes (h) Passengers at JR Sapporo |
4 | 13.275 | 0.001316** | 2004-2019 | Zero order |
| 2 | 7.3823 | 0.004558** | 2005-2019 | First order | |
| (t) Pop. of Sapporo causes (p) Pop. of Ebetsu |
3 | 5.8582 | 0.00195*** | 1990-2019 | Zero order |
| 2 | 4.1466 | 0.02209** | 1991-2019 | First order | |
| (p) Pop. of Ebetsu causes (h) Passengers at JR Sapporo |
5 | 17.116 | 0.05612* | 2004-2019 | Zero order |
| 4 | 6.3083 | 0.02427* | 2005-2019 | First order | |
| (t) Pop. of Sapporo causes (s) Pop. of Ishikari |
1 | 4.8565 | 0.03183* | 1990-2019 | Zero order |
| 1 | 3.79 | 0.05697* | 1991-2019 | First order |
Source: Author’s calculation (See appendix data table); ***Significant at the 0 percent level; **Significant at the 1 percent level; *Significant at the 5 percent level
Table 2: Granger causality tests on the population of sapporo city.
| Hypothesis | Lag years | F-Test | p-value | Period | Order of difference |
|---|---|---|---|---|---|
| (h) Passengers at JR Sapporo causes (r) Pop. of Otaru |
1 | 12.67 | 0.001458** | 2004-2019 | Zero order |
| 3 | 6.7457 | 0.006435** | 2005-2019 | First order | |
| (h) Passengers at JR Sapporo causes (p) Pop. of Ebetsu |
3 | 7.6858 | 0.002823*** | 2004-2019 | Zero order |
| 1 | 16.781 | 0.0004129*** | 2005-2019 | First order | |
| (h) Passengers at JR Sapporo causes (q) Pop. of Kitahiroshima |
5 | 17.258 | 0.05567* | 2004-2019 | Zero order |
| 2 | 4.2681 | 0.0304* | 2005-2019 | First order | |
| (h) Passengers at JR Sapporo causes (g) Tourists to Sapporo City |
2 | 8.0477 | 0.003186** | 2005-2019 | Zero order |
| 3 | 4.76 | 0.02598* | 2006-2019 | First order | |
| (h) Passengers at JR Sapporo causes (d) Passengers at Otaru |
1 | 11.764 | 0.00219** | 2005-2019 | Zero order |
| 3 | 10.627 | 0.00188** | 2006-2019 | First order |
Source: Author’s calculation (See appendix data table); ***Significant at the 0 percent level; **Significant at the 1 percent level; *Significant at the 5 percent level
Table 3: Granger causality tests on passengers of Sapporo city.
| Coefficients | p-value | Adjusted R-squared | Period | |
|---|---|---|---|---|
| (h) Passengers at JR Sapporo Intercept (r) Pop. of Otaru |
2,71,861 | 5.10e-14*** | 0.9404 | 2004-2019 |
| -1.5589 | 3.52e-10 *** | |||
| (h) Passengers at Sapporo Intercept (p) Pop. of Esabetsu |
1,52,030 | 2e-16*** | 0.907 | 2004-2019 |
| -0.33357 | 0.0000000081 *** | |||
| (h) Passengers at Sapporo Intercept (q) Pop. of Kitahiroshima |
72,627 | 2e-16*** | 0.8268 | 2004-2019 |
| -0.13915 | 0.000000652 ** |
Source: Author’s calculation (See appendix data table)
***Significant at the 0 percent level
Table 4: Linear regression analyses on passengers at Sapporo station.
Krugman developed a two-region general equilibrium model in a monopolistic framework, using Cobb-Douglas utility. Alonso developed a monocentric city where consumers use space for housing at a location and commute to the city center, and then Tabuchi synthesized Krugman and Alonso [12,13]. Sato, et al. in Chapter 6 applied the quasi-linear log utility proposed by Pflüger to Tabuchi and introduced the proposition of symmetry breaking conditions derived from Krugman’s synthesized general equilibrium model [14-16]. This paper derives and applies the corollary of the proposition to the notion of a master switch.
This paper takes the Sapporo City urban agglomeration as a case study, with Granger causality testing, dummy variable method, and regression analyses used to identify the segments constituting the master switch for construction of an urban agglomeration.
As shown in Figure 1, the master switch can be presented as follows; the segment comprising the first order is the development of the area surrounding Sapporo Station to lower the elasticity of substitution between any two varieties, while those of the second order are the local Japan Railways system reconstruction and revision of the timetable for Sapporo Station to reduce commuting costs.
Literature Review
Sapporo city
A return to the urban cities of Tokyo Metropolitan, Yokohama City, Osaka City, Nagoya City, and Sapporo City has been proceeding since 1995 in Japan [17]. One of the main factors driving this phenomenon is the increase in residents living in highrise buildings.
The geographic factors related to Sapporo City, Japan, can be summarized as follows. The island of Hokkaido occupied about 22% of the total land area of Japan in 2020, and Sapporo City, the capital of Hokkaido, is listed sixteenth in terms land area [18].
The indices of an urban agglomeration are the size of population and the Gross Regional Product (GRP). In terms of population, apart from Tokyo Metropolitan in 2013, Yokohama City was first at 3.70 million people. Second and third were Osaka City and Nagoya City at 2.68 and 2.27 million people, respectively. Sapporo City was ranked fourth at 1.93 million people. In 2021, the population of Sapporo City was again fourth at 1.97 million people, behind Nagoya at 2.33 million people [19].
Among the 4 cities mentioned above, the GRP of Osaka City was first at 18,736 billion yen in 2013. The second and third were Yokohama City and Nagoya City at 12,339 and 12, 319 billion yen. The GRP of Sapporo City was ranked fourth at 6,489 billion yen [20].
In summary, Sapporo City is fourth, both in terms of population and GRP, behind Yokohama City, Osaka City, and Nagoya City. Sapporo City is the CBD (Central Business District) of the urban agglomeration in Hokkaido.
In 1998, Sapporo City implemented the fourth Sapporo Long term Comprehensive Plan 2000-2020 [21]. The Sapporo Station South Exit Development Project led to the development of a large commercial complex facility in three blocks at the west, center, and east of the station, consisting of department stores, a cinema complex, hotels, offices, and so on by 2003. The project was taken over Sapporo Station General Development Co., Ltd together with two other agencies in 2005.
Airport Express trains that travel at a speed of more than 130 km/h began operation in 2002. The timetable from New Chitose Airport to Sapporo Station was revised to introduce these express trains in 2004, and the station was reconstructed for that purpose in the same year [22]. These changes reduced the commuting costs of passengers using Sapporo Station.
The paper analyzes four or the six satellite cities surrounding Sapporo City; Otaru City, Ebetsu City, Kitahiroshima City, and Ishikari. The distances from the stations of those cities to Sapporo City are 33.4 Km, 21 Km, 27.5 Km, and 21.8 Km, respectively. It is noted that the population in each of the four cities decreased from 2004 to 2020.
Chuo district in Sapporo city
Sapporo City consists of 10 districts. The population of Minami District decreased from the end of March 1999 to the end of 2009, while that of each of the other districts increased, particularly that of Chuo District [23]. The average population of Sapporo City from the beginning of October 1998 to the beginning of October 2021 increased by 9.2%.That of Minami District decreased by 13.9%, while that of Chuo District increased by 38.6% [24]. The main population segments shifting from other cities in Hokkaido to Chuo District in Sapporo are students and the working age residents aged between 15 and 64 [25].
The rates of the increase in apartment buildings of more than 11 stories for members of ordinary households from 2000 to 2015 in the three central districts of Tokyo Metropolitan and the six central districts of Osaka City were 211.9% and 136.3%, respectively [26]. The rate for Chuo District was 175.9% due to the district’s accessibility district to exhibitions, cinemas, gyms, educational facilities, and so on.
The Sapporo Station area consists of a large underground town that is little affected by snow in winter. In 1988, all three subway lines were opened, and in 1991, the underground town was renovated [27]. The redevelopment of the underground town in 1999 was aimed at creating an agglomeration of stores selling differentiated products with low elasticity of substitution between any two varieties [28]. The area was 12,420 square meters.
The 38-story station building, JR Tower, was opened in 2003 as part of the redevelopment of the area surrounding Sapporo Station [29]. Ultra-high-rise buildings of more than 20 stories include the 22-story Nippon Life Insurance Building, 20-story Mitsui JP Building, and 27-story Sosei Square, which were opened in 2006, 2014 and 2018, respectively. The floor space available in the Chuo District is 2,740,000 square meters. There is also a commercial complex consisting of a department store, shops, offices, hotels, and a cinema complex [30].
Residential towns were developed from 1997 to 2004. Asada and Hashimoto clarified that the companies disposed of company-owned housing located around the urban core, and then condominiums were built in this area from 1995 to 2009. The total housing added in the Chuo District numbered 30,851 dwellings from 1995 to 1999, 21,547 dwellings from 2000 to 2004, and 15,574 dwellings from 2005 to 2009 [31]. The numbers of apartments and lots offered for sale totaled 191 from 1995 to 1999, 181 from 2000 to 2004, and 88 from 2005 to 2009. The phenomenon is called ‘the return of population to the urban core.
Appendix Table B1 of the dummy variable method shows that there was a high probability for the movement of populations in the four satellite cities and Sapporo City to change from 1995 and 1997, as shown in Figure 1.
Regarding the trends for Sapporo City from 1994 to 2015, the t-value for 1996 was the highest at 6.67. The highest t-values for the satellite cities were 6.91 for Otaru City in 1997, 3.05 for Ishikari City in 1997, which was the highest before 2005, and 7.09 in 1996 for Ebetsu City and 6.08 in 1997 for Kitahiroshima City. The population growth rate in Sapporo City from 1996 to 2019 was 0.46%, although the t-value changed from positive to negative in 2005 partly due to aging.
The paper examines whether the labor force agglomerated in Chuo District in Sapporo District for the following two reasons: First, the lowering of the substitution elasticity between the differentiated goods by the development of the area surrounding JR Sapporo Station, including the construction of ultra-high-rise buildings for residents and offices; and second, the reduction of commuting costs by the reconstruction of the Japan Railways and revision of the timetable for Sapporo Station [32-35].
Methodology
As Kuchiki showed, the economies of sequence can be notionally explained as follows. Suppose that there are three periods: The first, second and third [8]. Let us look at two examples, A and B, of the segment construction sequence of a manufacturing industry agglomeration. An agglomeration is supposed to consist of three segments {s1, s2, and s3}, say {a port, roads, and an industrial zone}.
The difference between A and B lies in the ordering of s2 and s3. Accordingly, A and B can be notated as follows:
A={s1, s2, and s3}={a port, roads, and an industrial zone}
B={s1, s3, and s2}={a port, an industrial zone, and roads}
The construction processes from s2 to s3 in the case of A proceeds efficiently. However, the process from s3 to s2 in the case of B stops as it is difficult to find investors. They do not move into the industrial zone as transport costs are high due to the lack of roads to link the port to the industrial zone. We can call A case B the diseconomies of sequence, while case A illustrates the economies of sequence.
The category of segments is S={physical infrastructure, institutions, human resources, and living conditions}, and the type of T is T={urban agglomeration, the information communication technology, the tourism, the manufacturing industry}, as shown in Appendix Tables A1~A4. The segments satisfy the conditions of the symmetry equilibrium are s1, or the ‘master switch’ for starting the construction of the segments of an urban agglomeration. This paper focuses on the master switch segments without discussing the other segments.
The typical situation in the case of manufacturing industry agglomerations in the 1980s in Asia, including ASEAN nations, is shown in Kuchiki [8]. We illustrate an export-oriented industrial district through ‘economies of sequence.’ The set of s1 and s2 precedes s3. The construction of the port and the roads to link the port and the industrial zone precedes the construction of the industrial zone. Foreign firms who invest in the industrial district import raw materials and export their products using the port and roads. The costs of imports and exports without the construction of the port and roads are immense. Based on the conclusions drawn from the spatial economics, we conclude that the reduction in transports costs is a precondition and that the segments required to reduce the transport costs are a switch to start the construction of the segments of the manufacturing industry agglomeration.
We derive a corollary for the interpretation of results obtained from Granger causality testing, based on the synthesis model of Krugman and Alonso using quasi-linear log utility in Sato et al. [12-14]. The proposition obtained implies that the first order in the sequencing of the segments of an urban agglomeration, or the master switch, should be given to providing the low elasticity of substitution between differentiated goods as s1 and low commuting costs as s2.
Granger causality testing identifies the ‘economies of sequence’ as follows: For the Granger causality relationship between segment x and segment y, a null hypothesis that segment x does not Grangercause segment y is rejected. We use the data for the first order difference in the original data to estimate the stationary random process of y(t) and x(t).
Model 1: y (t)=b11y(t-1)+…+b1ny(t-n)+e1,
Model 2: y(t)=b21y(t-1)+…+b2ny(t-n)+c21x(t-1)+…+c2nX(t-n)+e2, where t=1,2,…T, n<T.
The assumptions regarding disturbance terms are:
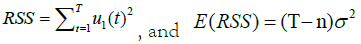
e1(t)~N(0.σ2), e2(t)~N(0,σ2), E(ei(t).ei(s))=0 (t ≠ s).
H0: all c2i0,
H1: at least one c2i ≠ 0 (i=1,2,….,n).
The Prediction Mean Squared Error (PMSE) of OLS in Model 1 is:
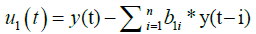
b1i*=the estimate of the coefficients of OLS (i=1,2,….n)
The Prediction Mean Squared Error (PMSE) of OLS in Model 2 is:
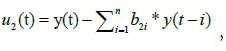
B2i*=the estimate of the coefficients of OLS (i=1,2,…n),

The test statistic of F distribution is
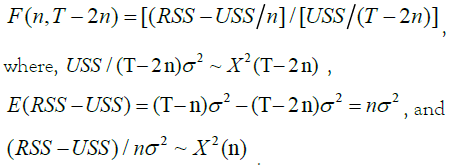
The value of RSS-USS)/p approaches zero if H0 is true. As the probability that H0 is true is small at α%, variable x Granger-causes variable y if the value of F(n, T-2n) falls within the rejection range of F distribution at the significance of α% (1%, 5%). We choose two variables based on theoretical or rational grounds.
The model
Here we derive the conditions of symmetry breaking based on the synthesized general equilibrium model of Krugman and Alonso using quasi-linear log utility of Pflüger [12,13,15]. Chapter 6 in Sato et al. obtained the proposition on the condition of symmetry breaking using the same model as Krugman except for the following three points [12,15]. First, the utility function is a semi-linear log utility instead of a Cobb-Douglas utility. Second, the budget constraint of consumers includes the variable of commuting costs (θ). Third, the model assumes land ownership (R). We add a corollary to the proposition of Chapter 6 in Sato et al. to build up a hypothesis that the construction of segments that satisfy the conditions for symmetry equilibrium breaking is the master switch in agglomeration policy [14].
As an initial condition, the model assumes a symmetric equilibrium involving an identical number of skilled workers (Lm/2) in the two central business districts. The development strategy of a region is to implement policy measures by constructing the segments of an urban agglomeration to satisfy ‘the conditions of symmetry breaking.’ We apply the corollary to interpret the results of the Granger causality testing in the next section.
The economy consists of two regions, 1 and 2, each containing a
CBD (Central Business District); here, Sapporo City and one of
its four satellite cities. There are two sectors: the modern sector
and the housing sector. There are a fixed number of two types of
workers, skilled workers (Lm) and unskilled workers (La). Skilled
workers can move freely, while every region has the same number
of unskilled workers (La/2). Each unskilled worker is endowed with
one unit of La per unit of time, supplies inelastic labor and obtains
wage revenue. The number of skilled workers in region r is  , where k is 1 and 2. Here we assume that λ1 ≡λ, and that λ1 + λ2=1.
The utility function of a representative skilled worker living in region k is given as a semi-linear log type as follows:

where Mk is a substitution function defined over a continuum of varieties of goods and services consumed and Rk is the consumption of housing space.
The model assumes that Mk is defined as:

where mrk is the consumption of goods and services, and the parameter σ describes the elasticity of substitution between any two of the varieties of goods and services, or the degree of substitutability between any two varieties. The number of differentiated products in region k is given as nk.
The respective income constraints for representative skilled workers in region 1 and region 2 are
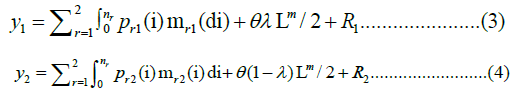
where prk (i) is the price of the goods i produced in region r and consumed in region k, θ is the cost of commuting, and Rk is the rent for a skilled worker living in region (k=1 and 2). The model supposes the public ownership of land, and the total amount of rent is equally distributed across residents in both regions. It also assumes that commuting cost is linear with distance: θλLm/2 in region 1, and θ(1-λ)Lm/2 in region 2.
We adopt the Dixit-Stiglitz framework for a monopolistic competition model (see Appendix C). This paper supposes that many firms produce a variety of differentiated goods and services, such as shopping and entertainment, including sporting events, food, etc. Each firm is monopolistic in both region 1 and region 2.
The population Lm/2 is assumed to locate in region 1 and region 2, so that λ=1/2 represents the definition of the symmetric equilibrium. We seek to derive the conditions under which the symmetric equilibrium breaks and becomes unstable. First, we suppose that the symmetric equilibrium of the two regions is stable. Second, we obtain the stability conditions for the symmetric equilibrium. Third, we derive the instability conditions under which the symmetric equilibrium breaks, using the stability conditions. From the above, a region gives the highest priority order for constructing segments that satisfy the symmetric equilibrium breaking condition.
The breaking condition of the symmetric equilibrium at λ=1/2, using Equation (A5) in Appendix C is

where v ≡ Lm / N is skilled labour ratio
Equation (5) is a quadratic in that φ has real roots between 0 and 1 for σ>1. The threshold value of the breaking conditions of the symmetric equilibrium θd is obtained by having the equation equal zero and changing the discriminant of the quadratic function φ to positive. Thus, the threshold is characterized by the function θd,
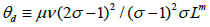
That is, when θd>θ, an agglomeration equilibrium exists with all skilled workers concentrated in one of the two CBDs 17. The inequality means that the symmetric equilibrium does not hold. A larger relative number of skilled workers λ makes the utility of region 1 higher and more attractive. Then, the larger V1 makes λ larger, and the processes by which all skilled workers are concentrated in region 1 begin.
According to Proposition 11 in Chapter 6 in Sato et al. (2011): The condition of symmetry breaking can be expressed as:
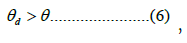
where θ is commuting costs and θd is a critical value to break the symmetric equilibrium.
Here we add corollaries as follows:
We have the two methods by which the inequality condition above can be made to hold true: (i) make θd larger, and (ii) make θ smaller.
(i) Making the varieties of goods more differentiated makes σ smaller as

as the condition for the positive equilibrium is σ>1.
(ii) A symmetric equilibrium is more likely to become unstable and break when the commuting costs, θ, are lowered as we can satisfy the condition of symmetry breaking.
The lower the degree of substitutability between differentiated varieties, and the lower the commuting costs, the more likely it is for the symmetric equilibrium to become unstable as the condition of symmetry breaking is satisfied.
The levels of θd and θ are dependent on parameters as shown in Figure 1. Change in the parameters represents the first ‘economies of sequence’ as the condition of symmetry breaking is satisfied. Construction of the segments of an agglomeration is sufficient to change the parameters.
The corollary allows us to interpret the results obtained by empirical analysis: First, the development of the area surrounding JR Sapporo Station afforded elasticity of substitution between any two varieties, σ, smaller than the one associated with the agglomeration threshold; and second, the reconstruction of the Japan Railways and its timetable revision reduced commuting costs θ.
As shown in column one of Figure 1, the results of the Granger causality testing shown in Table 3 proves the economies of sequence for the development of the area surrounding JR Sapporo Station, with the reconstruction of the Japan Railways and its timetable revision, which act to lower commuting costs, followed by the other segments. This paper finds that the two following cases related to the economies of sequence are statistically significant.
Results
This section provides a discussion of the following points in relation to the Granger causality among segments in an urban agglomeration. Residential towns in Sapporo City were developed from 1997 to 2004 as explained in Section 2. The construction of ultra-high-rise buildings for offices and housing increased the population of Sapporo City, and Granger-causes the number of passengers at Sapporo Station. Airport Express trains that travel at a higher speed began operation in 2002. The reconstruction of the Japan Railways and revision of its timetable Granger-causes the increase in the number of passengers at Sapporo Station and, thereafter, the decrease in the populations of Otaru City, Ebetsu City, Ishikari City, and Kitahiroshima City.
The segments forming the ‘master switch’ for the construction of an urban agglomeration are those that act to lower the elasticity of substitution between the differentiated goods and services (σ) and reduce commuting costs (θ), as shown in Figure 1.
The following two cases were obtained; Case 1(σ): The construction of ultra-high-rise buildings for offices and housing; Case 2 (θ): The reconstruction of the Japan Railways and its timetable revision and the development of the area surrounding area JR Sapporo Station.
Tables 1 and 2 show, that the population of Sapporo City Granger-causes passenger numbers at JR Sapporo Station, while the number of passengers at JR Sapporo Station Granger-causes the populations of Otaru City, Ebetsu City, Ishikari City, and Kitahiroshima City.
Case 1: The lowering of the elasticity of substitution between the differentiated goods: The decrease in σ led to the increase of θd as  . First, the population of Sapporo City Granger-causes the number of passengers at JR Sapporo Station per day as shown
in the second row in Table 2; Second, the population of Sapporo
City Granger-causes the populations of Ebetsu City and Ishikari
City, as shown in the fourth and eighth rows in Table 2; Third, the
population of Ebetsu City Granger-causes the number of passengers
at JR Sapporo Station per day, as shown in the sixth row in Table 2.
. First, the population of Sapporo City Granger-causes the number of passengers at JR Sapporo Station per day as shown
in the second row in Table 2; Second, the population of Sapporo
City Granger-causes the populations of Ebetsu City and Ishikari
City, as shown in the fourth and eighth rows in Table 2; Third, the
population of Ebetsu City Granger-causes the number of passengers
at JR Sapporo Station per day, as shown in the sixth row in Table 2.
Case 2: The reduction in commuting costs: The reduction in θ: the reconstruction of the Japan Railways and its timetable revision for Sapporo Station in 2004.
The results of Granger causality testing on population
Table 2 shows the results of Granger causality testing for the data of the first order difference in order to examine autocorrelation ergodicity. First, the population of Sapporo City does not Granger cause the number of passengers at JR Sapporo Station per day, with the p-value of 0.004558 considered statistically significant at n=2. Second, the population of Sapporo City does not Granger cause the population of Ebetsu City, with the p-value of 0.02209 considered statistically significant at n=2. Third, the population of Ebetsu City does not Granger-cause the population of Ebetsu City, with the p-value of 0.02427 considered statistically significant at n=4. Fourth, the population of Sapporo City does not Grangercause the population of Ishikari City, with the p-value of 0.05697 considered statistically significant at n=1.
The results of Granger causality testing on passengers
Table 3 adds the results of Granger causality testing beginning from passengers at JR Sapporo Station. First, the number of passengers at JR Sapporo Station per day does not Grangercause the population of Otaru City, with the p-value of 0.006435 considered statistically significant at n=3. Second, the number of passengers at JR Sapporo Station per day does not Granger-cause the population of Ebetsu City, with the p-value of 0.0004129 considered statistically significant at n=1. Third, the number of passengers at JR Sapporo Station per day does not Granger-cause the population of Kitahiroshima City, with the p-value of 0.0304 considered statistically significant at n=2.
The following two facts reconfirm that the first order of the development of JR Sapporo Station is key to efficiently constructing the segments of an urban agglomeration. First, the number of passengers at JR Sapporo Station per day does not Granger-cause the number of tourists to Sapporo City, with the p-value of 0.02598 considered statistically significant at n=3, and second, the number of passengers at JR Sapporo Station per day does not Granger-cause the number of passengers at JR Otaru Station per day, with the p-value of 0.00188 considered statistically significant at n=8.
We know that the population of Sapporo City Granger-causes the populations of Ishikari City and Ebetsu City as shown in Table 2. The population of Sapporo City also Granger-causes the number of passengers at JR Sapporo Station and, subsequently, the populations of Otaru City and Kitahiroshima as shown in Tables 2 and 3. In summary, the population of Sapporo City Granger-causes the number of passengers at JR Sapporo Station and, thereafter, the populations of Otaru City, Ebetsu City, and Kitahiroshima City.
First, the number of passengers at JR Sapporo per day Granger-causes the populations of Otaru City, Ebetsu City, and Kitahiroshima City as shown in the second, fourth, and sixth rows in Table 3, respectively. Second, the number of passengers at JR Sapporo per day Granger-causes tourists to Sapporo City and the population of Otaru City, as shown in the eighth and tenth rows in Table 3.
Table 4 shows that the number of passengers at JR Sapporo Station is negatively correlated with the populations of Otaru City, Ebetsu City, and Kitahiroshima City, with p-values of 3.52e-10, 8.1e-9, and 6.52e-7, respectively.
In summary, the reconstruction of the Japan Railways and its timetable revision together with the development of the area surrounding JR Sapporo Station and the construction of ultrahigh- rise buildings for offices and housing Granger-caused the agglomeration of Sapporo City.
Discussion and Conclusion
Sequencing economics examines the cumulative processes for the construction of the segments of an agglomeration to find why the process does not efficiently proceed to the next segment. We analyzed urban agglomeration segment construction from three perspectives including that of a case study, a spatial economics model, and Granger causality testing; i.e., the urban industry agglomeration in Sapporo City, Japan; a model based on spatial economics; and the Granger causality testing and dummy variable method.
We obtained the following two facts. First, the population of Sapporo City causes the number of passengers at JR Sapporo Station, and second, the number of passengers at JR Sapporo Station causes the populations of Otaru City, Ebetsu City, Kitahiroshima City, and Ishikari City among the major satellite cities surrounding Sapporo City. We found that activating the master switch of an urban agglomeration can break the symmetry equilibrium, leading to the cumulative process of segment construction of an urban agglomeration.
The approach presented by Fujita, Krugman, and Venables was expected to eventually give rise to a set of useful guidelines for actual regional, urban, and perhaps international trade policies.
The policy implications of the paper are as follows. A region must satisfy the conditions derived as the ‘master switch’ for agglomeration policy if that region plans to develop an urban agglomeration. The segments are those related to lowering the degree of substitutability between the differentiated goods and the reduction of commuting costs as given priority in spatial economics.
Hence, the master switch is the development of the area surrounding a station, including the construction of ultra-high-rise buildings for residents and offices, and the reconstruction of the railway system and subsequent timetable revision.
Kuchiki and Tsuji proposed a flowchart approach for agglomeration policy as an efficient cumulative process, which provides the summary of all cases of ‘economies of sequence.’ The economies of sequence, or Kuchiki’s ‘flowchart approach to industrial agglomeration,’ has added a new dimension to how policymaking should promote industrial hubs during the life cycle of industrial agglomerations, as described in Oqubay and Lin with regard to ‘the industrial district literature from 1985 to 2002 regarding the manufacturing industry’. However, many important issues remain for future study.
First, policy makers must determine the master switch when implementing any type of agglomeration policy. That which determines the success or failure of the policy is the master switch, and this can be seen as equivalent to the power button on a personal computer. Without pressing this switch, the policy cannot be initiated. Clear awareness of this fact is essential for agglomeration policy.
Second, the negative externality of environmental issues needs to be sequenced with reference to Sustainable Development Goals (SDGs). The necessity of attaining SDGs was particularly noted after the COVID-19 pandemic in 2019. An agglomeration can be a sustainable ecosystem; thus, we should examine whether the segments associated with sustaining the environment are sequenced in the first order.
Acknowledgment
We would like to thank Takatoshi Tabuchi and Masahisa Fujita for their comments on the draft of this paper.
Conflict of Interest Statement
No conflict of interest.
References
- Oqubay A, Lin JY, editors. The Oxford handbook of industrial hubs and economic development. Oxford University Press, USA. 2020.
- Nishizawa A, Gibson DV. Launching a tech-based economy: Similarities and differences across national context: Austin TX, USA and Tsuruoka, Japan. Int J Econ Bus Law. 2018;7(1):50-70.
- Hall RE, Jones CI. Why do some countries produce so much more output per worker than others? Q J Econ. 1999;114(1):83-116.
- Kanai K, Ishida S. Accumulation process of regional industry and entrepreneurship: Case study of Sapporo Valley. InEntrepreneurship on the Technology Frontier in the USA, the UK and Japan Working Paper, International Conference in Vanderbilt University 2000.
- Fujita, Masahisa, Kuchiki Akifumi. Asian economic regional integration from viewpoint of spatial economics. Joint Research Program Series No. 2006;138(6):73-96.
- Kuchiki A, Mizobe T, Gokan T, editors. A multi-industrial linkages approach to cluster building in East Asia. Springer. 2017.
- Kuchiki A. On ‘Economies of Sequence’in the architectural theory of agglomeration: A case of the Kyoto tourism industry. Economies. 2020;8(1):15.
- Kuchiki A. Linking spatial economics and sequencing economics for the Osaka tourism agglomeration. Reg Sci Policy Pract. 2022;14(3):610-626.
- Fujita M, Krugman P, Venables A. The spatial economy. 1999.
- Kuchiki A, Tsuji M. The flowchart approach to industrial cluster policy. Springer. 2008.
- Henkel J, Stahl K, Walz U. Coalition building in a spatial economy. J Urban Econ. 2000;47(1):136-163.
- Krugman P. Increasing returns and economic geography. J Polit Econ. 1991;99(3):483-499.
- Alonso W. Location and land use: toward a general theory of land rent. Harvard university press.1964.
- Sato Y, Tabuchi T, Yamamoto K. Kukan Keizaigaku (Spatial Economics). 2011.
- Pflüger M. A simple, analytically solvable, Chamberlinian agglomeration model. Reg Sci Urban Econ. 2004;34(5):565-573.
- Tabuchi T. Urban agglomeration and dispersion: a synthesis of Alonso and Krugman. J Urban Econ. 1998;44(3):333-351.
- Yamamoto K. Why do people gather in Osaka, Sapporo, and Fukuoka? Direction of Local Economy under Declining Population. Economic Report. 2018.
- Geospatial information authority of Japan, ministry of land, infrastructure, transport and tourism. 2021.
- Statistics bureau of Japan, ministry of internal affairs and communications. 2021.
- Prefectural economic calculation. Cabinet Office. 2016.
- 4th Sapporo City Long-Term Comprehensive Plan summary version. Sapporo City. 1998.
- Otsuka R. Can JR Hokkaido turn the "Sapporo area" into the black?. Toyokeizai Online. 2017.
- Ohashi, Yuji. Development bank of Japan hokkaido branch economic report. 2009.
- Changes in the population of Sapporo City [by ward/region]. Sapporo City. 2021.
- The 82nd Sapporo city planning council explanatory material of Sapporo City urban planning master plan review working group study status (interim report). Sapporo City. 2018.
- Maruyama M. “The social contradiction of urban residence”. Japan Association of Regional and Community Studies. 2017.
- Sapporo Toshikaihatsu Kousha. History of the underground mall. Sapporo Urban Development Public Corporation. 2023.
- Sapporo station south exit underground shopping mall redevelopment. Sapporo Station South Exit Redevelopment Project. 2023.
- KK t-glover Corporation. Sapporo station south exit development JR tower. 2021.
- Usui Y. Urban significance and challenges of station building development. Hokkaido Passenger Railway Co., Ltd. 2021.
- Kuchiki A. A flowchart approach to industrial hubs. The Oxford handbook of industrial hubs and economic development. 2020:345-380.
- Asada, M., Hashimoto, Y. Land use changes in condominium construction sites in central Sapporo: Spatial analysis using individual property data during the period of urban population growth. J Geog. 2013;87(2):14-25.
- Fujita M, Thisse JF. Does geographical agglomeration foster economic growth? And who gains and loses from it? Jpn Econ. 2003;54(2):121-145.
- Kuchiki A. The existence of economies of sequence: A theory of architecture in building an industry agglomeration. Reg Sci Policy Pract. 2019;11(3):597-612.
- Kuchiki A. ‘Sequencing economics’ on the ICT industry agglomeration for economic integration. Economies. 2021;9(1):2.
Citation: Kuchiki A, Sakai H (2023) Symmetry Breaking as “Master Switch” for Agglomeration Policy. Review Pub Administration Manag. 11:392.
Copyright: © 2023 Kuchiki A, et al. This is an open access article distributed under the terms of the Creative Commons Attribution License, which permits unrestricted use, distribution, and reproduction in any medium, provided the original author and source are credited.