Indexed In
- Open J Gate
- RefSeek
- Hamdard University
- EBSCO A-Z
- OCLC- WorldCat
- Publons
- International Scientific Indexing
- Euro Pub
- Google Scholar
Useful Links
Share This Page
Journal Flyer

Open Access Journals
- Agri and Aquaculture
- Biochemistry
- Bioinformatics & Systems Biology
- Business & Management
- Chemistry
- Clinical Sciences
- Engineering
- Food & Nutrition
- General Science
- Genetics & Molecular Biology
- Immunology & Microbiology
- Medical Sciences
- Neuroscience & Psychology
- Nursing & Health Care
- Pharmaceutical Sciences
Research Article - (2023) Volume 12, Issue 4
Study of the Pulicat Lagoon on the Basis of Deprived Vegetation and Water Area against Increased Land Surface Temperature
Raja Kumari*Received: 29-May-2023, Manuscript No. JGRS-23-21488; Editor assigned: 02-Jun-2023, Pre QC No. JGRS-23-21488 (PQ); Reviewed: 16-Jun-2023, QC No. JGRS-23-21488; Revised: 23-Jun-2023, Manuscript No. JGRS-23-21488 (R); Published: 30-Jun-2023, DOI: 10.35248/2469-4134.23.12.303
Abstract
The Pulicat located on the east coast is one of the 17 coastal lagoons of India. It is the second largest brackish water lagoon of India. The lagoon is rich in biodiversity and supports nearly 50000 populations for their livelihood. The lagoon faces acute threats by natural and anthropogenic activities in the recent years. The present study is attempted to quantify the influence of these natural and anthropogenic activities on the lagoon environment. The study is carried out for a period of 21 years from 2000 to 2021. Land Use/Cover (LULC), Normalized Difference Vegetative Index (NDVI), Normalized Difference Modified Water Index (NDMWI) and Land Surface Temperature (LST) are some of the key parameters determined and assessed in the study to indicate the level of degradation of the lagoon using directional mapping. Prediction of LULC features of the lagoon for the next decade is attempted to understand the future status of the lagoon based on the past and present scenarios. The outcome of the study is found as evidence of the various stress factors threatening the sustainability of the lagoon. Assessment of the vulnerability and adaptation capability of the lagoon environment indicated that the lagoon is inclined more towards vulnerability than adaptation scenario. The study is attempted with the aid of Remote Sensing, GIS and modeling tools.
Keywords
Land Use/Cover (LULC); Normalized Difference Vegetative Index (NDVI); Normalized Difference Modified Water Index (NDMWI); Land Surface Temperature (LST); Prediction; Directional mapping; Vulnerability; Adaptation
Introduction
Coastal lagoons are one of the most productive ecosystems in the world providing significant environmental services such as fisheries, tourism and livelihood for dependent locals. Lagoons occupy about 13% of the world’s total coastline and encompass dense human habitation areas [1-5]. Though pressure due to natural and anthropogenic activities in the lagoon has a long history, their magnitudes are steep in the recent decades. There are about 17 coastal lagoons in India of which 9 are in the West coast and 8 are in the East coast [6]. Pulicat is the second largest brackish water lagoon in India next to Chilika located in the East coast. The lagoon is dated to be evolved 6000 years ago due to Holocene sea level rise from the growth of a coastal sand barrier across the eastern side which is named as “Barrier Island”. The lagoon is shallow with large mudflats and sandflats besides fringed with discontinuous marshes. The two opening of the lagoon to the Bay of Bengal serve as the main inlets for the inflow of the seawater into the lagoon that nourish the luxuriant biodiversity (Figure1). The lagoon has rich flora and fauna diversity, which supports active inland fisheries and a large and varied bird population. Nearly 50000 people and about 52 fishing villages depend on the fisheries stock of the lagoon [7]. The International Union for the Conservation of Nature and Natural Resources (IUCN) declared the Pulicat lagoon system a Ramsar site of international importance and the World Wide Fund for Nature declared it a protected area. However the heavy siltation due to natural and anthropogenic activities has posed challenges to the physical and biological features of the lagoon [8-11]. Global Nature, a German based NGO that deals with protection of environment and nature has indicated Pulicat Lake as “Threatened Lake of the year 2010” as it is facing an ecological crisis in the form of shrinking of its area and fish dwindling due to siltation and anthropogenic activities [12-14]. Numerable studies on the LULC change, lagoon area dynamics and biodiversity degradation are attempted about the ecosystem by many researchers. Study on Vulnerability and adaptation capability of this unique ecosystem is found scarce. In the present study, the physical environmental changes of the lagoon is assessed using satellite images for the periods 2000, 2010 and 2021 using Remote Sensing and GIS techniques. To assess the changes in the environment of the lagoon, Land Use/Cover Features (LULC), Normalized Difference Vegetative index (NDVI), Normalized Modified Water Index (NDMWI) and the changes in the Land Surface Temperature (LST) are determined using appropriate spectral bands information of LISS IV, Landsat 7 and Landsat 8 images [15]. Prediction of the LULC features of the lagoon for the next decade is attempted with Land Change Modeler (LCM). Based on the obtained spatial environmental variations, the vulnerability and adaptability of the lagoon are determined. The outcome of the study will serve as an important input to the conservation and protection of the lagoon besides providing significant information for policy makers to plan suitable methods to retrieve the lost ecological richness of the lagoon.
Study Area
Pulicat Lagoon is situated about 60 km north of Chennai city and is the second largest brackish water lagoon in India. The lagoon straddles the border of Tamil Nadu and Andhra Pradesh states on the coromandal coast in South India. About 96% of the lagoon is in Andhra Pradesh and 4% in Tamil Nadu which includes the mouth of the lagoon. The northern part of the lagoon is relatively shallow than the southern part due to high siltation. The lagoon includes the Pulicat Bird Sanctuary and numerable islands formed due to siltation. The barrier island of Sriharikota separates the lake from the Bay of Bengal. Three major rivers that drain into the lagoon are the Arani River at the southern tip, the Kalangi River from the northwest and the Swarnamukhi River at the northern end in addition to few smaller streams (Figure 1). Historic records indicated an average of 461 km2 of water spread, which has shrunk to be about 350 km2 in the recent years and is still shrinking rapidly [16,17].The geographical location of the lagoon extends from 80°04’11”E to 80°20’01”E Longitude to 13°25’10”N to 14°04’21”N Latitude.
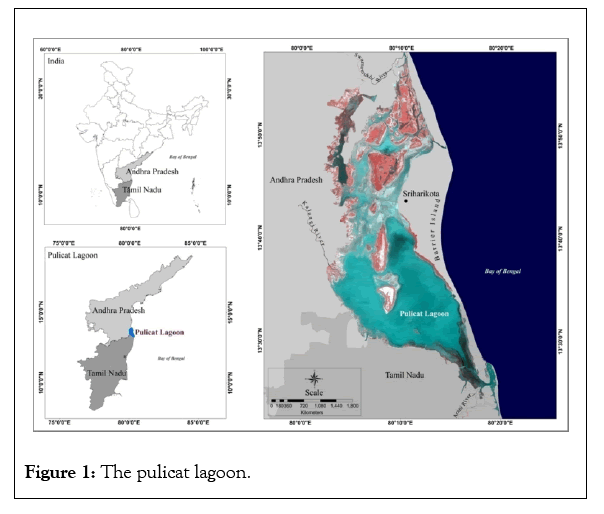
Figure 1: The pulicat lagoon.
Physiography of the pulicat lagoon
The lagoon is aligned north- south parallel to Bay of Bengal. The lagoon forms an irregular elongated shape with a length of about 61.3 km and width varies from 0.21 km to 17.7 km [18,19]. The lagoon is separated from the sea by the barrier island (Figure1). The southern part of the lagoon is relatively deeper than the northern part due to high siltation because of the road from Sullurpeta to Sriharikota that cut across the lagoon [20].
The average depth of the lagoon decreased from 1.5 m in the 20th century to 1 m in the recent years [7,18,21,22]. The lagoon has two openings, one at the south eastern end of Barrier island and the other at the northern tip of the barrier island shown in which serves as seawater exchange inlets (Figure2) [23].The lagoon is fed with fresh water by three rivers such as Swarnamukhi at the northeastern side, Kalangi in the west side and Arani in the southern side during monsoon seasons. There are about 20 islands in the lagoon with several islets composed of sand and mud.
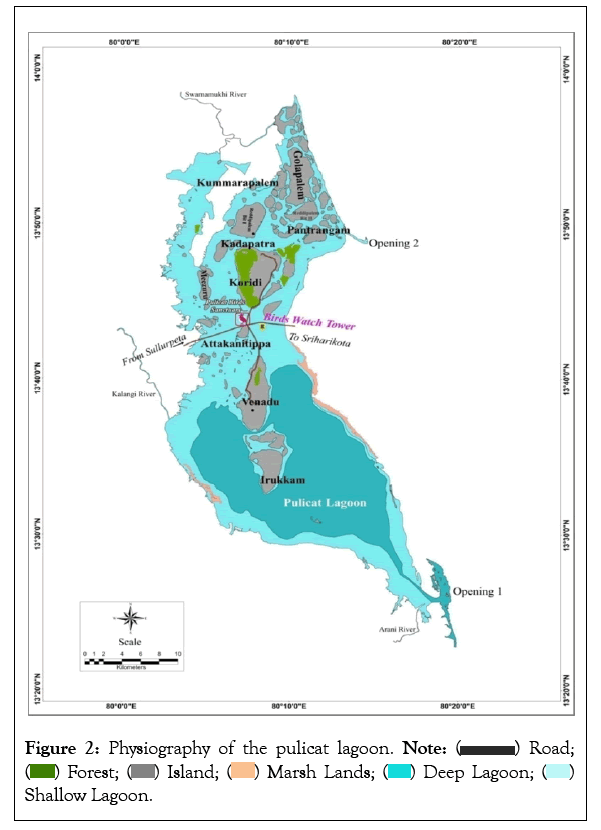
Figure 2: Physiography of the pulicat lagoon.
 Shallow Lagoon.
The significant islands in the lagoon include, Irukkam, Venadu, Attakkanitippa, Golapalem, Meezuru, Reddipalem Bit I, Reddipalem Bit II, KoridiPantrangam and Kadapatra. The islands are reported to have deposits of sub fossilized limestone. Historic reports indicated a luxuriant mangrove extent in the lagoon early between 1450 AD to 1800 AD [21]. At present only remnants of mangroves are seen in small patches at few areas in the lagoon due to increased anthropogenic activities. Nelapattu bird sanctuary famous for hosting more than 60 species of birds both native and migratory is located in the Attakanitippa Island. The fluctuation in the salinity of the lagoon between Zero during the monsoon season to about 52 ppm in the pre and post monsoon seasons is one of the major threats for the brackish nature of the lagoon [7].
Data source
In the present study, multispectral satellite images of LISS IV sensor with a spatial resolution of 5.8 m for LULC classification and Land Remote Sensing Satellite (Landsat7 and Landsat8) of National Aeronautics and Space Administration (NASA), United States of America, with a spatial resolution of 30 m for the NDVI, NDMWI and LST estimation for 2000, 2010 and 2021 are used. The month of image acquisition are taken into consideration to maintain consistency in derived features as detailed in Table 1.
| Satellite Image | Year | Month | Resolution (m) | Purpose |
|---|---|---|---|---|
| LISS IV | 2000, 2021, 2010 | March, February | 5.8 | LULC |
| Landsat 7 | 2000 | February | 30 | NDVI, LST, NDMWI |
| Landsat 8 | 2010, 2021 | March |
Table: 1 Data source for the month of image acquisition.
Methodology
Image processing of satellite images
Image processing software such as ERDAS IMAGINE 2015 and ENVI 5.5 are used for pre-processing the raw temporal satellite images considered for the study mentioned in Table 1. As part of pre-processing, the satellite images are georeferenced with known Ground Control Points (GCP’s) to relate the images to ground coordinates. The radiometric corrections using ‘Radiometric enhancement’ tool of ERDAS is used to reduce haze and noise distortions using filtering techniques. Histogram equalization is performed to improve the contrast of the images for better interpretability.
Noise removal from raw images
The noise in satellite images are the undesired data information captured in the same frequency. Noise removal is one the essential preprocessing technique to improve the quality of the captured data in a satellite image. It can be removed by applying Atmospheric Correction (AC) algorithm which transforms Top of Atmosphere (TOA) reflectance into Bottom of Atmosphere (BOA) reflectance and this correction algorithm is based on an algorithm proposed in Atmospheric/Topographic Correction for Satellite Imagery. The method provides atmospheric correction based on the LIBRA, DTRAN radiative transfer model. The model is executed to generate a large (Look up Table) LUT of sensor-specific functions required for the AC which includes atmospheric conditions, solar geometries and ground elevations. This database is generated with a high spectral resolution of about 0.6 nm and then resampled with spectral responses. This LUT is used as a simplified model to invert the radiative transfer equation and to calculate BOA reflectance. This atmospheric correction algorithm employs Lambert’s reflectance law.
Support Vector Machine (SVM) classifier
The processed LISS IV images are interpreted for different LULC features for the periods 2000, 2010 and 2020 using the Support Vector Machine classification (SVM), as this technique provides good accuracy in supervised classification [24-27]. The SVM classifier is one of the most popular supervised classification algorithm widely used for land features interpretation in ENVI software. SVM is a margin based classifier and it selects maximum separation margin between classes using kernel transformation algorithm. The method is relatively more efficient in high dimensional spaces and in cases where the number of training points is greater than samples. Further the algorithm is memory efficient as it uses a subset of training points in its classification decision function. The accuracy level is better than other classification methods such as Maximum likelihood classifier (MLC) besides being relatively memory efficient [28,29].
Prediction of LULC features
Prediction of LULC features in the lagoon for 2030 is attempted based on the past trends. Cellular Automation coupled with Markov model (CA-Markov) is used for prediction as it is the most widely used tool for land features prediction in Land Change Modeler (LCM) software [30-32]. Land change modeler is an effective land planning and decision support system which simplies change analysis complexities. The method analyzes land feature changes using system derived pixel based conversions. The model has two components the determination of the temporal dynamics of the land features on pixel-by-pixel basis by Markov approach and the prediction of future dynamics both spatially and temporally based on the set of rules and probabilities generated by the first component of the model. The predicted land features is developed in IDRISI TerrSet software to understand the pattern changes. In order to estimate the reliability and accuracy of the predicted data, Kappa coefficient and overall classification accuracy are performed.
Overall classification accuracy indicates the consistency percentage between the actual and predicted values for each of the LULC classes considered, while kappa coefficient indicates the correctness and correlation of the actual and predicted features on pixel-by-pixel basis. In the present study, LULC of 2010 are considered as the base year. Period with no abnormal natural calamities will be considered as the base year for prediction. For the present study, 2010 is found suitable and interpreted land features of 2010 and 2021 (i.e. one past and one present data) are used in the first component of the model to generate rule based transition probability matrix, conditional probability map and transition area matrix on pixel basis. These derived transition probabilities are used as input to the second component of the model to generate the spatial and temporal dynamics in the land features for 2030.
Prediction Validation is performed to assess the reliability of the model in predicting land change dynamics for a specific study year and it is validated using existing datasets [33].Based on this approach the model derived data for 2021 is obtained using 2000 and 2010 data. The model generated 2020 land features are thereby compared with the actual 2021 LULC data. The overall accuracy classification and kappa coefficient of correlation for the 2021 predicted data are 91% and 0.9076.
Determination of NDVI and NDMWI
Normalized Difference Vegetation Index (NDVI) is the most widely used method to assess the green cover using satellite images. Landsat 7 and Landsat 8 satellite images captures reflectance from vegetation in NIR and Red spectral regions in specified bands [34-37], which are used to compute temporal vegetation status of the study area using empirical formula stated below.
NDVI is calculated using the empirical formula:
NDVI = (NIR-Red)/(NIR+Red).............(1)
For Landsat 7, the NDVI is calculated by (Band 4–Band 3)/(Band4+Band 3) ……… (1a)
For Landsat 8, the NDVI is calculated by (Band 5–Band 4)/(Band 5+Band 4) …….(1b)
The NDVI values ranges from -1 to +1. Values between 0.2 to +1 indicate vegetation of various health statuses. Higher values of NDVI from 0.6 to +1 indicates healthy vegetation, 0.3 to 0.6 indicates moderate vegetation status and values less than 0.3 indicates vegetation stress /unhealthy vegetation [38].
Though NDVI values indicates the water areas in certain range of values, reflectance values in the Green and Shortwave Infrared (SWIR) spectral regions discriminates water areas more accurately. Hence, reflectance values of Green and SWIR are used to obtain precise water areas of the Pulicat lagoon. The empirical formula used for computation of temporal Normalized Difference Modified Water Index (NDMWI) from Landsat 7 and Landsat 8 are given in equation 2 [34].
NDMWI is calculated using the empirical formula:
NDMWI=(Green-SWIR)/(Green+SWIR).............(2)
For Landsat 7, the NDMWI is calculated by (Band 2–Band 5)/(Band 2+Band 5) ……..(2a)
For Landsat 8, the NDMWI is calculated by (Band 3–Band 6)/(Band 3+Band 6) ……….(2b)
Prior to 2005, Normalized Difference Water Index is calculated using near infrared and shortwave infrared spectral regions. But the results obtained are found to be poor in quality and a modified band combination for better water areas discrimination is adopted by replacing NIR band by Green band [39].
Determination of Land Surface Temperature (LST) of the pulicat lagoon
NLand Surface Temperature (LST) is one of the most essential factors to study the climate changes of the landscapes. In the recent years LST found wide applications in many landscape related studies such as LULC dynamics, ecosystem health assessments as it serves as a good indicator of climate related impacts. The reflectance values captured by the sensors in the thermal bands are used for determination of LST. In Landsat 7 and Landsat 8 images, thermal band information are captured in bands 6 and 10 respectively [34,40,41]. The Digital Numbers (DN) values of features are converted to radiance and then to brightness temperatures. The brightness temperatures are compared with NDVI from respective bands to calculate land emissivity. All the obtained values are incorporated in the statistical formula for LST (Equation 8) to determine the LST of different features. The outcome indicates a range of minimum to maximum LST of features in the study area. The following are the statistical expressions used to determine various elements of LST.
Thermal Infrared bands:
• For Landsat 7, Band 6
• For Landsat 8, Band 10 and Band 11
Step 1: Conversion of DN values to radiance
Lλ=ML×Qcal+AL............(3)
Where,
Lλ=Top of Atmosphere spectral radiance
ML= Band specific multiplicative rescaling factor obtained from the metadata of the sensor
Qcal=Calibrated standard product pixel value
ML= Band specific multiplicative rescaling factor obtained from the metadata of the sensor.
Qcal=Calibrated standard product pixel value
AL=Band specific additive rescaling factor obtained from the metadata of the sensor
Step 2: Conversion of radiance to a Reflectance
ρλ=Mρ×Qcal+Aρ..................(4)
Where,
ρλ=Planetary reflectance without correction for solar angle
Mρ=Band specific multiplicative rescaling factor obtained from the metadata of the sensor
Qcal=Calibrated standard product pixel value
Aρ=Band specific additive rescaling factor obtained from the metadata of the sensor
Step 3: Conversion of ToA Reflectance to Satellite Brightness Temperature
< img class="img-responsive" src="https://www.walshmedicalmedia.com/articles-images-2023/remote-sensing-12-4-303-e001.png" width="260" height="59" />
Where,
BT=Satellite brightness temperature
Lλ=Top of Atmosphere spectral radiance
K1=Band specific thermal conversion constant from the metadata (Value is: 1321.08)
K2=Band specific thermal conversion constant from the metadata (Value is: 774.89)
Factor to convert degree Kelvin to degree Celsius is 273.15
Step 4: Determination of NDVI
NDVI are calculated using the statistical formula 1a and 1b
Step 5: Calculation of proportion of vegetation
PV=(NDVI-NDVIMin/NDVIMax-NDVIMin).............(6)
Step 6: Derivation of Land Surface Emissivity (e)
e=0.004PV0.986.............(7)
Where,
PV=Proportion of vegetation
Step 7: Determination of Land Surface Temperature (LST)
LST=BT/1+wI×(BT/p)×Ln(e).............(8)
Where,
BT=Satellite brightness temperature
wI=Wavelength of emitted radiance (11.5 µm)
p=h × (c/s)
h=Planck’s constatnt (6.626 × 10⁻³⁴ JS)
c=Velocity of light (2.998 × 10⁸ m/s)
s=Boltzmann constant (1.38 × 10⁻²³ J/K)
p=14380
e=Land emissivity
Directional mapping
Directional mapping (DM) is a microscale approach to determine the spatio-temporal LULC change dynamics and LST changes [42,43]. Several concentrated rings from the centre of the study area at specific interval (500 m in the present study) are drawn with the last ring covering the full study region. Based on the change dynamics, the obtained rings are divided into sectors from the centre of the study area. These concentrated rings are intersected creating a series of segment zones. In the present study the study area is divided into 8 sectors at an angle of 45° as shown in Figure 3. Each segment zone is evaluated with year wise changes in vegetation and water area along with specific range of LST in a particular segment.
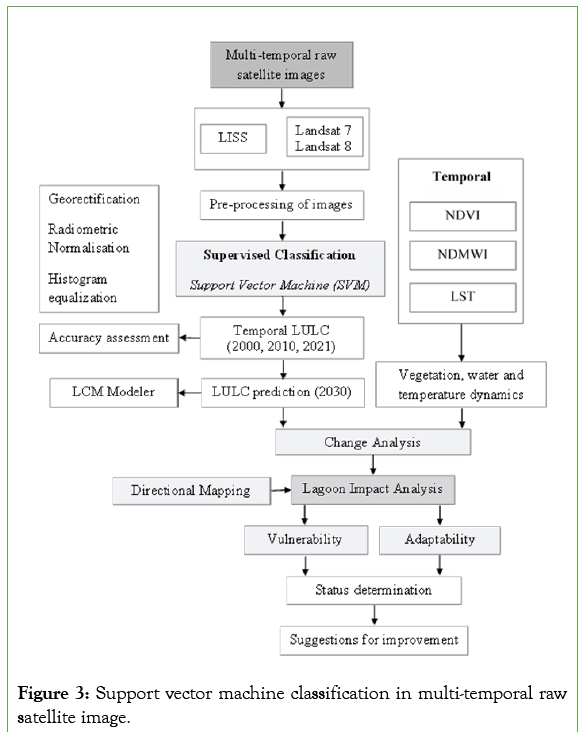
Figure 3: Support vector machine classification in multi-temporal raw satellite image.
Results and Discussions
Land use/cover dynamics
Processed temporal satellite images of LISS IV for the years 2000, 2010 and 2021 are used to interpret the different LULC in the lagoon using SVM classification. The study area is occupied with 50% water area and 41% by different land cover features. About 9% of the lagoon area is utilised by the human influenced activities. Gradual increase in the human influenced activities especially habitations and livelihood practices such as saltpans and aquafarms are noticed in the last two decades. Nearly 62% of the human influenced lands are utilised for agriculture. 5% of the land is used for canals and tanks to provide potable water and to support irrigation. It is noted that amongst the land cover features, sediment related morphological features such as mudflats and sandy areas occupied about 63% of the area indicating the high level of siltation in the lagoon. Mouth of the lagoon is predominantly sandy while southern part of the lagoon adjoining mouth inlet is mostly silt and northern part of the lagoon exhibits a combination of silt and sand indicating the type of sediments in the lagoon (Figure 4) [44,45]. Siltation in the shallow water areas are predominantly supplied by rivers such as Arani, Kalangi and Swarnamukhi that drain into the lagoon [18]. Apart from mudflats, other wetland features found in the lagoon are marshes and mangroves. On contrary to mudflats, mangroves are meagre in their spatial distribution (i.e. about 2%). Natural vegetated areas in the lagoon include scrubs and forests occupying about 32% of the land area.
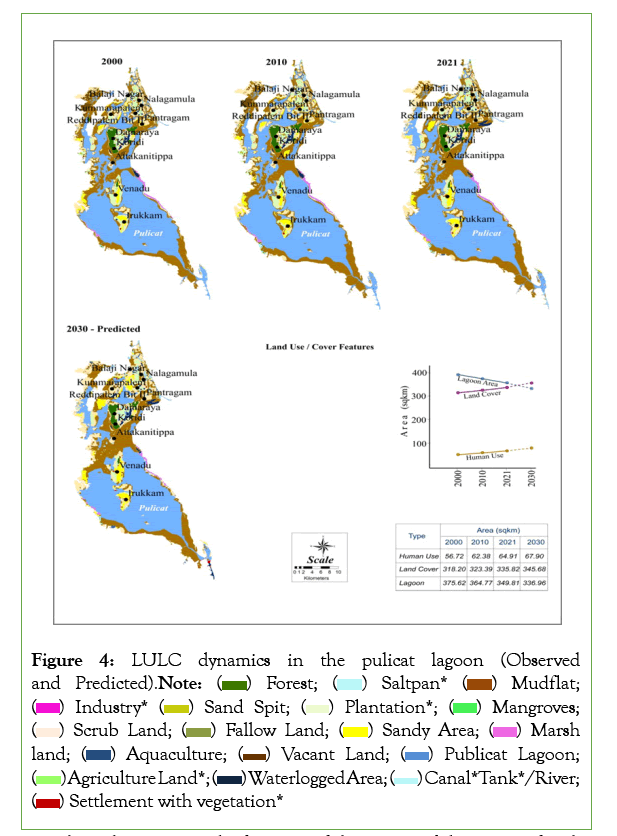
Figure 4: LULC dynamics in the pulicat lagoon (Observed and Predicted). 


Based on the past trends, forecast of the status of the LULC for the year 2030 is attempted in the study using Land Change Modeler (LCM). The predicted scenario indicated a further decrease in the water spread area by 4% indicating a possible shrinking of lagoon area from 349.81 km2 in 2021 to about 336.96 km2 in 2030. Increased siltation of about 9% is predicted in the study. Increase in human uses from 9.8% in 2021 to about 11.4% in 2030 is noted from the prediction scenario, of which a significant increase is towards habitations and economic activities. Past, present and future scenarios assessed in the study indicate a deteriorating environment for the lagoon. The spatial extent of human uses and land cover features interpreted from temporal images.
Water and land dynamics
Processed temporal satellite images of Landsat 7 and Landsat 8, for 2000, 2010 and 2021 are interpreted for different land features in the lagoon using the reflectance values in different bands. As explained in methodology, bands 2, 3, 4, 5 and 6 are used to determine the vegetation, water and other areas in the lagoon. The features are appropriately grouped based on their reflectance values as land area with and without vegetation, and deep/shallow water area. The land area within the lagoon is found as islands of various dimensions. To assess the land and water area dynamics of the lagoon for the period 2000 to 2021, land with and without vegetation are regrouped as “Land area” and area of deep and shallow waters are regrouped as “Water area” of the lagoon. The assessed dynamics is indicated in Figure 5.
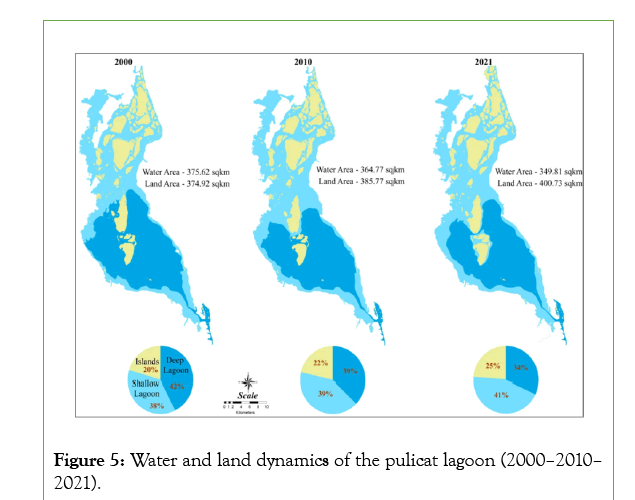
Figure 5: Water and land dynamics of the pulicat lagoon (2000–2010–2021).
In cohesion with the LULC studies, the land area showed a steady increase and water area showed a gradual decrease over the study period. The study further indicated a gradual decrease in the deep water area from 42% in 2000 to about 34% in 2021 with shallow water area showing a vice-versa scenario. Increasing siltation due to natural and anthropogenic factors could be correlated as the driving factors responsible for the continuing facile of the lagoon. Marginal erosion and accretion of islands are noticed as a natural hydrological process in the lagoon, besides evolution of new sand islets of various dimensions. The number of islets is found to increase gradually over the years indicating increasing siltation. As indicated by the prediction study, superseding of the land area over the water area may ruin the lagoon environment beyond retrieval in the near future. The present level of dynamics has already revoked concern amongst environmentalist for the immediate need for scientific and adaptation concerns to help the lagoon retrieve its natural performance. As an outcry of this alerting dynamics, Global Nature, a German based NGO that deals with protection of environment and nature has indicated Pulicat as “Threatened Lake of the year 2010” [16].
Accuracy assessment of SVM classification
Reliability of the classified features can be expressed by several terms such as Producer’s accuracy, User’s accuracy, overall classification accuracy and Kappa co-efficient. In general, these terms represents the ratio of classified features against ground features in their unique way [46]. The accuracy of the classified features at different period attempted in the study is tabulated in Table 2.
| Year | Overall classification accuracy | Kappa coefficient | Producer accuracy | User accuracy |
|---|---|---|---|---|
| 2000 | 91.27% | 0.9043 | 91.12% | 90.26% |
| 2010 | 93.11% | 0.9268 | 91.06% | 92.54% |
| 2021 | 95.87% | 0.9488 | 93.78% | 94.29% |
| 2030 | 93.74% | 0.9276 | 92.28% | 91.71% |
Table: 2 Accuracy assessments of the classified LULC features.
Assessment of NDVI and NDMWI of the pulicat lagoon
The Normalized Difference Vegetation Index (NDVI) of the lagoon is determined using the Red and NIR bands (Bands 3, 4 and 5 respectively) and the Normalized Difference Modified Water Index (NDMWI) are determined using the Red and Thermal bands (i.e. bands 2, 3, 5 and 6) of Landsat 7 and 8 images for the study period 2000, 2010 and 2021.
Pixels indicating the NDVI ranges shown in Figure 6 are the vegetated areas in the lagoon and are considered for the vegetation dynamics study. The study indicated significant changes in the vegetation index in the 20 years assessment period. The variations in NDVI ranges from low to high indicating the natural and anthropogenic stress. The assessment indicated a gradual decline of healthy vegetation over the period of time. Though the LULC study indicated a significant vegetation cover in the lagoon, the health of the vegetation faces crisis during the assessed period. The factors responsible for the deprived vegetation status are mostly attributed towards increasing anthropogenic activities directly and indirectly in the vegetated areas. Direct impacts are conversion of vegetated areas to other non-vegetated uses, while indirect impacts include practices of economic activities and their outfalls close to the vegetated areas. Though it may not be possible to avoid vegetation stress, minimizing the stress inducing factors should be attempted as an immediate measure as vegetation is one of the key factors responsible for the sustainability of any natural environment. From the present study, vegetation stress is found to be particularly significant in the shallow and mouth areas of the lagoon. Shrinking of deep lagoon as reported by others [47,48], is noticed from the variations in the NDMWI index of the lagoon (Figure 7).
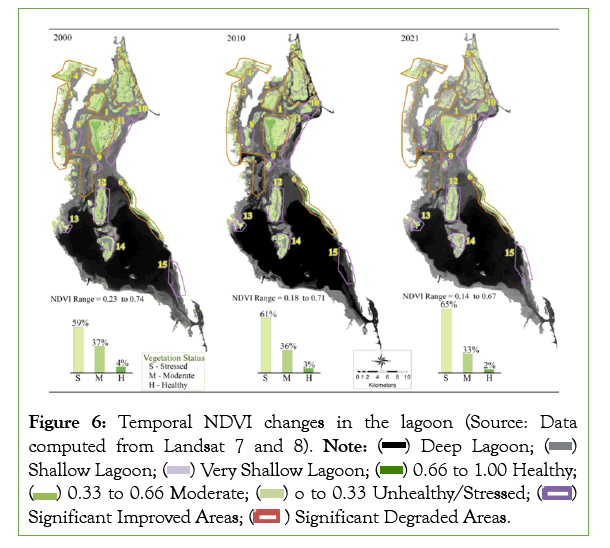
Figure 6: Temporal NDVI changes in the lagoon (Source: Data computed from Landsat 7 and 8).


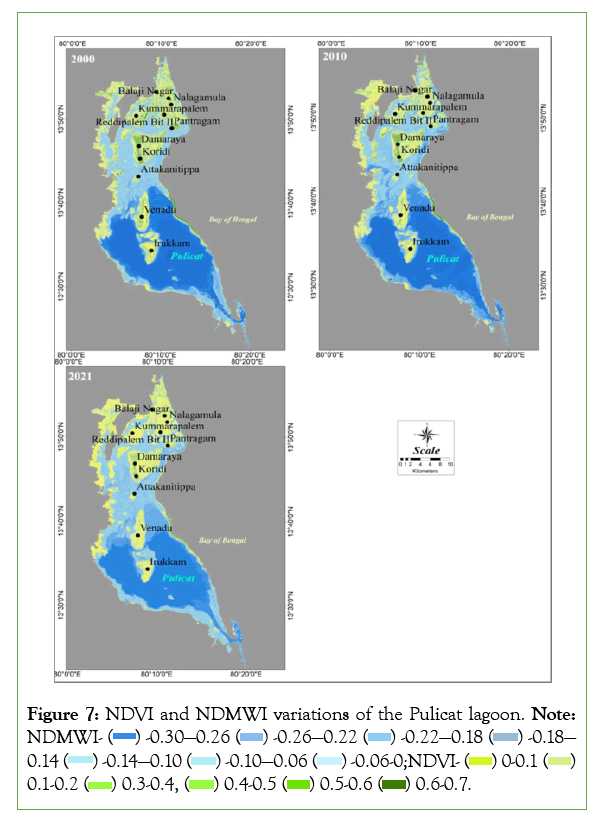
Figure 7: NDVI and NDMWI variations of the Pulicat lagoon. 


Reduction in the spatial extent of deep lagoon will impose serious biodiversity consequences and would gradually question its existence. As reported by several studies on the lagoon, the dynamics between deep and shallow waters has induced a rapid decline of flora and fauna indices of the lagoon [16]. Figure 7 shows the changes in the NDVI and NDMWI in the lagoon for the period 2000, 2010 and 2021. Stressed NDVI and NDMWI are mostly directly correlated to increase in Land Surface Temperature (LST).To validate this, LST of the lagoon for the same assessment period is attempted using the Thermal bands of Landsat 7 and Landsat 8 images. Significant changes in the LST are noticed in the study. The temporal surface temperature of the lagoon ranges between 20.6°C to 36.4°C between 2000 and 2021.
Different features of the lagoon exhibited different range of temperatures along with appropriate rise depending on the impacts of stress factors. The LST dynamics of the lagoon obtained from the study is shown in Figure 8.
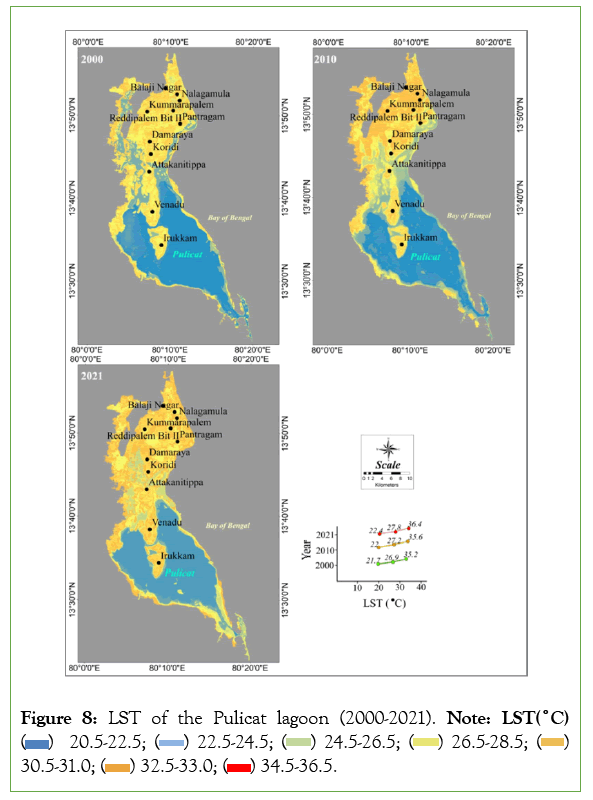
Figure 8: LST of the Pulicat lagoon (2000-2021).Note: LST(°C)

Table 3 indicated a net change in the temperature of different features of the lagoon as obtained from the study. The high values of LST variations are a clear indication of the intensity of threats for the lagoon. For better assessment, the LST variations in the vegetated areas and water areas are explicitly studied. The LST values of the vegetation pixels and water pixels are separately clipped of for the study. The obtained LST variations of vegetation and water areas are shown in Figure 9.Compared to vegetated areas, water spread areas indicated relatively lower temperature ranges especially the deep lagoon areas indicated the lowest range of temperatures ranging from 20.6°C to 22.4°C.
| Feature | Temperature Range ( ˚C) | Variations in 20 years ( ˚C) | ||
|---|---|---|---|---|
| 2000 | 2010 | 2021 | ||
| Land area | 27.1°C–35.2°C | 27.4°C–35.6°C | 27.6°C–36.4°C | 0.5°C–1.2°C |
| Deep lagoon | 20.6°C–21.7°C | 20.7°C–22.0°C | 20.9°C–22.4°C | 0.3°C–0.7°C |
| Shallow lagoon | 24.3°C–26.9°C | 24.6°C–27.2°C | 24.7°C–27.8°C | 0.4°C–0.9°C |
Table: 3 Changes in LST in pulicat lagoon.
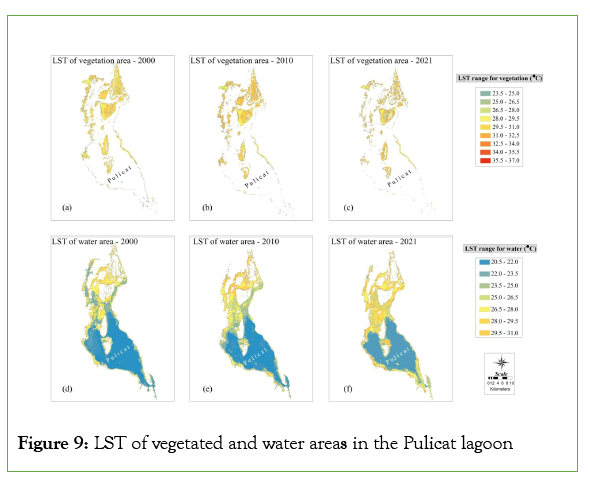
Figure 9: LST of vegetated and water areas in the Pulicat lagoon
Sector wise assessment using directional mapping
Sector wise assessment of vegetation and water area dynamics and their associated LST variations is attempted in the study to understand the sectors that are indicating significant changes. The lagoon is divided into 8 sectors as shown in Figure 10 and the change analysis obtained from the study for vegetation, water area and corresponding LST for the years 2000, 2010 and 2021 are applied. The 21 years assessment indicated the northern portion of the lagoon to be the relatively heated portion of the lagoon with a rise in LST range from 0.4°C to 1.2°C. This is the shallow region of the lagoon with habitations and dynamic land use changes especially conversion of vegetation areas to aquaculture farms.
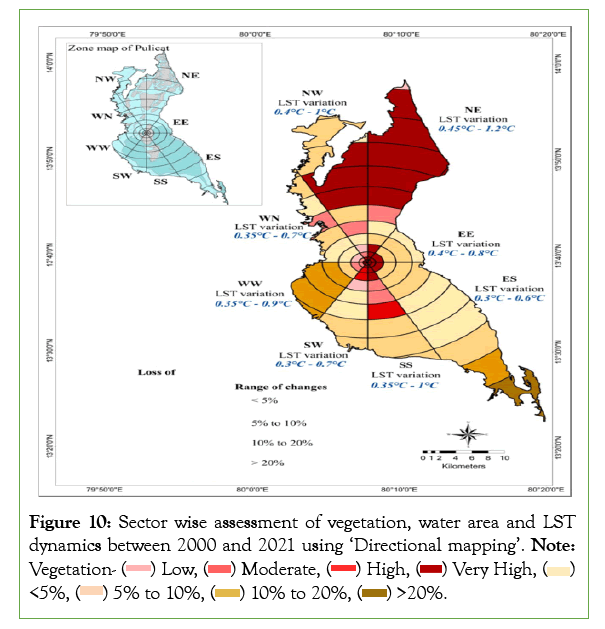
Figure 10: Sector wise assessment of vegetation, water area and LST dynamics between 2000 and 2021 using ‘Directional mapping’. Note: 

Besides Irukkam and Venadu islands, the central portion of the lagoon is mostly covered with water area of which the eastern part of the lagoon dominated with deep lagoon exhibited low variations while the western portion subjected to rapid siltation due to inputs from Arani and Kalangi rivers indicate a noticeable change in the LST range from 0.35°C to 0.9°C. The mouth of the lagoon which is the most dynamic portion of the lagoon also indicated noticeable change in LST. From this study, the most sensitive and crucial areas of the lagoon to be managed and conserved includes the northern, western and the mouth. This assessment will be particularly useful for better manage, restoration and conservation plans.
Vulnerability and adaptability of the pulicat lagoon
Despite several measures for conservation and sustainability of coastal lagoons, these highly productive ecosystems are seriously threatened by factors such as pollution, urbanisation, over exploitation of their resources, developments and siltation besides continuous modifications due to human interventions. In the present study, the vulnerability extent of the Pulicat lagoon is assessed based on the continuous deprive of its vegetation cover and water spread area against anthropogenic and natural factors such as human modifications and siltation. To assess the vulnerability of the lagoon, the dynamics of various features are consolidated and variations less than or equal to 5% is considered as low vulnerability, changes between 5% to 10% is considered as moderate vulnerability while more than 10% changes are considered as high vulnerability. These classifications are applied on site specific locations within the lagoon indicating significant changes during the study period as shown in Figure 6.
The periodic spatial changes of the features are quantified and they are assessed based on seven significant natural and anthropogenic activities in the lagoon and are indicated as parameters in Table 4. Social interventions include roads, infrastructures, manmade canals and tanks and economic interventions including salt pans and aquafarms. Built-up areas include habitations and commercial areas. The cumulative status of the lagoon for each of the assessment year is computed as the average of the vulnerability score. The vulnerability percent for each of the assessed year is obtained from the extent of area subjected to changes against the total area of the lagoon. As indicated in Table 5, the vulnerability of the lagoon exhibits an increasing trend against the total area of the lagoon.
| Parameters | 2000 | 2010 | 2021 | 2030 |
|---|---|---|---|---|
| Social interventions | Low (1) | Moderate (2) | Moderate (2) | High (3) |
| Economic interventions | Moderate (2) | Moderate (2) | High (3) | High (3) |
| Water area | Low (1) | Moderate (2) | High (3) | High (3) |
| Vegetation | Moderate (2) | High (3) | High (3) | High (3) |
| Siltation | Moderate (2) | High (3) | High (3) | High (3) |
| Built-up areas | Low (1) | Moderate (2) | High (3) | High (3) |
| Increase in LST | Moderate (2) | Moderate (2) | High (3) | High (3) |
| Status = Average of parameters score Figure 10(d) | 1.6 | 2.3 | 2.9 | 3 |
| Area involved (km2) | 210.15 | 232.67 | 270.19 | 315.23 |
| Percentage | 28% | 31% | 36% | 42% |
Table: 4 Temporal Vulnerability of the lagoon (Site specific).
With the present stress conditions, the assessment indicated a significant rise in the vulnerability of the lagoon in the next decade (Figure 11). Figure 11a depicts the periodic vulnerability percent of the lagoon computed from the study. The cope up capacity of the lagoon against the various stresses is quantified as adaptability of the lagoon. Weightages assigned in Table 6 are used for assessment of changes in the parameters between 2000 to 2021 and assessment of 2030 is based on the predicted scenario attempted in the study. It is noted from the study that though the lagoon environment is facing crisis certain locations show markeable degradation and significant improvement in land features as well. Few such significant locations with improvement in features are assessed for their proportion of improvement of features for the years 2000 to 2021. The rate of improvement of adaptation features are low compared to features vulnerable to dynamics. Hence the assessment indicated a steady decrease in the adaptation capacity of the lagoon which is forecasted to continue in future (Figure11b). A decision chart is computed to understand the cumulative effect of the dynamics of LULC, NDVI and NDMWI. The chart has four quadrants (Figure11c), with level of adaptability on the y axis and level of vulnerability on the x axis (as it is the most dominant existing scenario). The first quadrant represents, Low Vulnerability Low Adaptability (LVLA), second quadrant as High Vulnerability Low Adaptability (HVLA), third quadrant as High Vulnerability High Adaptability (HVHA) and fourth quadrant as Low Vulnerability High Adaptability (LVHA). The status obtained in Tables 5 and 6 for the years 2000, 2010, 2021 and 2030 are interpreted as proportion of adaptability and vulnerability of the lagoon and indicated in Figure11c. The status in 2000 indicated relatively higher proportion of adaptation than vulnerability while the present status of the lagoon in 2021 indicated more of decline than scope for improvement and the status of 2030 indicated to follow the 2021 scenario with increased proportion towards decline. It is for these reasons several conservation and scientific strategies are evolving among various levels to uplift the lagoon from the threatened status towards healthy retrieval. Based on the level of vulnerability and adaptation capacity of the lagoon, the present status of the lagoon indicates this productive ecosystem as a threatened entity (Figure11d).
| Parameters | 2000 | 2010 | 2021 | 2030 |
|---|---|---|---|---|
| Improved vegetation | Moderate (2) | Low (1) | Low (1) | Low (1) |
| Improved water area | Moderate (2) | Low (1) | Low (1) | Low (1) |
| Improved land cover | Moderate (2) | Moderate (2) | Low (1) | Low (1) |
| Controlled siltation | Moderate (2) | Low (1) | Low (1) | Low (1) |
| Sustain/Decrease in LST | Moderate (2) | Low (1) | Low (1) | Low (1) |
| Status=Average of parameters score Figure 10(d) | 2 | 1.2 | 1 | 1 |
| Area involved (km2) | 330.23 | 300.22 | 247.68 | 195.14 |
| Percentage | 44% | 40% | 33% | 26% |
Table: 5 Temporal Vulnerability of the lagoon (Site specific).
| Changes | Range | Weightage |
|---|---|---|
| <5% | Low | 1 |
| 5% to 10% | Moderate | 2 |
| >10% | High | 3 |
Table: 6 Weightages computed for feature dynamics in the pulicat lagoon (2000–2020).
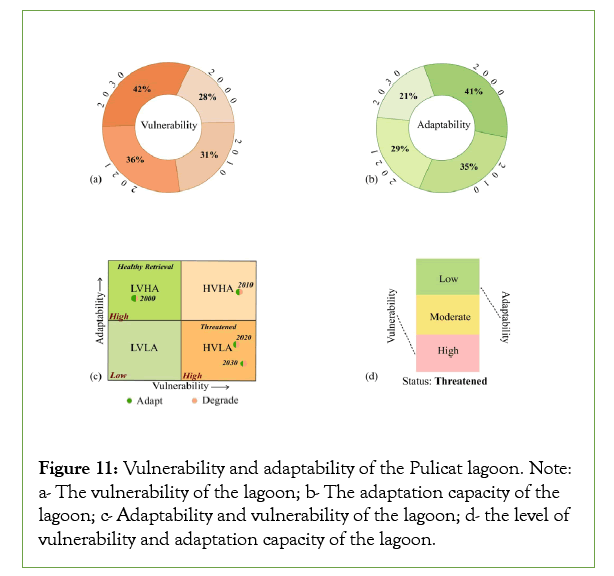
Figure 11: Vulnerability and adaptability of the Pulicat lagoon. Note: a- The vulnerability of the lagoon; b- The adaptation capacity of the lagoon; c- Adaptability and vulnerability of the lagoon; d- the level of vulnerability and adaptation capacity of the lagoon.
Suggestions for improvement
In the present status of this fragile ecosystem, no attempts for conservation or protection should further aggravate the stress of the system. Several suggestions and recommendations are put forth by environmentalists and scientists. The suggestions need to be validated with appropriate scientific feasibilities and approaches, for a visible retrieval of the system. In fact, certain constraints presently existing in the system can be made to appropriately subside and allow the system to retrieve by itself rather than inducing alterations into the system.
From the study,
• Vegetation corridors need to be improved which may allow the system to maintain its environment as it should be. All sources of vegetation features such as crop lands including plantations shall be conserved. Mangrove areas and marshes showed a gradual decline in the study. Initiations to improve mangrove areas and degradations of marshes need to be attempted to avoid further increase in LST in deprived vegetated areas.
• Extent of deep lagoon is significantly less during the assessed period. Natural siltation sources can be appropriately managed or minimise to sustain the extent of deep lagoon which will predominantly sustain the temperature range for better improvement of native flora and fauna diversity of the lagoon. The study indicated an increase in LST in the deep lagoon ranging from 0.3°C–0.7°C which may endanger the biodiversity of the lagoon.
• Habitation areas show a gradual increase in the islands of the lagoon. Increasing population could not be avoided but proper planning of habitation areas can be attempted to minimize increasing LST.
• Booming of economic activities both within the lagoon system and on its peripheries cause serious threats to the environment due to their outfalls. Continuous conversion of native land covers to economic activities may further deteriorate the lagoon from “Threatened” to “Endangered” in the near future.
• Enforcement of no relaxation/stringent ecological policies for promoting any ecologically damaging activities in the lake especially around ecosenstive areas of the lagoon such as bird sanctuary and lagoon water spread areas as also suggested ecologists [49].
Numerous suggestions from researches such as maintenance of mouth opening for exchange of seawater and freshwater, improving natural green areas such as mangroves, control on over exploitation of resources, reduction of pollution generating activities and proper treatment of their outfalls, improvement of ecotourism activities for alternative livelihood of dependents rather than overexploitation of the environment, alternative bridge road replacing the present earthen road across the lagoon between Sullurpeta and Sriharikota to avoid rapid conversion of deep water areas to shallow water areas due to siltation are some of the noteworthy mitigation measures [7,50-52]. Gradual increase of LST as noted in the study may soon endanger the lagoon beyond recovery. The constraints need to be effectively reduced and allow the system to improve its adaptability than its vulnerability which is presently vice versa.
Conclusion
The Pulicat lagoon is facing severe stress due to both natural and anthropogenic activities. The present study indicated the stress and their impacts on the lagoon. Natural stress to the lagoon includes high rate of siltation directly influencing shrinkage of lagoon area and anthropogenic activities influencing conversion of vegetation to non-vegetation areas. Deprived vegetation and water areas increases the surface temperature of the lagoon to a significantly noticeable range such as 0.3°C to 0.7°C in Deep lagoon areas, 0.4°C to 0.9°C rise in shallow water regimes and a relatively high range between 0.5°C to 1.2°C in the land areas. Increasing shallow water areas and land areas would further accelerate the LST in the near future. Due to the continuous decline of the essential features of the lagoon, this ecosystem has become fragile and listed as a threatened ecosystem. Further worsen of the features may endanger this productive unique ecosystem. The analysis and the outcomes of the present study highlighted the stress factors and the vulnerability and adaptability of the lagoon for the years 2000, 2010 and 2021 and the attempted prediction of the features in 2030 indicated possibility of the alarming deterioration of the lagoon. Suggestions indicated in the study and by other researchers should be attempted effectively for the system to retrieve to a healthy environment.
Acknowledgment
This manuscript is one of the significant outcomes of the study titled “Restoration of Pulicat Lagoon” undertaken by the National Centre for Sustainable Coastal Management (NCSCM). The authors wish to express their gratitude to the Ministry of Environment, Forests and Climate Change (MoEF&CC), New Delhi for funding the project and for their continuous support in capacity development activities of NCSCM. Authors wish to thank their team members of Geo division, NCSCM for their technical support for the study. The opinions expressed in this publication are those of the auhors concerned and do not necessarily represent the views of their organization.
Conflict of Interest
The authors declare that they have no conflict of interest.
Funding
The authors did not receive support from any organization for the submitted work.
References
- Anthony A, Atwood J, August P, Byron C, Cobb S, Foster C, et al. Coastal lagoons and climate change: Ecological and social ramifications in US Atlantic and gulf coast ecosystems. Ecol Soc. 2009;14(1).
- Wolanski E, Day JW, Elliott M, Ramesh R, editors. Coasts and estuaries: The future. Elsevier. 2019.
- Conde D, Vitancurt J, Rodríguez-Gallego L, De Álava D, Verrastro N, Chreties C, et al. Solutions for sustainable coastal lagoon management: From conflict to the implementation of a consensual decision tree for artificial opening. 2015:217-274.
- Larson M. Encyclopedia of lakes and reservoirs. Springer. 2012.
[Crossref]
- Isla FI. Coastal zones and estuaries. EOLSS Publications. 2009.
- Mahapatro D, Panigrahy RC, Panda S. Coastal lagoon: Present status and future challenges. Int J Mar Sci. 2013.
- Saraswathy R, Pandian PK. Pulicat Lake: A fragile ecosystem under threat. Int J Civ Eng. 2016;24(3):8-18.
- Kannan V. Vulnerable ecosystem the Pulicat Lake needs government's attention. 2022.
- Marcio B. Lagoon entrances and sediment dynamics challenges faced by coastal engineers. J Coast Zone Manag. 2023;26(1):549.
- Mitwah E. Overview of the characteristics and environmental effects of coastal lagoons. J Coast Zone Manag. 2022;25(11):534.
- Coastal lagoons and climate change: Ecological and social ramifications in US Atlantic and gulf coast ecosystems
- Mouli KC, KesavaRaju K, JagadiswaraRao R. Environmental impact of the changes in the position of mouths of Arani River and Pulicat Lake with the Bay of Bengal in Tiruvallur District, Tamil Nadu, India. Earth Science India. 2012;4:7.
- Crossref
- Menon A. Red listing the Pulicat Lagoon may help protect the ecosystem, say researchers. 2023.
- Deepika M, Bebedict X. Land use and land cover change detection using Remote Sensing and GIS in Pulicat Lagoon. Int J Res Eng Sci Manag. 2020;3(1):494-498.
- Raj SPJ. Macro fauna of Pulicat lagoon. 2011.
- Jebakumar EG, Natesan U. Is Pulicat lagoon shringking?–Assessment through Geospatial approach. Geogr J. 2015;90(2):147-156.
- Sanjeeva Raj PJ. Macro fauna of Pulicat Lake. NBA bulletin. 2006.
- Sampath J. Wanton human intervention shrinks Pulicat; Can impact monsoon. 2020.
- Nanda Kumar NV. Silt posing a grave threat to Pulicat Lake. 2011.
- Kannan V, Manakadan RA, Rao PR, Mohapatra KK, Sivakumar S, Santharam V. The waterbirds of Pulicat Lake, Andhra Pradesh–Tamil Nadu, India, including those of the adjoining wetlands and heronries. J Bombay Nat Hist Soc. 2008;105(2):162-180.
- Gopalakrishnan S. In harm’s way: Pulicat Lagoon. 2017
- Riddhika R, Quadros G, Ramesh T, Arun PR, Sharpana NB, George A, et al. Impact of dredging and opening of the sea mouth into the Pulicat lake at Rayadoruvu village of Vakadu Mandal, on the habitat of Pulicat Bird Sanctuary, Andhra Pradesh. 2019.
- Taati A, Sarmadian F, Mousavi A, Pour CT, Shahir AH. Land use classification using support vector machine and maximum likelihood algorithms by Landsat 5 TM images. Walailak J Sci Technol. 2015;12(8):681-687.
- Shi D, Yang X. Support vector machines for land cover mapping from remote sensor imagery. 2015:265-279.
- Rudrapal D, Subhedar M. Land cover classification using support vector machine. Int J Eng Res. 2015;4(09):584-588.
- Talukdar S, Singha P, Mahato S, Pal S, Liou YA, Rahman A. Land-use land-cover classification by machine learning classifiers for satellite observations. A review. Remote Sens. 2020;12(7):1135.
- Bouaziz M, Eisold S, Guermazi E. Semiautomatic approach for land cover classification: a remote sensing study for arid climate in southeastern Tunisia. Euro-Mediterr J Environ Integr. 2017;2:1-7.
- Shariff ARM. 7th IGRSM International Remote Sensing & GIS Conference and Exhibition. 2014.
[Crossref]
- Hamad R, Balzter H, Kolo K. Predicting land use/land cover changes using a CA-Markov model under two different scenarios. Sustainability. 2018;10(10):3421.
- Hua AK. Application of CA-Markov model and land use/land cover changes in Malacca River watershed, Malaysia. Appl Ecol Environ Res. 2017;15(4).
- Nehzak HK, Aghaei M, Mostafazadeh R, Rabiei-Dastjerdi H. Evaluation of land use change predictions using CA-Markov model and management scenarios. Earth Environ Sci Trans R Soc Edinb. 2022;105-115.
- Hadi SJ, Shafri HZ, Mahir MD. Modelling LULC for the period 2010-2030 using GIS and remote sensing: A case study of Tikrit, Iraq. InIOP conference series: earth and environmental science 2014.23;012053.
- John J, Bindu G, Srimuruganandam B, Wadhwa A, Rajan P. Land use/land cover and land surface temperature analysis in Wayanad district, India, using satellite imagery. Annals of GIS. 2020;26(4):343-360.
- Crippen RE. Calculating the vegetation index faster. Remote Sens Environ. 1990;34(1):71-73.
- Masek JG, Vermote EF, Saleous NE, Wolfe R, Hall FG, Huemmrich KF, et al. A Landsat surface reflectance dataset for North America, 1990-2000. IEEE Geosci Remote Sens Lett. 2006;3(1):68-72.
- Vermote E, Justice C, Claverie M, Franch B. Preliminary analysis of the performance of the Landsat 8/OLI land surface reflectance product. Remote Sens Environ. 2016;185:46-56.
[Crossref] [Google Scholar] [PubMed]
- Google Scholar
- Xu H. A study on information extraction of water body with the modified normalized difference water index (MNDWI). J Remote Sens. 2005;9:589–595.
- Pal S, Ziaul SK. Detection of land use and land cover change and land surface temperature in English Bazar urban centre. Egypt J Remote Sens Space Sci. 2017;20(1):125-145.
- Suresh S, Ajay SV, Mani K. Estimation of land surface temperature of high range mountain landscape of Devikulam Taluk using Landsat 8 data. Int J Eng Res Technol. 2016;5(1):2321-7308.
- Kafy AA, Naim MN, Subramanyam G, Ahmed NU, Al Rakib A, Kona MA, et al. Cellular Automata approach in dynamic modelling of land cover changes using RapidEye images in Dhaka, Bangladesh. Environmental Challenges. 2021;4:100084.
- Cao H, Liu J, Chen J, Gao J, Wang G, Zhang W. Spatiotemporal patterns of urban land use change in typical cities in the Greater Mekong Subregion (GMS). Remote sens. 2019;11(7):801.
- Rao NV, Rao MP. Bottom sediments of Pulicat Lake, east coast of India. 1974.
- Batvari BP, Mariappan VN. Grain Size and Sediment Characterization of Lagoon Sediments in Pulicat Lake, North Chennai Coastal Region, South East Coast of India. Environment. 2016;9(3):424-430.
- Kranjčić N, Medak D, Župan R, Rezo M. Support vector machine accuracy assessment for extracting green urban areas in towns. Remote Sens. 2019;11(6):655.
- Sathyanarayana R. Pulicat Lake gasps for survival. 2013.
- Kannan V, Pandiyan J. Pulicat Lake–An Ecosystem under Threat. 2014.
- Mrutyumjaya KR. Pulicat Bird Sanctuary in Grave Danger. 2020.
- Kannan V. Pulicat Lake: A case of conservation concern. 2021.
- Thirunavukkarasu N, Gokulakrishnan S, Premjothi PV, Inbaraj RM. Need of coastal resource management in Pulicat Lake–challenges ahead. Indian J Sci Technol. 2011;4(3):322-326.
- Jayanthi M, Kavitha N, Ravichandran P, Muralidhar M. Assessment of Impact of Brackish water Aquaculture on Pulicat Lake Environment and Its nearby Resources using Remote Sensing and GIs Techniques. Aquac Int. 2007;22(1-2):55-69.
Citation: Kumari R, Sethu S, Manickam M, Murugan M, Jayadevan SK (2023) Study of the Pulicat Lagoon On The Basis Of Deprived Vegetation and Water Area against Increased Land Surface Temperature. J Remote Sens GIS.12:303.
Copyright: © 2023 Kumari R, et al. This is an open access article distributed under the terms of the Creative Commons Attribution License, which permits unrestricted use, distribution, and reproduction in any medium, provided the original author and source are credited.
