PMC/PubMed Indexed Articles
Indexed In
- Academic Journals Database
- Open J Gate
- Genamics JournalSeek
- Academic Keys
- JournalTOCs
- China National Knowledge Infrastructure (CNKI)
- CiteFactor
- Scimago
- Ulrich's Periodicals Directory
- Electronic Journals Library
- RefSeek
- Hamdard University
- EBSCO A-Z
- OCLC- WorldCat
- SWB online catalog
- Virtual Library of Biology (vifabio)
- Publons
- MIAR
- University Grants Commission
- Geneva Foundation for Medical Education and Research
- Euro Pub
- Google Scholar
Useful Links
Share This Page
Journal Flyer

Open Access Journals
- Agri and Aquaculture
- Biochemistry
- Bioinformatics & Systems Biology
- Business & Management
- Chemistry
- Clinical Sciences
- Engineering
- Food & Nutrition
- General Science
- Genetics & Molecular Biology
- Immunology & Microbiology
- Medical Sciences
- Neuroscience & Psychology
- Nursing & Health Care
- Pharmaceutical Sciences
Research Article - (2013) Volume 5, Issue 4
Study of Local Anaesthetics. Part 203*. Micellization of Heptacainium Chloride Studied By Spectral Methods in Aqueous Solution
Abstract
The formation of micelles of the local anaesthetic heptacainium chloride (substance, XIX) in aqueous solution was investigated by the pyrene absorption and the pyrene I 1 /I 3 ratio methods, respectively by optical density (OD) method for surface curvature measurement. First, the absorption spectroscopy in UV/VIS region was based on studying changes in characteristic absorption spectrum of pyrene in presence of surfactant. The resultant plot of the sum of absorbances for the entire key pyrene maximum as a function of the total surfactant concentration showed, in the region of the critical micellar concentration, a usual sigmoidal increase. The fluorescence emission spectroscopy in UV/VIS region of spectrum by the probe pyrene, second procedure, was applied for determination of the cmc from the detections of the pyrene I 1 /I 3 ratio as a function of the surfactant concentration. The pyrene ratio data were fitted by the Boltzmann-type sigmoid of declining progress. The third (OD) method used required microliters of surfactant solutions and standard microplate absorbance measurements.
Keywords: Local anaesthetic, Heptacainium chloride, Critical micelle concentration, Pyrene absorption, Fluorescence, Sigmoidal-Boltzmann equation, Optical density
Introduction
The process of self-association of surfactants into micelles, vesicles and membranes maintain very important function in many fields, extending from biological systems to technical applications.
Micelles, which can be spherical, cylindrical, or planar (discs or bilayers), are unstable units formed by noncovalent aggregation of individual surfactant monomers. Micelle form and bulk can be forced by changing the surfactant chemical structure and by varying solution circumstances such as temperature alike, ionic strength, surfactant composition (in case of mixed surfactant systems), overall surfactant concentration and pH. Especially depending on the solution conditions and on the surfactant nature, spherical micelles are able to grow onedimensionally into cylindrical micelles or two-dimensionally into bilayers or discoidal micelles. Micelle enlargement is controlled mainly by the surfactant polar groups, since both one-dimensional growth involve bringing the surfactant polar groups closer to each other in order to diminish the obtainable area per surfactant molecule at the micelle surface, and hence the bend of the micelle surface [1,2].
In aqueous media these micellar structures, the surfactant molecules are directed with their polar groups towards the water phase and their hydrophobic parts away from it. In ionic micelles, the interphase area between the aqueous and the micelle phase involves the ionic polar groups, the Stearn Layer of the electrical double layer correlated to these groups, approximately half of the counter ion linked with the micelle and water. The remaining counter ions are enclosed in the Gouy-Chapman ratio of the double layer that reaches further into the aqueous stage. In the presence of electrolytes the length of the double layer is a function of ionic strength of the solution and it can be exceedingly compressed. The structure for nonionic surfactant having a polyethylene oxide (PEO) polar part, is basically identical, excluding the counter ions from the outer area, but rather coils of hydrated polyethylene oxide chains. The inner side of the micelle including hydrophobic parts presents a radius of approximate length of the totally extended hydrophobic chain [3]. Micelles´ other significant feature is, that the aqueous stage penetrates into the micelle beyond the hydrophilic polar parts, and some of the first methylene hydrophobic parts nearby to the polar group are considered in the hydration area. Therefore, we can segregate the interior area of the micelle in an outer centre penetrated by water and in an inner centre completely waterexcluded [2].
There are several used techniques such as NMR, surface tension, conductometry, light scattering and calorimetry to determine the critical micelle concentration (cmc) [4-9] and bulk thermodynamic properties like aggregation number [10-12]. In addition, spectral methods like UV-VIS and fluorescence using other substances as probes are also used for the assessment of cmc [13,14].
In this paper, we have tried to compare the pyrene absorption method [13] and the fluorescence method [14] in evaluating the cmc of the solution containing surfactant heptacainium chloride with the optical density method [15] uses changes of the meniscus curvature in high density multi-well plates related with colloidal changes in solution.
Experimental Section
Materials and Methods
The surfactant of cationic local anaesthetic heptacainium chloride was synthesized by Cižmárik et al. [16]. Pyrene was purchased from Sigma-Aldrich, Switzerland. Laboratory temperature throughout the experiment was 22°C. The critical micellar concentrations were determined by methods [13-15].
Preparation of pyrene solution
A store solution of pyrene was arranged by adding a recognized weight of the substance in 20 wt% ethanol in water. The mixture was sonicated in direction to bring a clear solution. The experimental 2 μmol/l solution of pyrene was arranged from it by dilution in which the concentration of ethanol was 0.25%. That diminutive concentration of the ethanol was considered incapable to affect the self-aggregation and spectral performance of amphiphiles.
Pyrene absorbance method
In UV-VIS spectrophotometer Spekol 1300 Analytic Jena AG (Germany) the absorbance measurements were done using 10 mm path length quartz cuvette. The spectra were inscribed in the 200-400 nm wavelength scope.
Fluorescence method
Fluorescence measurements were done in Fluoro-Max-4 (Jobin Yvon) spectrofluorometer. Fluorescence emission spectra of a surfactant solutions figure containing 1-2 μmol/l of pyrene were inscribed using an excitation wavelength of 335 nm, and the intensities I1 and I3 were determinated at the wavelengths relating to the first and third vibronic bands situated near 373 and 383 nm, respectively. The ratio I1/I3 is the entitled pyrene 1:3 ratio. All fluorescence measurements were carried out at 22°C.
Optical density method
Optical density measurements were made using an Epoch Microplate Spectrophotometer. Sample volumes were 200 μl in 96-micro well plates.
Results and Discussion
Pyrene absorption spectra
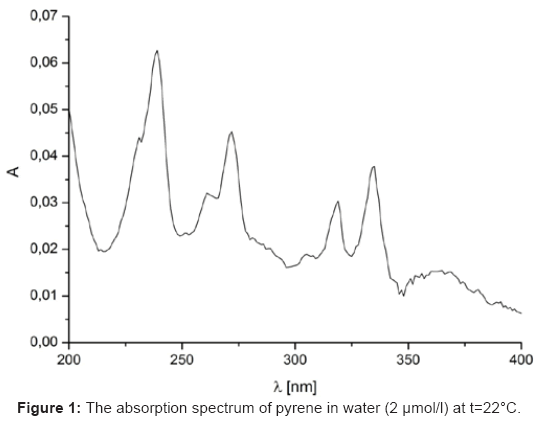
The absorption spectrum of pyrene in water has evidenced eight13 peaks strong (s) and weak (w) at 232w, 242s, 252w, 260w, 272s, 308w, 320s and 336s nm, respectively, as shown in Figure 1. The concentration of used pyrene was 2 μmol/l which was within its solubility limit of 2-3 μmol/l. Excimer formation was supposed to be absent [13,17] at this concentration.
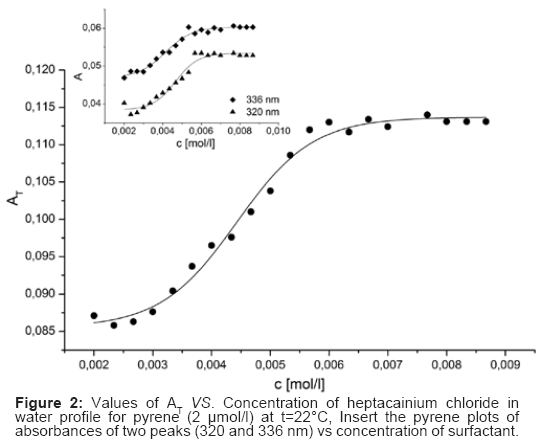
In the absorption spectrum of heptacainium chloride the pyrene peaks at 232, 242, 252, 260, 272 and 308 nm were not detected due to the strong inclusion of this surfactant in near UV area and the peaks of pyrene in issue were masked. The schemes of the total of absorbances of all the main pyrene peaks AT (at 320 and 336 nm in heptacainium chloride water solution) against surfactant concentration in water showed around the cmc a typical sigmoidal shape of the increase in nature (Figure 2).
Fitting these profiles to the Sigmoidal-Boltzmann Eq. (1) was herein used for cmc calculation.
Hence,
(1)
Where the total concentration of surfactant, asymptotes, in that is order, and are the initial and final sigmoid is the sigmoid centre and Δ is the independent variable and the interval. There can be created two singular cmcs by the sigmoidal plot, one at second at 2Δ. Additionally the ratio /Δ can be a leader to distinguish and to /Δ choose right cmc from given possibilities. The surfactant structures that provide /Δ 10 make 1; those which provide /Δ 10. The 1 and /Δ 10 by the (SBE) process produced 2 values of heptacainium chloride and the most important fit parameters for surfactant schemes considered, counting the amount of aims used in the fit (n), regression-square (r2) and the chi-square (χ2) are presented in Table 1. The absorption data treated by above mentioned equation (1) and analyzed in compliance with the suggestion of Aguiar et al. [14] have formed value was taken identical to /Δ value much lesser than 10, so that the cmc as considered above [13,14].
| Method | n | Δ | /Δ | r2 | χ2 | (1/) | (2/) | |
|---|---|---|---|---|---|---|---|---|
| Absorption spectroscopy | 20 | 0.00443 | 6.47×10⁻⁴ | 6.84 | 0.989 | 1.34×10⁻⁶ | 4.43×10⁻³ | 5.72×10⁻³ |
| Fluorescence spectroscopy | 28 | 0.00467 | 8.76×10⁻⁴ | 5.33 | 0.994 | 8.36×10⁻⁵ | 4.67×10⁻³ | 6.42×10⁻³ |
| Optical density | 16 | 0,00506 | 1.05×10⁻³ | 4.82 | 0.983 | 1.57×10⁻⁵ | 5.06×10⁻³ | 7.16×10⁻³ |
Table 1: The fit parameters, the quantity of points applied in the fit (n), regression-square (r2) and the 1 and 2 values of heptacainium chloride.
Pyrene fluorescence spectra
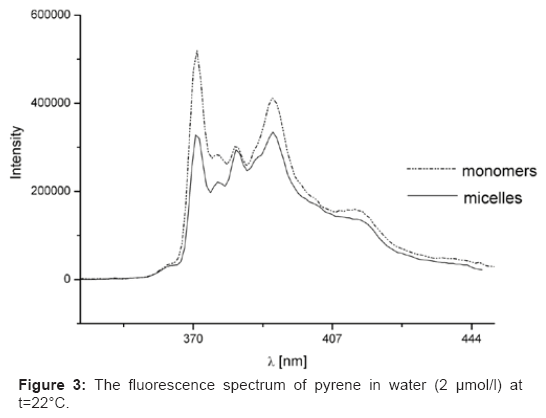
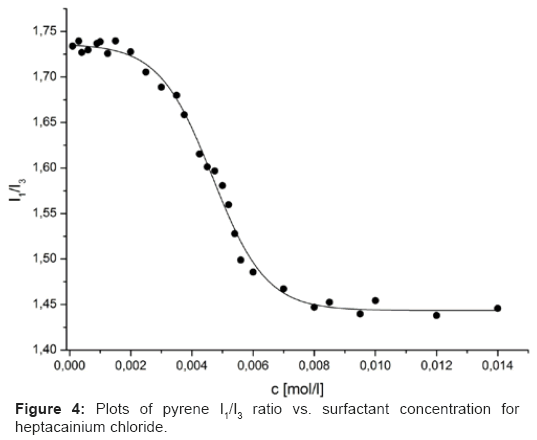
In the emission spectra five emission summits at 373, 379, 383, 389 and 393 nm for pyrene (Figure 3) were observed. The so-called pyrene polarity index, I1/I3 (share of the first and third peaks intensities in the fluorescence emission range of pyrene) has turned out to be one of the most accepted procedures for the cmc determination in micellar systems [13,14,18]. Firstly we considered the pyrene monomer spectrum. The initial I1/I3 ratio decreased with the increase in surfactant concentration due to a increasingly less polar microenvironment [19]. A reduce in I1/I3 was observed reflecting the incorporation of the probe into micellar, non-polar environment [20]. This represents that the restricted polarity around the pyrene starts to decrease radically before micelles are observed [19].
Thus, the pyrene I1/I3 ratio plots could be sufficiently depicted by declining sigmoid of the
Boltzmann type (Figure 4), which was specified by Eq. (2):
(2)
Where the variable y corresponded to the pyrene I1/I3 ratio significance, the autonomous variable x was the entire surfactant concentration, restrictions of the sigmoid, correspondingly, was the centre of the sigmoid, and Δ was in a straight line connected to the autonomous inconsistent scope where the sudden change of the reliant variable occurred.
Two singular cmcs can be created by the sigmoidal plot, the first at - and the second at 2Δ. The coefficient can be constructive to set up an objective approach when picking a particular point able to supply a consistent cmc value in the pyrene I1/I3 ratio plots.
In case of heptacainium chloride mentioned ratio was lower than 10 so that the cmc value was considered identical to chi-square (χ2), and the (Basu Ray et al. [13] and Aguiar et al. [14]). Table 1 were summarized the fit parameters, the quantity of points applied in the fit (n), regression-square (r2) and the 1 and 2 values of heptacainium chloride.
Surface curvature measurement by optical density method
The samples for cmc measurements were prepared by serial dilution of surfactant using a 96-well plate. The optical density method is reposed on the influence of a curved meniscus on spectrophotometric determinants applying a plate reader with a vertical light path, where the light path does not pass through an air-water interface and is horizontal. This method is founded on the Young equation (Eq. (3))
(3)
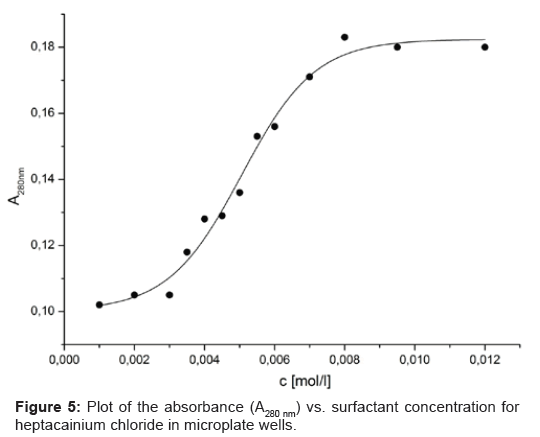
Where, the contact angle θ is at the solid?liquid?vapour contact line to the surface tension of the liquid?vapour, and solid?vapour and the solid?liquid interfacial tensions respectively. The value of θ determines the meniscus curvature. When θ=90º, the meniscus is plain; when θ<90º, the meniscus is curved upwards at the ridges of the cuvette; when θ>90º, the meniscus is curved downwards. When optical density determinants are completed in 96-well plates including samples with different surface tensions, the lensing effect of the meniscus increases the quantity of light capable to get to the detector: the lower the value of θ<90º, the greater the curvature of the meniscus and the lower the intensity of the light detected. In the absorbance mode, an increased value for the optical density reflects in the meniscus-induced decline in intensity. Absorbance determinants are generally made with the central position of the beam of the well; in this arrangement, the maximal influence of a meniscus upon the absorbance read-out is 0.1-0.2 absorbance-surely sufficient to affect interpretation of results [15]. The absorbance vs. concentration curves are shown in Figure 5. Based on the mechanism of micelle formation, there was an inflection point in the surface tension vs. concentration curve at the surfactant cmc, which was observed in substance (XIX) tested.
Conclusion
This investigation has authorized us to reveal that the plots the total of the absorbances of all the main pyrene peaks vs. surfactant concentration could be adequately described by increasing Boltzmann-type sigmoid. This absorption profile enabled to define two singular points. The coefficient /Δ could be used to decide between one and the other value.
The typical emission spectrum of pyrene was characterized by decreasing sigmoid. The pyrene I1/I3 ratio resultant plot, as a surfactant concentration purpose, was used to determine the critical micellar concentration of heptacainium chloride. The cmc values of local anaesthetic heptacainium chloride obtained by pyrene absorption and fluorescence data were in good agreement with an optical density method.
Acknowledgements
This study was supported by the Grant UK/246/2013.
References
- Chevalier Y, Zemb T (1990) The structure of micelles and microemulsions. Rep Prog Phys 53: 279.
- Puvvada S, Blankschtein D (1990) Molecular-thermodynamic approach to predict micellization, phase behavior and phase separation of micellar solutions. I. Application to nonionic surfactants. J Chem Phys 92: 3710-3724.
- Rosen JM (2004) Surfactants and Interfacial Phenomena (3rdedn), John Wiley & Sons, New Jersey, USA.
- Zakharova LY, Gaysin NK, Gnezdilov OI, Bashirov FI, Kashapov RR, et al. (2012) Micellization of alkylated 1.4-diazabicyclo[2.2.2]octane by nuclear magnetic resonance technique using pulsed gradient of static magnetic field. Journal of Molecular Liquids 167: 89-93.
- Nyuta K, Yoshimura T, Esumi K (2006) Surface tension and micellization properties of heterogemini surfactants containing quaternary ammonium salt and sulfobetaine moiety. J Colloid Interface Science 301: 267-273.
- Sajid Ali M, Abdul Rub M, Khan F, Al-Lohedan HA, Kabir-ud-Din (2012) Interaction of amphiphilic drug amitriptyline hydrochloride with b-cyclodextrin as studied by conductometry, surface tensiometry and viscometry. Journal of Molecular Liquids 167: 115-118.
- Bai G, Lopes A, Bastos M (2008) Thermodynamics of micellization of alkylimidazolium surfactants in aqueous solution. The Journal of Chemical Thermodynamics 40: 1509-1516.
- Moulik SP, Mitra D (2009) Amphiphile self-aggregation: an attempt to reconcile the agreement-disagreement between the enthalpies of micellization determined by the van't Hoff and Calorimetry methods. J Colloid Interface Sci 337: 569-578.
- Sarac B, Bester-Rogac M (2009) Temperature and salt-induced micellization of dodecyltrimethylammonium chloride in aqueous solution: a thermodynamic study. J Colloid Interface Sci 338: 216-221.
- Das D, Ismail K (2008) Aggregation and adsorption properties of sodium dodecyl sulfate in water-acetamide mixtures. J Colloid Interface Sci 327: 198-203.
- Javadian S, Gharibi H, Sohrabi B, Bijanzadeh H, Safarpour MA, et al. (2008) Determination of the physico-chemical parameters and aggregation number of surfactant in micelles in binary alcohol–water mixtures. Journal of Molecular Liquids 137: 74-79.
- Dong B, Zhao X, Zheng L, Zhang J, Li N, et al. (2008) Aggregation behavior of long-chain imidazolium ionic liquids in aqueous solution: Micellization and characterization of micelle microenvironment. Colloids and Surfaces A: Physicochemical and Engineering Aspects 317: 666-672.
- Basu Ray G, Chakraborty I, Moulik SP (2006) Pyrene absorption can be a convenient method for probing critical micellar concentration (cmc) and indexing micellar polarity. J Colloid Interface Sci 294: 248-254.
- Aguiar J, Carpena P, Molina-Bolívar JA, Carnero Ruiz CJ (2003) On the determination of the critical micelle concentration by the pyrene 1:3 ratio method. Journal of Colloid and Interface Science 258: 116-122.
- Cottingham MG, Bain CD, Vaux DJ (2004) Rapid method for measurement of surface tension in multiwell plates. Lab Invest 84: 523-529.
- Cizmarik J, Borovansky A, Svec P (1976) Acta Facult Pharm Univ Comenianae 29: 53-76.
- Kalyansundaram K, Thomas JK (1977) Environmental effects on vibronic band intensities in pyrene monomer fluorescence and their application in studies of micellar systems. J Am Chem Soc 99: 2039-2044.
- Paddon-Jones G, Regismond S, Kwetkat K, Zana R (2001) Micellization of Nonionic Surfactant Dimers and of the Corresponding Surfactant Monomers in Aqueous Solution. J Colloid Interface Sci 243: 496-502.
- Bohorquez M, Koch C, Trygstad T, Pandit N (1999) A Study of the Temperature-Dependent Micellization of Pluronic F127. J Colloid Interface Sci 216: 34-40.
- Anghel DF, Winnik FM, Galatanu N (1999) Effect of the surfactant head group length on the interactions between polyethylene glycol monononylphenyl ethers and poly(acrylic acid). Colloids and Surfaces A: Physicochemical and Engineering Aspects 149: 339-345.
Copyright: This is an open access article distributed under the terms of the Creative Commons Attribution License, which permits unrestricted use, distribution, and reproduction in any medium, provided the original work is properly cited.
