Indexed In
- Open J Gate
- Genamics JournalSeek
- Academic Keys
- JournalTOCs
- CiteFactor
- Ulrich's Periodicals Directory
- Access to Global Online Research in Agriculture (AGORA)
- Electronic Journals Library
- Centre for Agriculture and Biosciences International (CABI)
- RefSeek
- Directory of Research Journal Indexing (DRJI)
- Hamdard University
- EBSCO A-Z
- OCLC- WorldCat
- Scholarsteer
- SWB online catalog
- Virtual Library of Biology (vifabio)
- Publons
- Geneva Foundation for Medical Education and Research
- Euro Pub
- Google Scholar
Useful Links
Share This Page
Journal Flyer

Open Access Journals
- Agri and Aquaculture
- Biochemistry
- Bioinformatics & Systems Biology
- Business & Management
- Chemistry
- Clinical Sciences
- Engineering
- Food & Nutrition
- General Science
- Genetics & Molecular Biology
- Immunology & Microbiology
- Medical Sciences
- Neuroscience & Psychology
- Nursing & Health Care
- Pharmaceutical Sciences
Research - (2022) Volume 13, Issue 3
Studies on the Suitability of Soil Solirazation as a Physical Control Mechanism to Manage Phytonematode Population in the Soil and its Effect on Plant Growth
Zafar Sultan1*, Aminu Imam1, Abdulmumin A. Nuhu, Minjibir A1 and Muhammad SI22Department of Biological Sciences, Federal University, Dutse, PMB 7156, Jigawa, Nigeria
Received: 12-Mar-2022, Manuscript No. JPPM-22-15776; Editor assigned: 18-Mar-2022, Pre QC No. JPPM-22-15776 (PQ); Reviewed: 01-Apr-2022, QC No. JPPM-22-15776; Revised: 06-Apr-2022, Manuscript No. JPPM-22-15776 (R); Published: 13-Apr-2022
Abstract
Plant Growth-Promoting Rhizobacteria (PGPR) are able to promote plant growth and/or induce local and systemic resistance against biotic and abiotic stresses, but the stability and durability of their efficiency still need more investigation. The present work aims to identify a compatible-PGPR-mixture effective to stimulate wheat growth, resistance against Mycosphaerella graminicola, the causal agent of Septoria tritici leaf Blotch (STB), and tolerance to drought stress.
The interactions between twenty-six PGPR and four wheat cultivars with different resistance levels to STB, in individual and co-inoculations, were tested. The results demonstrated higher external and internal root colonisation potential of Paenibacillus sp. strain B2 (PB2) in a mixture, referred hereafter as Mix-3, with strains Arthrobacter sp. SSM-004 and Microbacterium sp. SSM-001, and without an impact of wheat genotype and growth stage, as observed in its individual inoculations. Only with Mix-3 was wheat growth promotion observed. Interestingly, PB2 and Mix-3 eliminated the negative impact of drought stress on the Foliar Dry Biomass (FDB) and Root Dry Biomass (RDB).
Only in a mixture of three-compatible-PGPR (Mix-3) was plant growth promotion observed and the tolerance induced to drought stress was more effective. However, it seems that resistance induced against STB is PB2-dependent.
Keywords
Mycosphaerella graminicola; Drought stress; Induced systemic resistance; Plant growth-promoting rhizobacteria
Introduction
Soil solarization is described by many scholars and researchers as a non-chemical, soil treatment that utilizes solar radiation and a thin film of transparent mulch, usually of polyethylene, to heat the soil so that it reaches temperatures (ranging from 38°C to 50°C to a depth of about 10 cm to 20 cm) detrimental to soil-borne pests [1,2]. Soil solarization has been studied as an alternative to chemical soil fumigants like methyl bromide or 1, 3-dichloropropane, which disinfect the top soil layer but are also harmful to non-target organisms. Some of the pioneering work done on soil solarization has been conducted in Hawaii. Hagan, 1933 tried to increase the soil temperature with cellophane films to control nematodes in pineapple fields [3]. However, soil solarization did not become popular until six years later, when Groshevoy 1939 demonstrated that exposing soil to solar heat controlled soil-borne pathogens. In 1971, Adams became the first to use polyethylene mulch to control a soil-borne pathogen, black root rot (Thielaviopsis basicola), on sesame. Pullman and Devay 1977 published work that indicated there were wide applications for soil solarization. In 1981, Pullman et al. coined the term “soil solarization”. Since then, many scholars and researchers have demonstrated the use of soil solarization for the management of nematodes and other soil-borne pathogens [4].
Tomato (Lycopersicon esculentum) is one of the most widely consumed fresh vegetable in the world. They are fruits, but they are commonly referred to as vegetable. Fresh-market tomatoes are a popular and versatile fruit vegetable, making significant contributions to human nutrition throughout the world for their content of sugars, acids, vitamins, minerals, lycopene and other carotenoids, among other constituents. Being a climacteric and perishable vegetable, tomatoes have a very short life span, usually 2-3 weeks. Tomatoes are consumed widely throughout the world and their consumption has recently been demonstrated to possess health benefits because of their rich content of phytonutrients [5].
Phytonematodes are plant-parasitic nematodes belonging to the group Nematoda. They have global habitat especially problematic in areas with tropical or sub-tropical type of climate. About 2000 plants worldwide are susceptible to infection by phytonematodes and they cause approximately 5% of global crop loss [6]. Second stage larvae of phytonematodes infect plant roots, causing the development of a variety of histological and chemical changes in the plant body and drain the plant’s photosynthate and nutrients. Infection of young plants may be lethal, while infection of mature plants causes decreased yield.
Phytonematodes are important limiting factor in plant growth. Majority of the plant species, which account for the world’s major food supply, is susceptible to attack from phytonematodes. They are capable of causing economic losses in terms of quantity and quality of the crops. The crop losses caused by phytonematodes in economic terms are estimated to be about $ 157 billion annually to the world agriculture [1]. Yield losses due to root-knot nematodes (Meloidogyne spp.) range from 35.0% to 39.7% [7].
Every part of higher plants (roots, stems, trunk, and leaves) is susceptible to attack by one or more plant parasitic nematode (PPN) species. PPN are a serious challenge to farmers and home gardeners. The use of soil fumigants for pest control is often undesirable due to their residual toxicity in plants and soils and unfavourable effects on humans and animals. The complexity of treatment, high cost of chemicals and increasing interest for organic agriculture demands unconventional ways of phytonematode management [8].
Soil solarisation is a tested method in many tropical and subtropical countries; however, location specific studies are lacking in Nigeria in general and Northern Nigeria in particular. It is hypothesized that the use of this method allows the plants to developed healthy root and shoot system and improves the growth of plant and soil structure which needs to be investigated and documented.
The aim of this research was to study the suitability of soil solarisation as a physical control mechanism to manage phytonematode population in soil and its effect on plant growth in Northern Nigeria.
Materials and Methods
Study area
The study was conducted from June to September 2019 in the experimental fields of Yusuf Maitama Sule University, Kano. Kano is a state located in the north-western Nigeria and borders Katsina state to the north-west, Jigawa state to the north-east and Bauchi and Kaduna states to the south [9]. It’s coordinated positioning lies between latitude 130° in the North and 110° in the South and longitude 80° in the West 100° in the East. Kano State is made up of forty-four local government areas (administrative units). The total land area of Kano state is 20,760 km2 with the population of approximately 10 million people with majority of them belonging to the agrarian society. Kano has a mean height of about 472.45 m above sea level with an average rainfall of 696.4 mm/year. In Kano, the month with the most daily hours of sunshine is May with an average of 11.32 hours of sunshine. In total there are 350.88 hours of sunshine throughout May. The month with the fewest daily hours of sunshine in Kano is January with an average of 10.42 hours of sunshine a day. In total there are 312.57 hours of sunshine in January [10]. On an average around 3748 hours of sunshine are counted in Kano throughout the year and there are 123.29 hours of sunshine per month (Figure 1).
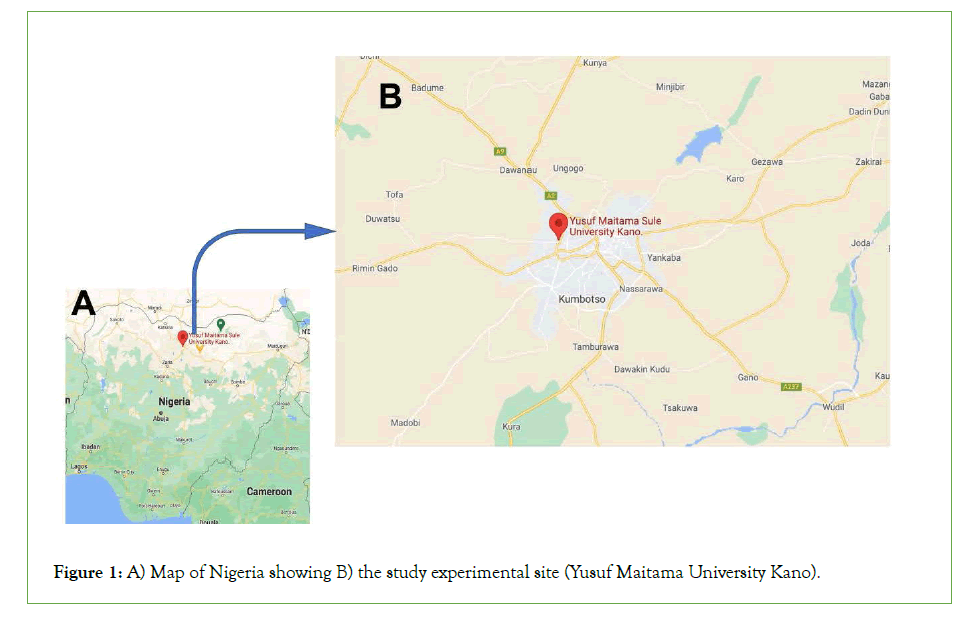
Figure 1: A) Map of Nigeria showing B) the study experimental site (Yusuf Maitama University Kano).
Site layout
The experimental site was divided into 12 beds of 1 × 3 m beds each and labelled T1, T2, T3 and Control. There were three replicates for each treatment i.e., 3 plots for each treatment were used [11]. Each bed was covered with a different thickness of polythene sheets. Untreated and uncovered beds served as control. All the beds were dug approximately up to 20 cm of depth (Figure 2).
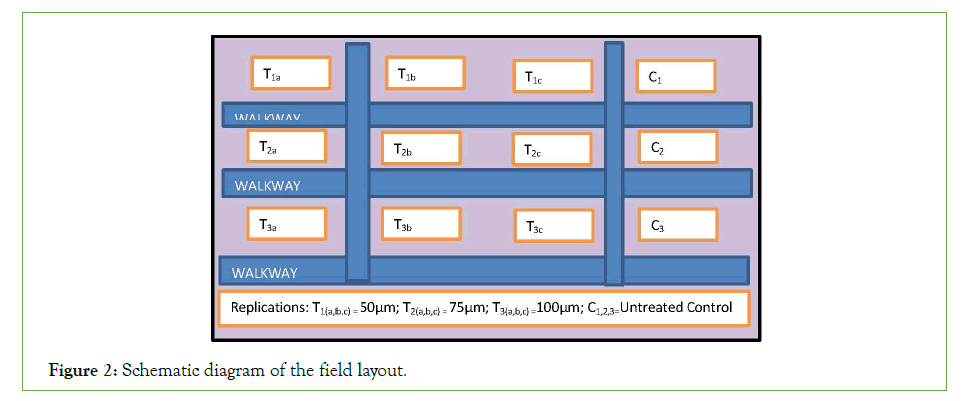
Figure 2: Schematic diagram of the field layout.
Polythene sheet
Polythene sheets of different thickness viz. 50 μm, 75 μm and 100 μm, to cover the soil beds so as to find the best option for soil solarisation was used. The size of the sheets was 1.5 m × 3 m for all the nine beds [12].
Soil sampling
The soil samples were collected using an auger from all the 4 plots weekly to monitor the effect of soil solarisation. The soil samples are collected at a depth of 10 cm from each of the plots where polythene sheets were covered and from the control. The samples were collected weekly to quantify the presence, number and types of phytonematodes in the soil for 5 weeks starting from May 2018. The same field was planted with tomato plants having 9 plants in each bed after soil solarisation. Observations were recorded on structured format and were duly digitalized weekly. The plants were left to a height of 20 cm when the growth parameters were noted [13,14].
The temperature of the soil was measured using digital soil thermometer which was inserted in the soil and removed after few minutes. The readings on the thermometer were then recorded.
The plots were then compared among themselves after the duration of time [15].
Phytonematodes extraction from the soil
Each soil sample was thoroughly mixed, and a subsample of 100 ml soil was assayed for nematodes [16]. For the root samples, a subsample of 10 g roots were washed, chopped into 1 to 2 cm pieces and ground for 1 to 2 minutes using a blender and nematodes were extracted using the above mentioned technique. Phytonematodes were recovered after an incubation period of 48 hrs and identified to genus level in a count plate under a binocular microscope. To confirm the observation with a magnifying binocular microscope and refine the identification a post-lethal observation of individuals killed by heat was carried out. Nematodes were fixed in 4% formalin, processed in glycerol, and mounted on a glass slide based on a standard procedure. Observations were done under the microscope at X4, X10, X40 and X100 following the identification keys. Three subsamples with equal volume (10 ml) were counted three times, and the average was used to estimate the nematode population prevalence and densities. Prevalence, computed as frequency, of the recorded genera in each zone was calculated according to Luquini 2019.
Prevalence: [(number of field positive for genus)/(total number of fields in zone)] x100
Identification of phytonematodes
A sample of nematode is carefully placed on a glass slide and a drop of water was added. The glass slide was placed under a microscope and viewed at different magnification until a clear image was obtained. Meloidogyne species were identified using perennial pattern observations under compound microscope. An available key was consulted for identification of phytonematodes 002E [17].
Recording of growth parameters (Duraisamy, 2017)
The growth of the parameters was defined and plants were observed on the following parameters after they attain a height of 20 cm [18- 25].
All the treated plots were planted with local variety of tomato seedlings and were observed over a period of five (5) weeks for different growth parameters viz. Root and shoot weight, root and shoot length and number of branches, buds, flowers and fruits were recorded. Untreated plots served as control. Volumetric data was collected every week and compared with the control.
Statistical analysis
The collected data were processed using Microsoft Excel and R statistical programing language (R Development Core Team 2021) software. Two-way Analysis of Variance (ANOVA) was conducted to see if differences exist across the treatments and controls. This was followed Turkey Post Hoc test to observe where the differences are [26-30].
Results
Nematological studies
Ten (10) major plant parasitic nematodes were recorded from the experimental site in the pre-treatment samples. It was found that IInd stage juvenile of Meloidogyne incognita was highest in number (17.67/100 ml soil) followed by M. javanica (11.00/100 ml soil). These two spp. proves to be the highest in terms of frequency (no. of times each spp. appears in the total sample done) as well with 100% and 91.67% recording from the total samples taken (Table 1).
| S/No. | Types of Phytonematodes | Number/100 ml of soil | Frequency (%) |
|---|---|---|---|
| 1 | Meloidogyne incognita | 17.67 | 100.00 |
| 2 | Meloidogyne javanica | 11.00 | 91.67 |
| 3 | Rotylenchus reniform | 9.67 | 75.00 |
| 4 | Ditylenchus dipsaci | 8.33 | 83.33 |
| 5 | Ditilenchuis destructer | 7.00 | 75.00 |
| 6 | Pratylenchus spp | 5.00 | 58.33 |
| 7 | Trichodorus spp | 4.67 | 83.33 |
| 8 | Xiphinema spp | 8.67 | 83.33 |
| 9 | Paratrichorus spp | 1.33 | 66.66 |
| 10 | Longidorous spp | 9.00 | 33.33 |
Table 1: The types, number and frequency of different phytonematodes recorded from experimental site in 100 ml soil.
Paratrichodorus spp. was recorded as the least number of phytonematodes present in the soil (1.33/100 ml soil) while Longidorus spp. was the least occurring spp. in terms of occurrence [31].
Table 2 depicts percentage reduction in nematode population in soil, solarised over a period of 5 weeks using different thickness of polythene sheets viz. 50 μm, 75 μm and 100 μm. It was found that polythene sheet having a 50 μm was the best in controlling phytonematodes below economic threshold level. It was found that there is gradual increase in the percentage reduction in nematode population from different thickness of polythene sheets from week 1 to week 5 (Table 2).
| S/No. | Types of Phytonematodes | Average no. of PPN in 100 ml soil | ||||||||
|---|---|---|---|---|---|---|---|---|---|---|
| T1 | C1 | % dec. | T2 | C2 | % dec. | T3 | C3 | % dec. | ||
| 1 | Meloidogyne incognita | 3.67 | 10.33 | 64.52 | 5.67 | 10.00 | 43.33 | 10.00 | 10.67 | 6.25 |
| 2 | Meloidogyne javanica | 2.67 | 8.67 | 69.23 | 3.67 | 8.00 | 54.17 | 8.00 | 7.67 | -4.35 |
| 3 | Rotylenchus reniform | 3.00 | 10.33 | 70.97 | 4.00 | 10.00 | 60.00 | 10.00 | 10.67 | 6.25 |
| 4 | Ditylenchus dipsaci | 2.00 | 6.33 | 68.42 | 2.67 | 6.67 | 60.00 | 6.67 | 5.67 | -17.65 |
| 5 | Ditilenchuis destructer | 2.33 | 6.33 | 63.16 | 3.67 | 6.33 | 42.11 | 6.33 | 6.67 | 5.00 |
| 6 | Pratylenchus spp | 3.00 | 8.33 | 64.00 | 3.67 | 9.33 | 60.71 | 9.33 | 8.00 | -16.67 |
| 7 | Trichodorus spp | 2.67 | 8.67 | 69.23 | 5.33 | 9.00 | 40.74 | 9.00 | 8.33 | -8.00 |
| 8 | Xiphinema spp | 4.33 | 10.33 | 58.06 | 6.67 | 11.00 | 39.39 | 11.00 | 11.67 | 5.71 |
| 9 | Paratrichorus spp | 4.00 | 8.67 | 53.85 | 5.67 | 8.00 | 29.17 | 8.00 | 9.67 | 17.24 |
| 10 | Longidorous spp | 3.33 | 9.00 | 62.96 | 5.33 | 9.33 | 42.86 | 9.33 | 9.00 | -3.70 |
| Total | 31.00 | 86.99 | 64.37 | 46.35 | 87.66 | 47.12 | 87.66 | 88.02 | 0.01 | |
Table 2: Shows the average percentage reduction in phytonematodes population under different polythene sheet recorded over 5 weeks under field conditions.
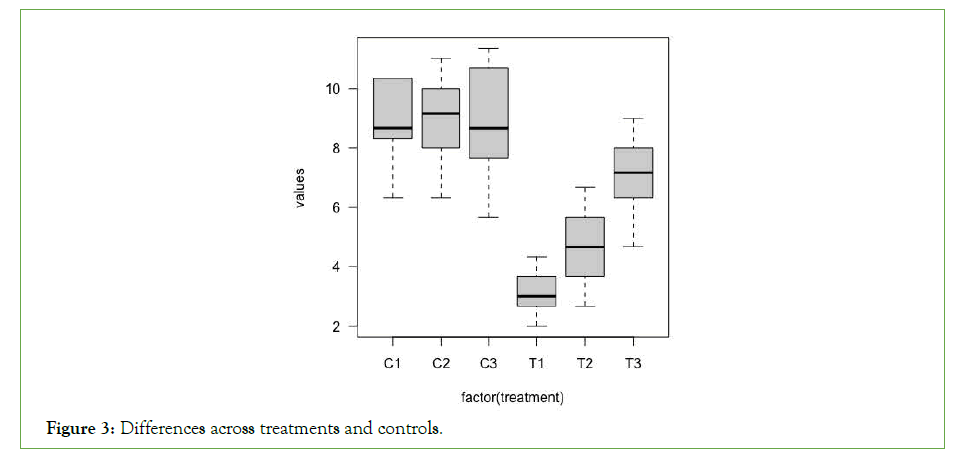
Two-way ANOVA showed significant differences across the treatments and controls (df=5, p<0.01). Turkey Post Hoc test reveals the differences that exist between the treatments and controls (Table 3 and Figure 3).
Figure 3: Differences across treatments and controls.
| diff | lwr | upr | p adj | |
|---|---|---|---|---|
| C2-C1 | 0.067 | -1.7781322 | 1.91213224 | 0.9999979 |
| C3-C1 | 0.168 | -1.6771322 | 2.01313224 | 0.9997980 |
| T1-C1 | -5.599 | -7.4441322 | -3.75386776 | 0.0000000 |
| T2-C1 | -4.064 | -5.9091322 | -2.21886776 | 0.0000004 |
| T3-C1 | -1.598 | -3.4431322 | 0.24713224 | 0.1255917 |
| C3-C2 | 0.101 | -1.7441322 | 1.94613224 | 0.9999837 |
| T1-C2 | -5.666 | -7.5111322 | -3.82086776 | 0.0000000 |
| T2-C2 | -4.131 | -5.9761322 | -2.28586776 | 0.0000003 |
| T3-C2 | -1.665 | -3.5101322 | 0.18013224 | 0.0991851 |
| T1-C3 | -5.767 | -7.6121322 | -3.92186776 | 0.0000000 |
| T2-C3 | -4.232 | -6.0771322 | -2.38686776 | 0.0000001 |
| T3-C3 | -1.766 | -3.6111322 | 0.07913224 | 0.0681427 |
| T2-T1 | 1.535 | -0.3101322 | 3.38013224 | 0.1552498 |
| T3-T1 | 4.001 | 2.1558678 | 5.84613224 | 0.0000006 |
| T3-T2 | 2.466 | 0.6208678 | 4.31113224 | 0.0029928 |
Table 3: Tukey Post Hoc test across the treatments and controls.
Growth parameters
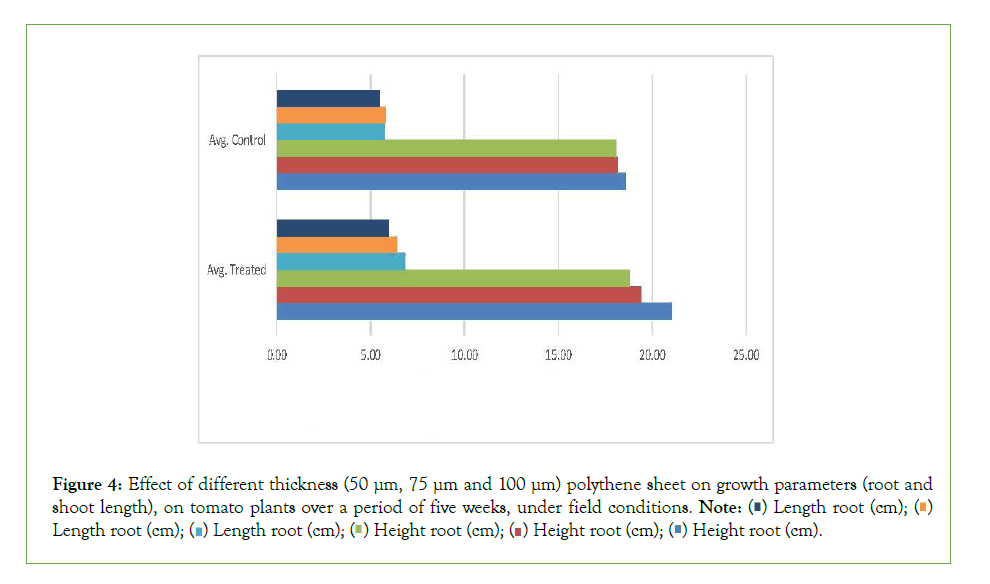
Length of root: The mean root lengths after the observation period were 6.82 cm, 6.40 cm and 5.96 cm for the plots treated with 50 μm, 75 μm and 100 μm thick polythene sheets, respectively (Figure 4). While the average root lengths for untreated control were 5.76, 5.80 and 5.46 cm (average 5.67 cm). The mean difference in root lengths when compared with the average root length of control plants were 20.21%, 12.81% and 5.05% for plants under 50 μm, 75 μm and 100 μm thick polythene treated plots, respectively. The percentage differences were on the positive side of the enhancement over control.
Figure 4:Effect of different thickness (50 μm, 75 μm and 100 μm) polythene sheet on growth parameters (root and shoot length), on tomato plants over a period of five weeks, under field conditions.

Length of shoot: The mean shoot lengths over a period of five weeks were 21.04 cm, 19.42 cm and 18.78 cm under plots treated with 50 μm, 75 μm and 100 μm polythene sheets, respectively. During the same period the average control shoot height was registered as 18.26 cm. In terms of percentage difference, it again registered 15.24%, 6.37% and 2.86% increase for plants grown in plots treated with 50 μm, 75 μm and 100 μm polythene sheets, over the average shoot length of control (Figure 4).
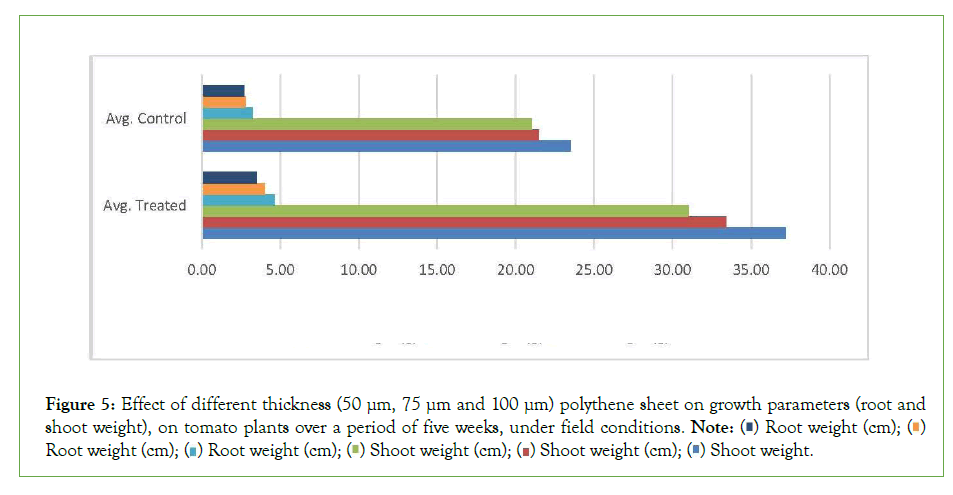
Root weight: The mean root weights were 4.64 g, 4.04 g and 3.48 g under plots treated with 50 μm, 75 μm and 100 μm polythene sheets, respectively, over period of five weeks. The average root weight of tomato plants was 2.90 g for control during the same period of time. The root weight registered an increasing trend under treated plots with 50 μm, 75 μm and 100 μm thick polythene sheets treated plots showing a growth of 60.00%, 39.31% and 20.00% respectively over control [32].
Shoot weight: An overall, pronounced positive enhancement in the shoot weights of plant grown on plots treated with different (30 μm, 75 μm and 100 μm) thicknesses of polythene sheets were observed. Mean shoot weight of plants grown on plots treated with 50 μm, 75 μm and 100 μm thick polythene sheets were 37.20 g, 33.42 g and 31.00 g over a period of five weeks. The average shoot weight of controlled plants was 22.01 g during the same period. The total difference was 69.04%, 51.86% and 40.87% for the three different polythene thicknesses respectively (Figure 5).
Figure 5:Effect of different thickness (50 μm, 75 μm and 100 μm) polythene sheet on growth parameters (root and shoot weight), on tomato plants over a period of five weeks, under field conditions.

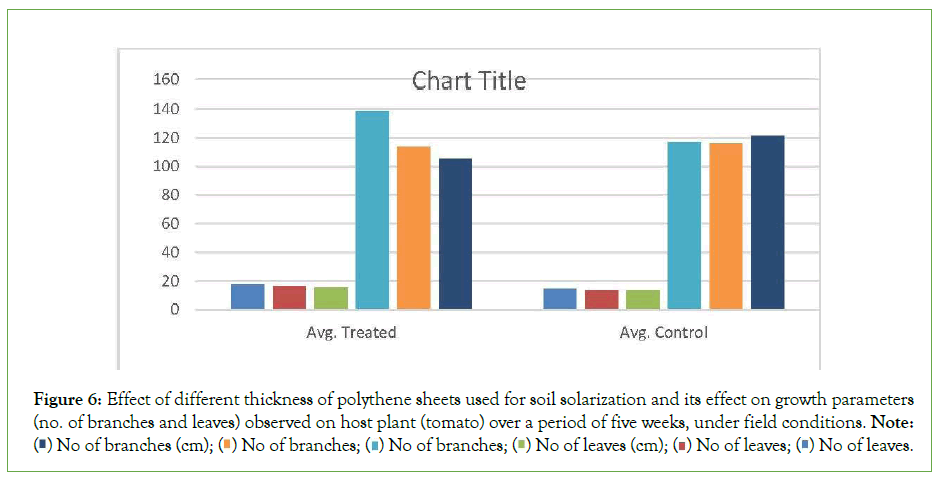
Number of branches: The mulching treatment with different thickness of polythene (50 μm, 75 μm and 100 μm) used to treat the beds yielded positive results in terms of enhancement in number of branches being produced by the plants. Specifically, it was found that over a period of five weeks’ time, plants sown in beds covered with a 50 μm sheets showed 26.82% higher number of branches than controlled. Likewise, plants sown o beds covered earlier with 75 μm and 100 μm sheets, showed 18.47% and 10%, 84%, higher number of branches.
Number of leaves: The enumeration data showed an inconsistent counting over a period of five weeks, where by the plants sown in beds covered with a 50 μm sheets showed 17.40% higher number of leaves than in plants sown in controlled beds. However, plants sown in beds which were earlier covered with 75 μm and 100 μm polythene sheets registered a negative growth of 3.58% and 10.85% respectively (Figure 6).
Figure 6: Effect of different thickness of polythene sheets used for soil solarization and its effect on growth parameters (no. of branches and leaves) observed on host plant (tomato) over a period of five weeks, under field conditions. Note:
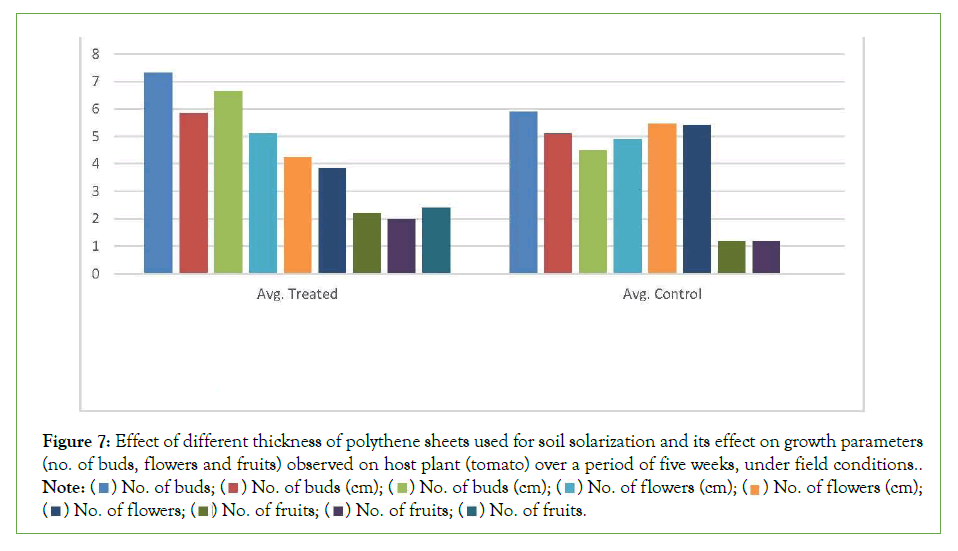
Number of buds: The numbers of buds were high in all the plants sown in beds covered with different thickness of polythene sheets (50 μm, 75 μm and 100 μm) in comparison to plants sown in controlled plants. The plants sown on beds covered earlier by 50 um sheets showed an increase of 41.29% than controlled bed’s plants. A total of 13.23 and 28.73% increase in the total number of buds were also recorded in plants sown on beds covered with 75 μm and 100 μm polythene sheets [33-35].
Number of flowers: The flower settings over a period of five weeks’ time showed some marked variation. It was found that average no. of flowers over the said period were 3.81% higher than control, in plants planted over the beds earlier covered with 50 μm polythene sheets. However, plants sown in beds earlier covered with 75 μm and 100 μm sheets showed a negative growth of 22.86% and 29.52% over control (Figure 7).
Figure 7:Effect of different thickness of polythene sheets used for soil solarization and its effect on growth parameters (no. of buds, flowers and fruits) observed on host plant (tomato) over a period of five weeks, under field conditions.

Discussion
In Table 1, the types, number and frequency of phytonematodes where presented. 10 phytonematodes were observed in which Meloidogyne incognita has the highest number of occurrence and Paratrichorus spp. has the lowest number of occurrence. Many scientists like Abad 2008, Bello 2020, Berry 1972 have reported that M. incognita population was highest in irrigated fields of Nigeria. In Table 2, there is a significant reduction in the number of phytonematodes which is in line with many observations done in many countries of the world. Shut 2021 also reported from Nigeria that the overall population of phytonematode in solarized soil was significantly higher than in unsloarized soil, which is in line with the present finding. Table 2 also shows that the plots that were covered with polythene sheet with the thickness of 50 μm have the highest reduction in phytonematodes population and that of 75 μm. The polythene sheet with 100 μm how ever showed the least reduction in phytonematode population which is line with the work of Porter and Merriman 1983 on solarisation that shows that there is significant reduction in phytonematodes population in solarized soil. The findings were also supported by work of Al- Kayssi and Karaghouli, 2002.
It also shows the various soil temperatures on different thickness of polythene sheets over 5 weeks, there is gradual increase in temperature among the plots covered with polythene sheets and it was found that the polythene sheet with the thickness 50 μm has the highest temperature rise while the polythene sheets with thickness of 100 μm has the lowest temperature. Carson and Otoo 1996 in their work of non-chemical management concluded that the plastic layers with thinner thickness (50 μm) have the lower light reflect compared to the thicker 100 μm and the medium 75 μm, so it could increase the soil temperature more than the other two. The present findings are in line with the presented reference.
Table 3 shows the records of growth parameters that were taken during the survey in three different plots covered with 50 μm, 75 μm and 100 μm polythene sheets thick. The plot that was covered with 50 μm polythene sheet shows the highest number of leaves, fruits, and flowers content followed by 75 μm with the medium content then 100 μm with the least the correlated with the work of Katan, 2000.
The percentage reduction in the number of phytonematode was significantly affected by the different thickness level of polythene sheets. The fact that the observed variance ratio (F=9.48), was greater than the table values (F=3.35, P<0.05) suggests that there was a highly significant treatment effect. The post-experimental analysis LSD, indicated that the difference between all the three treatment means (50 μm and 75 μm, 50 μm and 100 μm, 75 μm and 100 μm) were greater than the LSD value (3.99). This indicated that the mean of 100 μm (36.23) was significantly lower than the other treatment means. The differences between the means were significant as they exceeded 3.99. Since the mean of treatment 50 μm (44.69) was greater than other treatment means, it can be concluded that it induced greatest percentage reduction in number of phytonematode followed by 75 μm, while 100 μm resulted in a significantly lower percentage reduction in phytonematode.
Conclusion
From the results obtained, it can be concluded that planting tomato on solarized mulched plot was better in the control of phytonematode infestation. Under the warm weather conditions of Northern Nigeria, solarization was proved to be an effective technique for an environmentally sustainable and cost-effective disinfestation of soil. It is therefore, recommended as a potential alternative to chemical measure in controlling phytonematode infestation and in maximizing tomato yield under field conditions in Nigeria. This can be attributed to the overall enhancement in various growth parameters such as; root length, shoot length, number of branches, number of leaves, number of flowers, number of fruits and yield respectively. It is however, recommended that further investigation be evaluated across different locations with varied soil types in Nigeria.
REFERENCES
- Abad P, Gouzy J, Aury JM, Castagnone-Sereno P, Danchin EG, Deleury E, et al. Genome sequence of the metazoan plant-parasitic nematode Meloidogyne incognita. Nat Biotechnol. 2008; 26(8): 909-915.
[Crossref], [Google scholar], [Indexed]
- Al-Karaghouli AA, Al-Kayssi AW. Influence of soil moisture content on soil solarization efficiency. Renew Energy. 2001; 24(1): 131-144.
[Crossref], [Google scholar]
- Al-Kayssi AW, Al-Karaghouli A. A new approach for soil solarization by using paraffin-wax emulsion as a mulching material. Renew Energy. 2002; 26(4): 637-648.
[Crossref], [Google scholar]
- Bello TT, Coyne DL, Rashidifard M, Fourie H. Abundance and diversity of plant-parasitic nematodes associated with watermelon in Nigeria, with focus on Meloidogyne spp. Nematology. 2020; 22(7): 781-797.
[Crossref], [Google scholar]
- Berry SD, Fargette M, Spaull VW, Morand S, Cadet P. Detection and quantification of root-knot nematode (Meloidogyne javanica), lesion nematode (Pratylenchus zeae) and dagger nematode (Xiphinema elongatum) parasites of sugarcane using real-time PCR. Mol. Cell. Probes. 2008; 22(3): 168-176.
[Crossref], [Google scholar], [Indexed]
- Bhowmik D, Kumar KS, Paswan S, Srivastava S. Tomato-a natural medicine and its health benefits. J. pharmacogn. Phytochem. 2012; 1(1): 33-43.
- Bridge J. Plant parasitic nematodes of irrigated crops in the northern states of Nigeria. Plant parasitic nematodes of irrigated crops in the northern states of Nigeria. 1972(42).
- Carson G, Otoo E. Application of soil solarization to control root-knot nematodes and weeds in transplanted tomato. Ghana Journal of Agricultural Science. 1996; 29(2): 91-98.
[Crossref], [Google scholar]
- Chellemi DO, Olson SM, Scott JW, Mitchell DJ, McSorley R. Reduction of phytoparasitic nematodes on tomato by soil solarization and genotype. J Nematol. 1993; 25(4S): 800.
[Google scholar], [Indexed]
- Coyne DL. Practical plant nematology: a field and laboratory guide. IITA. 2007.
- Vivek P, Duraisamy VM. Study of growth parameters and germination on tomato seedlings with different growth media. Int J Agric Sci Res. 2017; 7(3): 461-470.
- Gamliel A, Becker E. A method for applying plastic mulch. Israeli Patent. 1996; (118787).
- Gamliel A, Katan J. Soil and substrate disinfestation in protected structures. Fusarium wilts of greenhouse vegetable and ornamental crops. 2012: 121-131.
[Crossref], [Google scholar]
- Grooshevoy SE. Disinfection of seed-bed soil in cold frames by solar energy. Rev Appl Mycol. 1939; 18: 635-636.
- Hagan HR. Hawaiian pineapple field soil temperatures in relation to the nematode Heterodera radicicola (greef) MÜLLER. Soil Sci. 1933; 36(2): 83-95.
- Hamilton HC, Strickland MS, Wickings K, Bradford MA, Fierer N. Surveying soil faunal communities using a direct molecular approach. Soil Biol Biochem. 2009; 41(6): 1311-1314.
[Crossref], [Google scholar]
- Hartman KM, Sasser JN. Identification of Meloidogyne species on the basis of differential host test and perineal-pattern morphology.
- Jain AK, Kumar S, Panwar JD. Response of mung bean (Vigna radiata) to phosphorus and micronutrients on N and P uptake and seed quality. Legume Research-An International Journal. 2007; 30(3): 201-204.
- Jonathan EI, Kumar S, Devarajan K, Rajendran G. Nematode pests of commercial flower crops. Fundamentals of plant nematology. 2001:20-48.
- Katan J. Solar heating (solarization) of soil for control of soilborne pests. Annu Rev Phytopathol. 1981; 19(1): 211-236.
- Katan J. Soil and substrate disinfestation as influenced by new technologies and constraints. International Symposium on Chemical and Non-Chemical Soil and Substrate Disinfectation. 2000; 29-38. [Google scholar]
- Luquini L, Barbosa D, Haddad F, Ferreira CF, Amorim EP. Nematode survey and biochemical characterization of Meloidogyne spp. in a main banana production area in Brazil. Crop Prot. 2019; 117: 94-99.
[Crossref], [Google scholar]
- McGovern RJ, McSorley R, Bell ML. Reduction of landscape pathogens in Florida by soil solarization. Plant Disease. 2002; 86(12): 1388-1395.
[Crossref], [Google scholar], [Indexed]
- McSorley R, McGovern RJ. Effects of solarization and ammonium amendments on plant-parasitic nematodes. J Nematol. 2000; 32(4S): 537.
[Google scholar], [Indexed]
- McGovern RJ, McSorley R, Wang KH. Optimizing bed orientation and number of plastic layers for soil solarization in Florida. InProceedings. 2004.
- Orisajo SB, Fademi OA. Plant-parasitic nematodes associated with coffee in Nigeria. International Journal of Science and Nature. 2012; 3(4): 768-772.
- Pullman GS, DeVay JE. Control of Verticillium dahliae by plastic tarping. InProc Am Phytopath Soc. 1977; 4: 210.
- Pullman GS, DeVay JE, Garber RH. Soil solarization and thermal death: A logarithmic relationship between time and temperature for four soilborne plant pathogens. Phytopathology. 1981; 71(9): 959-964.
- Porter IJ, Merriman PR. Effects of solarization of soil on nematode and fungal pathogens at two sites in Victoria. Soil Biol Biochem. 1983; 15(1): 39-44.
[Crossref], [Google scholar]
- Team RC. R: A language and environment for statistical computing. 2021.
- Reddy DD. Analysis of crop losses in tomato due to Meloidogyne incognita. Indian J Nematol. 1985; 15(1): 55-59.
- Sasser JN, Carter CC. Overview of the international Meloidogyne project. 1985. 1975-1984.
- Shutt VM, Affiah DU, Okechallu BO, Wonang DL. Efficacy of soil solarization on the control of root-knot nematodes infecting eggplant (Solanum melongena) in Plateau State. Afr. J. Plant Sci. 2021; 15(6): 144-150.
[Crossref], [Google scholar]
- Siddiqi MR. Tylenchida: Parasites of plants and insects. CABI. 2000.
[Crossref], [Google scholar], [Indexed]
- Simonne EH, Dukes MD, Haman DZ. Principles and practices of irrigation management for vegetables: AE260/CV107, rev. 11/2006. EDIS. 2006; 3.
Citation: Sultan Z, Imam A, Nuhu AA, Minjibir A, Muhammad SI (2022) Studies on the Suitability of Soil Solirazation as a Physical Control
Mechanism to Manage Phytonematode Population in the Soil and its Effect on Plant Growth. J Plant Pathol Microbiol. 13:605.
Copyright: © 2022 Sultan Z, et al. This is an open-access article distributed under the terms of the Creative Commons Attribution License, which permits unrestricted use, distribution, and reproduction in any medium, provided the original author and source are credited.
