Indexed In
- Open J Gate
- Academic Keys
- RefSeek
- Hamdard University
- EBSCO A-Z
- OCLC- WorldCat
- Publons
- Euro Pub
- Google Scholar
Useful Links
Share This Page
Journal Flyer

Open Access Journals
- Agri and Aquaculture
- Biochemistry
- Bioinformatics & Systems Biology
- Business & Management
- Chemistry
- Clinical Sciences
- Engineering
- Food & Nutrition
- General Science
- Genetics & Molecular Biology
- Immunology & Microbiology
- Medical Sciences
- Neuroscience & Psychology
- Nursing & Health Care
- Pharmaceutical Sciences
Research - (2021) Volume 9, Issue 2
Specific Cytokine Assay for the Diagnosis and Prognosis of Malaria in Adult Patients in a Holoendemic Lagos, Nigeria
Christian Azubike Enwurua1*, Toyn Awoderua1, Nkechi Veronica Enwurub2, Samuel Nduagaa1, Faustina Uloma Ezeamaramua1, Samuel Akindelea1, Morakinyo Bamikole Ajayia1 and Adeshna A. Adeigaa12Department of Pharmacy, University of Lagos, Yaba, Idiaraba, Nigeria
Received: 05-Mar-2021 Published: 22-Mar-2021, DOI: 10.35248/2329-9088.21.9.234
Abstract
Background: During Plasmodium falciparum infection, cytokines are said to be elevated in the peripheral blood and may contribute to parasite clearance and also, likely to be responsible for many of the symptoms and pathological changes observed during malaria disease.
Aim: this study evaluated specific cytokines as possible tool for diagnosis and prognosis of uncomplicated malaria in adult patients.
Methods: Prospective 147 apparently malaria adult patients were microscopically screened and parasite load quantified. Blood donors (n=30) were used as control group A (CA) and parasite negative patients (n=26) as control group B (CB). The study took place between Aug. and Dec. 2014. The Cytokines (IL 12 and IL 18) levels were measured using ELIZA method. The data generated were analyzed using SPSS (15) two step cluster analysis for categorical variable and ANOVA excel single factor package was used to test significance differences between test and control groups.
Results: Only 34/147 (23.1 %) were malarial positive, with mean parasite density of 2,384 ± 26,191 parasites/μl. Uncomplicated adult malaria had lower (30.2 ± 56.7ng/L) IL-12 concentration when compared with the controls and higher (30.9 ± 36.5ng/L) IL-18 for CA and not for CB. The mean analyses of variance between the groups were not statistically significant at 95% confidence interval: IL- 12 T versus (vs.) CA, P=0.899; IL-12 T vs. CB, P=0.600. For cytokine IL-18 (T) vs. CA, P=0.674; IL-18 (T) vs. CB, P=0.509. There was no significant difference between the two control groups: IL -12 CA vs. CB, P=0.7696 and IL-18 CA vs. CB, P=0.599.
Conclusion: Excluding the outliers, the low production of IL-12 with higher level of IL-18 by majority of the patients indicates protective characteristics of pro-inflammatory cytokines studied; this is prognostic in nature. However, the report of mean ratio (IL-12/lL18) of 0.886, 0.955 and 0.916 ng/L for the T, CA and CB respectively were not discriminatory and therefore not diagnostic.
Keywords
Malaria; Diagnosis; Prognosis; Cytokines
Introduction
Malaria is a serious disease with high morbidity and mortality [1,2]. It is one of the most prominent African public health concerns, being responsible for about 228 million global morbidity and mortality of 405, 000 in 2018 alone[3]. Africa harbors up to 93% of global malaria mortality [4]. Malaria disease is either mild or severe; these classifications determine clinical management strategy and provide tool for understanding the disease prognosis [4]. Early and specific diagnosis is imperative for its containment. Presently, malaria microscopy is the gold standard for confirmation of malaria infection, which takes sometimes hours and molecular method is expensive [5].The parasite load plays a critical role in proper clinical staging of a malarial patient; thus, classifying them according to the state of criticality.
Cytokines have been severally reported as good disease predictor [1,6]. Cytokines are small low molecular weight (8-25 KD) glycoproteins, usually short-lived, that take part in cell activation, inflammation, immunity, tissue repairs, fibrosis, morphogenesis and chemotaxis [7]. Cytokines are released by one’s cells to regulate the function of other cells. They are not stored within the cells, but are synthesized ‘on demand’ often in response to another cytokine [8]. In this cascade of events, cytokine production may be inhibited or stimulated by parasitic invasion of the human cells [8].
In humans, pro-inflammatory role of IL-18 in Plasmodium species infection as well as the capability of IFN- ¥ induction has been suggested to play a role in protective response of malaria parasite infection in a few studies concerning children [1]. In some reports, excessive production of some cytokines was associated with severe forms of malaria infections; as indicated in a study on adult patients with severe and uncomplicated malaria [9].
Pro-inflammatory cytokines have been associated with protective cell-mediated immunity by their capacity to induce parasite killing by monocytes/macrophages and neutrophils [10]. Antiinflammatory cytokines counteract the production and possible cytopathic effects of pro-inflammatory cytokines and as such may be associated with malaria susceptibility [10]. Not much is known about the role of cytokines in regulating the immune response in holoendemic malaria area and possible quantitative measure to predict outcome of each episode. However, it was reported that relative balance between type 1(Th1) and type 2(Th2) cytokines is thought to be a crucial determinant of whether a response will be protective or pathologic [10].
Both Th1 and Th2 cytokine responses are required to control malarial infection and are both required for adequate protection, likely encompassing different mechanisms fine-tuned in time and intensity [10,11]. Th1 cytokines are important in controlling early parasitemia, although they need to be counterbalanced later in the infection by Th2 response which leads to antibody production [10].
Th1 (IFN-¥, IL -12, IL-18) and Th2 (IL-4, IL-10) produced cytokines may either be pro-inflammatory (TNF ¥, IL-12, IL- 18, IL-1) -associated with severity of malaria disease or antiinflammatory (IL-4, IL-6, IL-10, IFN-¥, TGF ¥,) -associated with protection or less severity of malaria infection [11]. Interleukin (IL)-18 produced primarily by mononuclear phagocytes synergizes with IL-12 for interferon-ϒ production from T, B and natural killer cells [1].
The IL-18 (pro-inflammatory) is regulated by another cytokine IFN ¥ (anti-inflammatory) and IL-12 (pro-inflammatory) is controlled by another, IL-10 (anti-inflammatory) cytokine. It has been reported that early and effective inflammatory response, mediated by gamma interferon (IFN ¥) in the interleukin 12 (IL-12) and 18 (IL-18) dependent manner, seems to be crucial for the control of parasitaemia and resolution of malaria infection through certain unclear mechanisms [9]. On the other hand, severe malaria has long been associated with high circulating levels of pro-inflammatory against anti-inflammatory cytokines associated with less severity of malaria disease [9]. Pro-inflammatory cytokines produced by macrophages are potent immunomodulatory agents and are viewed as potential pathogenic elements that could contribute either directly or indirectly to many pathological processes [11]. Again, it was reported that the production of these two cytokines (IL-18 and IL 12) may be co-regulated, and both have immunoregulatory effect on the immune response in P. falciparum infection [1]. Plasmodium falciparum in turn is the most virulent Plasmodium species and is the most endemic in Nigeria.
If these reports hold, then the levels of IL-12 (pro-inflammatory) controlled by IL-10 (anti-inflammatory) and IL-18 controlled by IFN ¥ (anti- inflammatory) ratio will produce apparent measure of severity of each episode of infection. Against this backdrop, the choice of these pro-inflammatory cytokines (IL-12 and IL- 18) related to control of parasitaemia and severity of disease was made to study un-complicated malaria in adult subjects in an endemic region; this may produce point-of –care malaria severity predictor.
Methods
Study design
The study was a descriptive cross-sectional study involving adult patients with uncomplicated malaria, apparently heathy adult control subjects screened negative for malaria parasite (Control group A) and true malaria negative patients with apparent malaria symptoms that had clinical request for malaria screening (Control Group B).
Study population
Adult patients (147), 18 years and above were recruited using standard malaria staging by clinicians and screened blood donors as apparently healthy control.
Sample size
The sample size was determined using Kelsey sample size determination method for unmatched population test and control study, considering 65-88.5 % hypothetical cases with malaria exposure in endemic region [12,13].
Study site
The sampling was at the Lagos State General Hospital, Randle, Surulere, Lagos and the samples were analysed at the Nigerian Institute of Medical Research, Yaba, Lagos.
Inclusion criteria
Those that consented to the study in writing and presented with malaria symptoms with clinical request for malaria screening were recruited. Clinical records by the clinician and laboratory findings during patients’ visit to the hospital were employed in classifying the cases into groups according to the severity of the disease. Uncomplicated malaria case was distinguished with the use of WHO algorithm [14]. Accordingly, an individual was defined to have had malaria if he/she complained of fever, had body temperature measure exceeding 37.5 °C, with asexual malaria parasites detected in the blood. Uncomplicated malaria was defined for P. falciparum as having parasitaemia of 1,000 to 50,000 parasites/µl [14] (or from previous reports, parasite count with P. falciparum ranging from >24 parasites/ µl [15]; with glycaemia of >50 mg/dl and haemoglobin (Hb) >8 but <11 g/dL or haematocrit <33% in the presence of microscopically detectable asexual parasitaemia [14,15].
Exclusion criteria
Persons below 18 years of age were excluded. Those with Malaria and other apparent clinical manifestations were excluded. Those with severe malaria defined as “having had unarousable coma (cerebral malaria), which persisted for at least 30 min after a seizure with severe malaria anaemia (Hb <5 g/dL or haematocrit <15%) with P. falciparum parasitaemia of >250,000 parasites/ ml” or patients with the two or more of the symptoms heighted by WHO malaria staging algorithm were excluded [14].
Inclusion criteria for controls (A and B)
Apparently healthy blood donors, without any episode of malaria for about two months, with slide negative malaria parasite in their peripheral blood were recruited as control group A. Patients that had apparent malaria symptoms, a clinical request for malaria screening and were negative for malaria parasite were recruited as control group B. All participants gave written informed consent for the study.
Exclusion criteria for control groups
Participants with positive blood malaria parasite and those with other health issues were excluded.
Sample collection: Venous blood samples were collected on the patients’ first visit to the hospital with disposable pyrogen free needle and heparinised vacutainer (KEDTA and fluoride anticoagulant), 5 ml each, for malaria parasite and haematocrit and blood glucose level screening respectively. Blood was aliquoted from each blood donor who consented to the study.
Sample processing for malaria microscopy
Thick and thin smears were made in duplicate on clean greasefree glass slide, allowed to air dry. The thin blood films were fixed briefly with absolute methanol and stained by Giemsa technique, using 3% Giemsa stain for 45 minutes [5].
Parasite load count
The numbers of asexual parasites were counted in relation to a standard number of leukocytes in the thick film. The patients’ true white cells were counted using a multi tally counter and the parasite another counter, using oil immersion objective lens. The numbers of parasites were counted until 200 White Blood Cells (WBC) were counted and 100 or more parasites found. Where after 200 WBC were counted, the numbers of parasites were <100, counting was continued up to 500 WBC. The number of asexual parasites per 200 White Blood Cells (WBCs) or per 500 WBCs and parasite densities were computed; assuming a mean WBC count of 6,000/L [16]. A slide was defined as negative if no asexual forms were found after a minimum of 100 fields were examined in the two slides [17]. Thin films were used for the parasite species identification [15,16]. Further confirmations of results were undertaken by an independent accredited microscopist. Where there was significant variation from the count value obtained by the Principal Investigator and the second microscopist, a third count was obtained to break the ties [16,17].
Computing the parasite density
The number of parasites relative to the number of leukocytes was calculated and expressed as ‘parasites per microliter of blood’ thus: No of parasites counted X 6,000/ No of leukocyte=parasites per microliter [16,18].
Haematocrit
The Packed Cell Volume (PCV) was a measure using centrifugation method [19]. Briefly: blood sample contained in a KEDTA vacutainer was mixed properly and a haematocrit tube 80 iu/ml (Vitrex, Denmark) was filled and sealed with plastercine and placed in a microhaematocrit centrifuge (Hawksly, England), centrifuged at 12,000 g for 10 minutes and measured using the PCV reader.
Serum glucose level determination
Venous blood collected into vacuum tube containing fluoride oxalate anticoagulant was used to determine random serum glucose level for each subject, using automated haemo analyzer (Selectra pro auto-analyzer, England). Vital Signs Taking and the Case Reporting Form (CRF) Completion Full history and clinical staging was conducted on each patient by the nurses and clinician including the body temperature and blood pressure, which were recorded on the CRF.
Cytokine assay
Blood sample was collected within 24 hours from the time each patient presented to the hospital and allowed to clot for 20 minutes at room temperature before centrifugation at 4,000 g (3,000 revolutions per minute) for 5 minutes. The serum was separated and stored at -70oC until used [1]. For cytokine assay, samples were centrifuged again after thawing. (Repeated freezethaw of the specimens was avoided) [1]. Serum concentrations of IL-12 and IL-18 were determined using Enzyme Linked Immuno Sorbent Assays (ELISA) method obtained commercially. All specimens for cytokines were measured in duplicate and the mean of the two values were taken for the analysis. Briefly, 100 µl of diluted sample standard were set to 10 standard wells on the microtiter plate as follows: to the first and 2nd. Well, then the standard diluent (50 µl) were added to the 1st and 2nd. Wells, mixed; 100 µl sample from the 1st and 2nd. Were added to the 3rd. and 4th. Wells respectively, until the last standard well where the last 100 µl was discarded. These was to achieve, according to the manufacturer, the standard concentrations of 7.5, 15, 30, 60 and 90 ng/L and 6, 12, 24, 48, and 72ng/L for IL-18 and IL-12 respectively. Serum sample was pipetted into the separate wells and incubated for 5 minutes so that any of the IL-12 and IL-18 present in each sample was bound to its well by the immobilized antibody. The wells were washed for three times using automated ELISA pre-set specialized plate washer. Biotinylated anti-Human IL-12 and IL-18 antibody was added respectively. After washing away unbound biotinylated antibody, an enzyme Horse Radish Peroxidase (HRP) conjugated streptavidin was pipetted to the wells. During this process, excess liquid was removed at each stage in order to prevent the dilution of the solutions added in the next stage. The wells were again washed for three times. A TMB (3’, 3 ¥, 5, 5 ¥ -Tetramethylbenzidine) Liquid chromogenic substrate solution was added to the wells and colour developed in proportion to the quantity of IL-12 and IL-18 bound. The stop solution was added against each well that changed the colour from blue to various shades of yellow. The intensity of the colour was measured at 450 nm, using plate reader and the result printed out in an electronic system.
Data analysis
The ELISA standard graphs were plotted according to the manufacturer’s instruction. The distribution of participants' characteristics and malaria parasite prevalence and frequency were statistically expressed with SPSS version 15. Also, SPSS two step cluster analysis of categorical variable with continuous variables plotted as ‘within cluster’ percentage chart at 95 % confidence interval. ANOVA excel single factor package was used to test significance differences between test and control groups.
Study duration
The study was carried out between August and November, 2014.
Results
A total of 147 (54.4% male and 45.6% female) adult patients between the ages of 18-89 (mean age 39.5) years, were recruited for the study. Only 34/147 (23.13%) patients had malaria slide positive out of those clinically suspected of having malaria infection. The minimum parasite count was 32 and maximum was 423,000 parasites/μl of blood, mean parasite count 3,181.44 ± 34,921.603 parasite/μl. Table 1, shows the frequency of clinical symptoms analogous to uncomplicated malaria in adult patients studied, 63 (42. 9 %) patients complained of two or more of these symptoms. Using non-parametric correlation, malaria parasite microscopy positivity were positively correlated with the patients that had greater than 2 of the primary symptoms using 2-tailed Spearman’s rho test at 0.05 level confidence interval P=0.240.
| Primary symptom | Frequency | Percent | Valid percent | Cumulative percent |
|---|---|---|---|---|
| Dizziness | 3 | 2 | 3 | 3 |
| Pains | 4 | 2.7 | 4 | 7.1 |
| Cold/chills | 2 | 1.4 | 2 | 9.1 |
| fever | 10 | 6.8 | 10.1 | 19.2 |
| Headache | 1 | 0.7 | 1 | 20.2 |
| Insomnia | 4 | 2.7 | 4 | 24.2 |
| Cough | 1 | 7 | 1 | 25.3 |
| Two or more of the symptoms | 63 | 42.9 | 63.6 | 88.9 |
| No record of symptoms | 11 | 7.5 | 11.1 | 100 |
| Total | 99 | 67.3 | 100 | - |
| Missing | 48 | 32.7 | - | |
| Total | 147 | 100 | - |
Table 1: Frequency of basic symptoms of patients studied.
Among the population studied no patient met the inclusion criteria for complicated malaria throughout the duration of the study. Table 2, shows the characteristics and laboratory reports of the patients studied. The mean ± Standard deviation of temperature was 36.8 ± 0.69οC and serum glucose was 99.36 ± 42.1 g/dl.
| Biodata, characteristic and test | Means (SD) Value |
|---|---|
| Age in years | 39.5 ± 14.9* |
| Male /female | 67 (45.6 %)/ 80 (54.4 %) |
| Duration of sickness in days | 3.4 ± 2.1* |
| Temperature in οC | 36.8 ± 0.69* |
| Haematocrit (PCV) in % | 38.6 ± 6.0* |
| Serum glucose in g/dl | 99.36 ± 42.1* |
| Parasite density in no of parasite/μl | 3181.44 ± 34921.603* |
*=mean value ± Standard deviation
Table 2: Biodata, characteristic and mean results of laboratory examination.
The patterns of the systolic versus diastolic blood pressures are presented on Table 3; majority 47 (47.5%) had 120/80 mmHg (systolic versus diastolic pressure) pressure and only 27 (27.3%) had normal 120/80 mmHg blood pressure. According to the manufacturer, the standard concentrations of 7.5, 15, 30, 60 and 90 ng/L and 6, 12, 24,48, and 72 ng/L were provided for IL-18 and IL-12 respectively. From the analysis, a report of mean serum concentrations of 30.2 ± 56.7ng/L, 28.7 ± 19.6 ng/L and 24.2 ± 13.3 ng/L were recorded on IL-12 for test, controls A and B respectively. For IL-18, 30.9 ± 36.5 ng/L, 27.9 ± 16 ng/L and 36.1 ± 5.1ng/L were equally recorded for test, controls A and B respectively in Table 4.
| Category | Range mm/Hg | Frequency (%) |
|---|---|---|
| Normal | SB 90-119 and DBP 60- 79 | 43 (29.3) |
| Prehypertension | SBP 120 139 or DBP 80-89 | 26 (17.7) |
| Stage 1 HTN | SBP 140 - 159 or DBP 90 - 99 | 5 (3.4) |
| Stage 2 HTN | SBP > 160 or DBP>100 | 3 (2.0) |
| Hypotension | SBP < 80 or DBP<60 | 1 (0.7) |
| Missing | - | 69 (46.9) |
Key: DBP=Diastolic Blood Pressure; SBP=Systolic Blood Pressure; HTN=Hypertension
Table 3: Systolic versus diastolic blood pressure in mmHg of patients studied n=147.
| Cytokine | Mean Standard Deviation (SD ng/L | ||
|---|---|---|---|
| Test sample | Control group A | Control group B | |
| IL- 12 | 30.2 ± 56.7 | 28.7 ± 19.6 | 24.2 ± 13.3 |
| IL-18 | 30.9 ± 36.5 | 27.9 ± 16.0 | 36.1 ± 5.1 |
| Mean Ratio (IL-12/IL-18) at 95 % confidence interval | 0.886 | 0.955 | 0.916 |
| Ratio lower bound and upper bound | 0.807 - 0.964 (0.225) | 0.775 - 1.135 (0.482) | 0.755- 1.077 (0.399) |
| (± SD) | |||
| Coefficient of dispersion | 0.175 | 0.299 | 0.254 |
| Coefficient of variation median centered (%) | 26.5 | 62.5 | 51.6 |
Table 4: Statistics of mean Standard deviation and ratio of IL-12 and 18 cytokines studied.
Also, mean serum cytokine ratio IL-12/IL18 of 0.886, 0.955 and 0.916 ng/L were reported for uncomplicated adult malaria patients (T), febrile malaria negative patients control (CA) and apparently healthy subjects C B respectively and the lower and upper ranges were as recorded in Table 4 below. Figures 1-2 showed the graph and scatter graph, with best line of fit of cytokines’ (IL-12 and IL- 18) studied for test, C A and CB respectively.
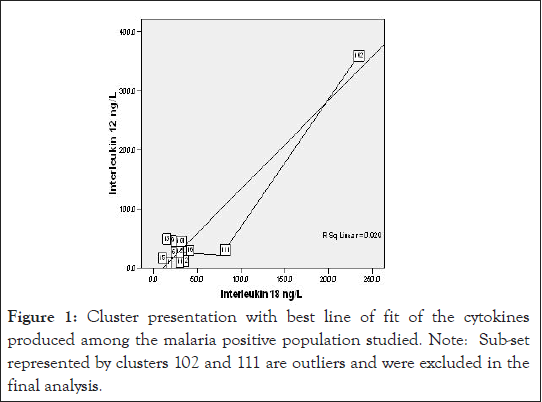
Figure 1:Cluster presentation with best line of fit of the cytokines produced among the malaria positive population studied. Note: Sub-set represented by clusters 102 and 111 are outliers and were excluded in the final analysis.
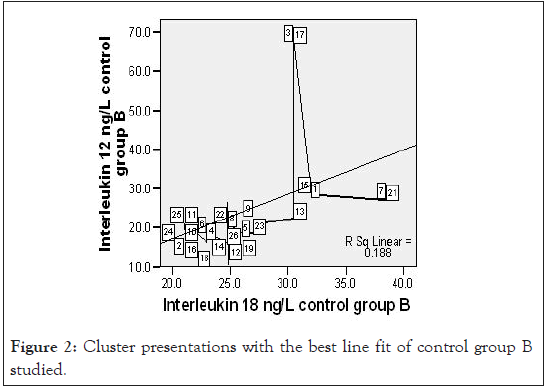
Figure 2:Cluster presentations with the best line fit of control group B studied.
General statistical analysis of the data showed no statistical significant differences between mean serum concentrations of the two cytokines measured among T, CA and CB. The probability (P=0.05) values obtained are as follows: IL-12 T versus (vs.) IL-12 CA, P=0.899, IL-12T vs. IL-12 CB P=0.600 and for cytokine IL- 18T vs. IL-18 CA, P=0.674; IL-18 T vs. IL-18 CB, P=0.509. Also, there was no significant statistical difference between the cytokine production among the two control groups: IL -12 CA vs. IL- 12CB, P=0.7696 and IL-18 CA vs. IL-18 CB, P=0.599. However, with the exclusion of the outliner cluster, IL-12 production was statistically significantly lower in uncomplicated malaria positive test group than the control groups see Figures 3 and 4 below, the likely hood –Log10 probability stepwise test.
Figures 3 and 4 show two step cluster wise data analysis of cytokine production for T, CA and CB for the IL-12 and IL-18 cytokines respective at 95 % confidence intervals. It is apparent that IL-12 had lower (20.5 ng/L) production compared to the CA (39.1 ng/L) and CB (24.2 ng/ L), the overall mean was 28.0 ng/L. Interleukin 18 production in uncomplicated malarial adult patients had lower (24.9 ng/L) production compared with the controls A and B that had 34.4 ng/L and 28.2 ng/L respectively, overall mean 28.5 ng/L.
Applying a test of Log likely hood with standardized means, a measure of differences at 95% confidence interval level, the – Log10 probability measure was statistically significant indicating that IL-12 in uncomplicated adult malaria was different from the controls (Figure 3). Figure 4, demonstrates ‘a no difference’ in IL-18 production for both the test and the control groups. Table 5, demonstrates the biodata, main symptoms and parasite load characteristics of the outliers cluster with distinct and unique cytokine production; aimed to decipher the confounding factors to their immunological status. Figure 5 below then demonstrated possible immunomodulatory complexities on different clinical conditions.
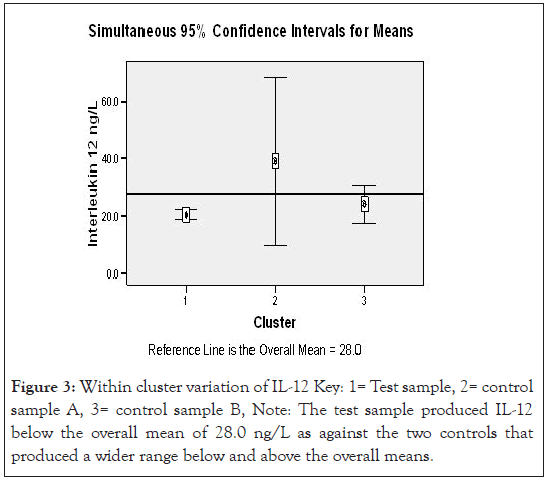
Figure 3:Within cluster variation of IL-12 Key: 1= Test sample, 2= control sample A, 3= control sample B, Note: The test sample produced IL-12 below the overall mean of 28.0 ng/L as against the two controls that produced a wider range below and above the overall means.
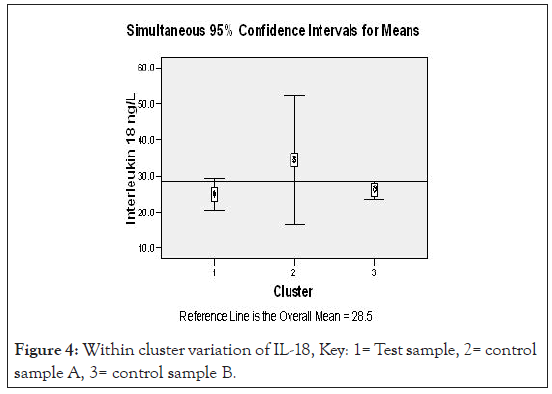
Figure 4:Within cluster variation of IL-18, Key: 1= Test sample, 2= control sample A, 3= control sample B.
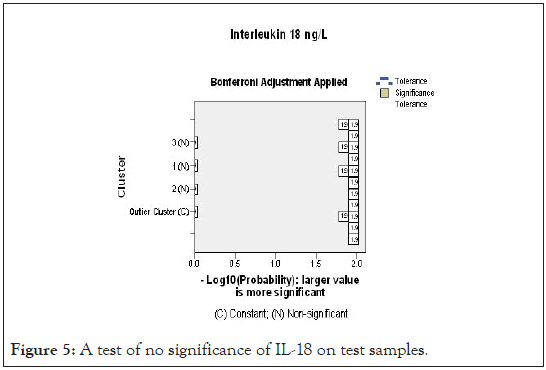
Figure 5:A test of no significance of IL-18 on test samples.
Discussion
In this study, out of 147 adult patients clinically diagnosed of plasmodiasis, only 34 (23.1 %) were confirmed by microcopy. The same outcome have been earlier expressed by researchers: Msellem et al., [20] reported that majority (85%) of clinical diagnosis were without slide positivity, Kurup and Marks [15] reported 190 (30.5%) malaria slide positivity out of 624 clinically diagnosed patients studied and Ojurongbe et al., [21], though in children, reported in a 3 methods (RDT, Microscopy and PCR) composite comparative test that 71 (32.7 %) out of 217 febrile patients clinically diagnosed of malaria, actually had malaria parasite. In contrast, Igbeneghu et al., [22] reported a higher occurrence of 161/ 258 (62.4 %) in adult patients in Ibadan, Southwest Nigeria. Age and the time of these studies may be factors of variability; since a reduction in the burden of malaria from 13.3 % in 2003 to 7.3% in 2011 has been reported [23]. Also, accuracy of clinical diagnosis varies with the level of endemicity, malaria season and expertise [21]. These reports discourage syndromic management of malaria. The economic waste is enormous. The challenge here is that there is no single generally accepted clinical algorithm for malaria diagnosis. According to WHO declaration, febrile patients with parasitaemia may have other concomitant causes of fever, which also may require appropriate diagnosis and treatment. It is therefore difficult to determine whether malaria parasitaemia is the primary cause of illness or incidental to another disease [21]. Clinical diagnosis therefore cannot be relied upon in uncomplicated adult malaria in an endemic area as seen in this study. These reports underscore the need for proper diagnosis of diseases since septicemia, gastroenteritis and some viral diseases have similar clinical presentations with malaria [24].
It has been severally referenced that malaria causes symptoms that typically include fever, fatigue, vomiting, headache, abdominal pain, chills, muscle aches; poor appetite and sweats [14,25]. Majority (42.9%) of the patients had only two or more of these symptoms (Table 1) and, they are mostly female (Figure 6). Only 6.8% of those with slide microscopy positive had fever, therefore, absence of fever can no longer connote absence of malaria disease. Diarrhoea, nausea, and vomiting symptoms only appear sometimes [25]. Our observation that blood pressure may contribute to altered cytokine release (Figure 7), and may equally affects the severity of disease is supported by the report of Bartoloni and Zammarchi [26], who reported that certain malaria patients with low blood pressure experience certain complication like dizziness or orthostatic hypotension. In this report, majority (46.9%) had no record of blood pressure measure, many (29.3%) had normal blood pressure and the remainders are at various categories abnormal blood pressure development (Table 3). Meanwhile, blood pressure is not one of the recommended clinical staging in malaria disease [14]. It should be recommended for in all adult malaria conditions since in this report, there is apparent indication that patients with abnormal blood pressure had altered clinical prognosis (Table 5). Poor symptom manifestation in this report is further supported by the study of Farrington and others [27], who reported that repeated malaria parasite exposure produces clinical immunity to malaria which protects against symptoms, but not against infection.
Figure 6:Legend of gender distribution of the symptoms among the study population.The patterns of the systolic versus diastolic blood pressures are presented on Table 3; majority 47 (47.5%) had ‹ 120/80 mmHg (systolic versus diastolic pressure) pressure and only 27 (27.3%) had normal 120/80 mmHg blood pressure.
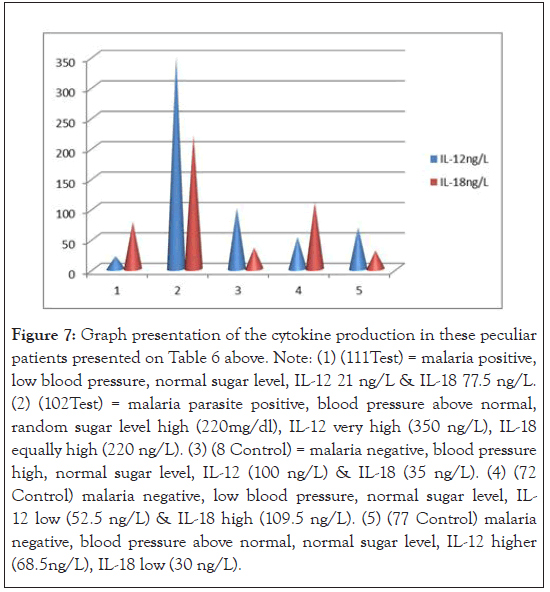
Figure 7:Graph presentation of the cytokine production in these peculiar patients presented on Table 6 above. Note: (1) (111Test) = malaria positive, low blood pressure, normal sugar level, IL-12 21 ng/L & IL-18 77.5 ng/L. (2) (102Test) = malaria parasite positive, blood pressure above normal, random sugar level high (220mg/dl), IL-12 very high (350 ng/L), IL-18 equally high (220 ng/L). (3) (8 Control) = malaria negative, blood pressure high, normal sugar level, IL-12 (100 ng/L) & IL-18 (35 ng/L). (4) (72 Control) malaria negative, low blood pressure, normal sugar level, IL- 12 low (52.5 ng/L) & IL-18 high (109.5 ng/L). (5) (77 Control) malaria negative, blood pressure above normal, normal sugar level, IL-12 higher (68.5ng/L), IL-18 low (30 ng/L).
Referencing WHO on basic criteria for uncomplicated malaria diagnosis [body temperature of 37.5οC, serum glucose level >50 mg/dl, haemoglobin >8 but <11 g/dl or haematocrit <33% compared with this report; the mean temperature was 36.8οC ± 0.69, mean blood glucose 99.36 ± 42.1 mg/dl and haematocrit of 38.6 ± 6.0% (Table 2). Some of these criteria were also reported by Wroczynska et al., [9]: mean temperature 37.9 ± 1.11οC, glucose level 97.5 ± 18.62 mg/dl and haemoglobin of 11.55 ± 1.76 g/dl. Wroczynska’s study was equally on uncomplicated adult malaria, the mean age range (39.6 ± 11.50 years) for their study was comparable with this study mean age of 39.5 ± 14.9 years. However, their study was in a malarial non-endemic area, therefore, the study population was immunologically naïve hence they reported higher febrile symptom [14,9].
This study reports mean duration of sickness of 3.4 ± 2.1 days (Table 2), against other reports for instance, Bartoloni and Zammarchi [26] reported 8-25 days of commencement following infection with a flue like symptoms. This may imply that the population studied was mostly at their earlier stages of infection, although malaria disease in holoendemic regions are mostly reported to be subclinical and that tolerance/poor manifestation of symptoms is dependent on transmission intensity [28]. Nonetheless, WHO has recommended that parasite-based diagnosis and effective treatment should be available to all people at risk for malaria, irrespective of their age and the intensity of transmission in the area [29,30].
It has been reported that type 1 cytokines are important in controlling early parasitaemia [31], and IL-12 and IL-18 are type 1 cytokines – they are pro-inflammatory in nature. It has also, been suggested that a marked imbalance in cytokines found in serum might be used as a maker of progression to a fatal outcome [11]. In this study, the absolute concentration of cytokines were higher in test group (30.2 ± 56.7 ng/L, 30.9 ± 36.5 ng/L); compared with control A (28.7 ± 19.6 ng/L, 27.9 ± 16 g/L) and control B (24.2 ± 13.3 ng/L, 36.1 ± 5.1 ng/L) for IL-12 and IL-18 respectively (Table 4). Since IL-18 of control B was higher than the test and control A. Thus, taking cognizance of the large standard deviation of the IL-12 concentration and the statistical tests applied (Figures 1-5,8 and 9), the differences in cytokine production among the test and controls were not statistically significant at 95% confidence limit thus: IL-12: T versus (vs.) CA, P=0.899; IL-12:T vs. CB, P=0.600 and for IL-18: T vs. CA, P=0.674; IL-18: T vs. CB, P=0.509 (Table 4). This report is not in agreement with the report of Wroczynska et al., [9] who reported a significant difference in cytokine production in adult uncomplicated malaria patients. However, the study was in a malaria non-endemic region and the patients were malarial immunologically naïve. Interleukin -12 is a pro-inflammatory cytokine that induces inflammation which increases with severity of the disease [1]. The low level of parasite load among the study population coupled with low duration of illness and low body temperature smacks non-severity of the cases, since no patient was excluded on the bases of symptoms of severe malaria. The latter aligns with the position of WHO, that “complicated adult malaria is rare in malaria high endemic regions” [5]. Although the mean serum concentration differences of cytokines studied are not statistically significant, it has been reported that higher absolute levels and ratios of pro-inflammatory and anti-inflammatory cytokines influences susceptibility to infection, clinical disease and anaemia [32].
From this study report concomitant infection provided no clear discrepancies between the level of mean cytokine production ratio in both malaria positive persons and those with other types of febrile conditions (CB) and apparently healthy control group (CA), thus, 0.886ng/L (lowest), 0.955 ng/L (highest) and 0.916ng/L (higher than malaria positive test group) respectively (Table 4). The mean serum level ratios are different but not discriminatory and therefore cannot be employed as diagnostic tool. This is so because the lower and upper limits of the ratios encroached onto one another (0.807-0.964 ± 0.225, 775- 1.135 ± 0.482 and 0.755-1.077 ± 0.399 for T, CA and CB respectively). The possible contributory factor may be that febrile control patients without malaria may have had recent malaria treatment under self-medication and only appeared in the hospital when disease persisted.
Since vulnerability to malaria disease is associated with the immune status of the individual and other underlying factors, a strict statistical analysis of the result of this study with the exclusion of the outliers demonstrated in Figure 3, IL-12 production among the test in Figure 1 counterbalanced with higher IL-18, compared with CA (Figure 8). Control group B presented a different scenario of higher IL-12 and IL-18 production (Figure 2). The probable implication of this is that there could be other parasitic infections associated with higher pro-inflammatory cytokine production in the study region.
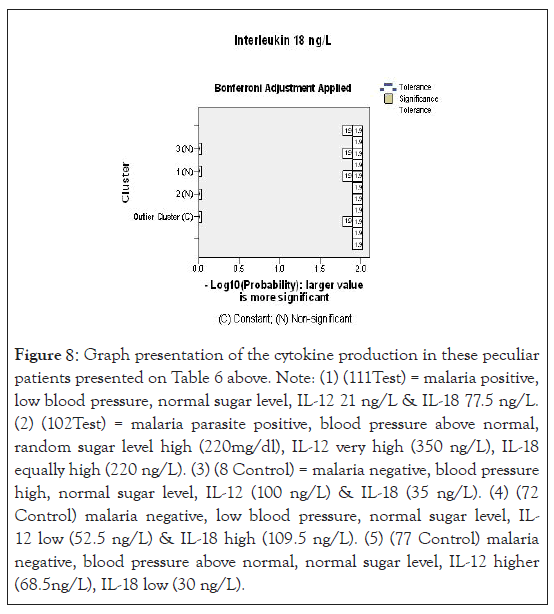
Figure 8:Graph presentation of the cytokine production in these peculiar patients presented on Table 6 above. Note: (1) (111Test) = malaria positive, low blood pressure, normal sugar level, IL-12 21 ng/L & IL-18 77.5 ng/L. (2) (102Test) = malaria parasite positive, blood pressure above normal, random sugar level high (220mg/dl), IL-12 very high (350 ng/L), IL-18 equally high (220 ng/L). (3) (8 Control) = malaria negative, blood pressure high, normal sugar level, IL-12 (100 ng/L) & IL-18 (35 ng/L). (4) (72 Control) malaria negative, low blood pressure, normal sugar level, IL- 12 low (52.5 ng/L) & IL-18 high (109.5 ng/L). (5) (77 Control) malaria negative, blood pressure above normal, normal sugar level, IL-12 higher (68.5ng/L), IL-18 low (30 ng/L).
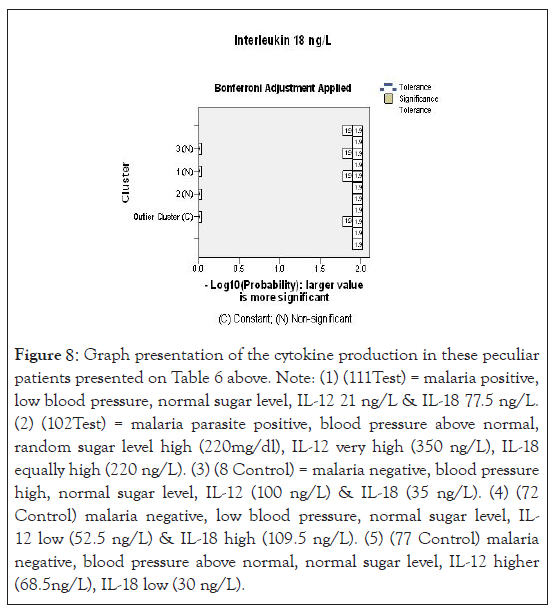
Figure 9:A test of statistical significance using likely hood - log 10 probability of IL-1. Note: The low production of cytokines (IL-12) was significantly associated with malaria parasite infection, using cluster wise analysis of likelihood –log10 probability analysis at 95% confidence intervals.
It is possible to say that from this study, different clinical status failed to present distinguishable IL-12 and IL-18 cytokines immunological production.
However, when cytokine production was subjected to a statistical test (using SPSS cluster wise analysis of –Log10 probability (Figures 5 and 9), only low level production of IL-12 was significantly associated with malaria disease. From the animal model test report by Angulo and Fresno, [11], IL-12 was demonstrated to play early response role against Plasmodium infection. It was found to make mice resistant or susceptible and may play a role in pathology itself [33]. Further report had it that IL-12 production is regulated by IFN-ϒ level. In early infection, production of IFN-ϒ allows an early and sustained Th1 response for production of IL-12. In other words, resistance to infection was reported to be dependent on IFN-ϒ level of production. In an experiment, IFN-ϒ in vivo blocking provoked progression of parasitaemia and subsequent death of the mice in animal model test [11]. Therefore, low statistical level of IL-12 production reported portend danger of likely parasite proliferation and subsequent disease progression by adult uncomplicated malaria patients from high transmission region studied. On the other hand, it could mean that the population studied had high level of resistance to plasmodia inversion, hence low IL-12 production and low parasite density [11]. This is possibly prognostic in nature.
Also, IL-12 has been shown to be required for production of a protective immunoglobulin G2a (IgG2a) antibody and therefore, is immune-regulatory in nature and extends to the antibody responses against Plasmodia infection [11]. Again, high level production of IL-12 has been associated with pathogeneses of Cerebral Malaria (CM) [11].
On the other consideration, IL-18 was equally reported as to enhance Th1 immune responses in a way that it depends on IL-12; but it can also; potentiate Th2 immune responses when IL-12 is low or not available according to Angulo et al., [11]. Interleukin 18 has been demonstrated to play a protective role since administration of neutralizing IL-18 antibody exacerbated infection in wild type mice [11]. These cascades of events are not yet very clear, but malaria parasite infection has a large influence on the delicate balance between inductions of pro and antiinflammatory cytokines counterbalanced in time and intensity to determine the nature of the activity (protection or pathogenic) to elicit [32,33].
A close observation of the scatter graph of the control group B IL-18 and IL-12 on Figures 2 showed a good number of outliers among CB and this underscore the role of other health conditions on cytokine production that are yet to be properly understood. However, under ample statistical analysis, we were able to associate IL-12 production to early malaria parasite infection – low, for mean duration of sickness of 3.4 ± 2.1 days. This agrees with early parasitic protection theory [9,11].
The association between parasitaemia, anaemia and cytokine production could not be measured since anaemic case was not encountered. However, low parasitaemia has been associated with low level of IL-12 and reduced anaemia [11]. In Table 5 and Figure 7, attempt was made to associate the outliers’ clusters among the population studied with cytokine production and compared the possible confounding factors contributory to high cytokine production. For instance, the second (2) scenario patient had <120/80 mmHg blood pressure, hyperglycemia 220g/dl, IL- 12 of 350 ng/L (high); IL-18 of 220 ng/L(high) and a parasite load of 80 parasite/µL; thereby demonstrating low immunity as confounding factor in high cytokine production. Random scientific reasoning in this report will suggest that there are more to cytokine production than malaria Plasmodia and information about these confounding factors are sparse and needed to be filled. Thus, this study disagree with the view of Agulo et al., [11] that “specific clinical conditions might have distinguishable cytokine immunological features”.
| Biodata, symptoms and parasite load | ||||||||||
|---|---|---|---|---|---|---|---|---|---|---|
| Patient's No | Age in years | Sex | Temp. ºC | BP in mm/Hg | PCV % | Serum glucose in g/dl | Duration of sickness in days | IL-12ng/L | IL-18ng/L | Parasite load/L |
| 111T | 18 | F | 37 | >120/80 | 34 | 76 | 2 | 21 | 77.52 | 112 |
| 102T | 33 | F | 37 | <120/80 | 40 | 220 | 4 | 350 | 220 | 80 |
| 8C | 30 | M | 36.2 | <120/80 | 40 | 94 | 6 | 100 | 35 | 0 |
| 72C | 25 | M | 37 | > 120/80 | 42 | 91 | 2 | 52.5 | 109.5 | 0 |
| 77C | 56 | F | 37 | < 120/80 | 38 | 83 | 4 | 68.5 | 30 | 0 |
Table 5: Biodata, main symptoms and parasite load characteristics of the outliner patient’s cluster in cytokines production, Biodata, Symptoms and parasite load.
Conclusion
Since the delicate balance between induction of pro and antiinflammatory cytokines, counterbalanced in time and intensity determines the nature of “protection or pathogenic” effect elicited; there are two possible conclusions to be derived from the present study (1) the absolute higher IL-12 production with mid-higher IL-18 counterbalanced level portends pathogenic and progressive infection (prognostic) or (2) with the statistical exclusion of the outliers, the lower IL-12 with higher IL-18 production, portends resistance to infection (protective). Although, this study recorded lower mean ratio of 0.886 ng/L comparatively, for uncomplicated malaria patients, yet it is not diagnostic since the upper and lower limits of both test and controls infringed and therefore not discriminatory.
Ethical Issues
Informed consent
Written informed consent of each patient was obtained. Few of the patients decline participation. Some patients were assisted with antimalarial drug free of charge on prescription.
Conflict of Interest
No conflict of interest declared
Funding
The project was a self-funded professional Fellowship programme.
Authors' contributions
CAE and AAA conceived the idea of the study; MA, NVE and CAE did sampling and completion of the CRF. CAE, SAE and SN performed the microscopy. CAE, TA and AAA did the ELISA, FUE and MA did other laboratory procedures. CAE, NVE and TW performed the data analysis. CAE and AAA wrote and reviewed the manuscript respectively.
Acknowledgement
It is good to appreciate NIMR management for granting the permission to do the study, we appreciate the CMD and in deed all the nurses and clinicians of Randle general hospital for granting the permission to do sampling and assisting my team on the study respectively. I appreciate the entire staff of School of Medical Laboratory Science, Lagos University Teaching Hospital Idiaraba-Lagos for their commitment to quality studies.
REFERENCES
- Malaguarnera L, Pignatelli S, Musumeci M, Simporè J, Musumeci S. Plasma levels of interleukin-18 and interleukin-12 in Plasmodium falciparum malaria. Parasite Immunol. 2002;24(9):489-492.
- World Health organization (WHO). World malaria report 2020.
- World Health Organization (WHO). World malaria report update. 2019.
- Patel H, Dunican C, Cunnington AJ. Predictors of outcome in childhood Plasmodium falciparum malaria. Virulence. 2020;11(1):199-221.
- World Health Organization (WHO). New perspectives: malaria diagnosis. Geneva: World Health Organization. 2000.
- Struck NS, Zimmermann M, Krumkamp R, Lorenz E, Jacobs T, Rieger T, et al. Cytokine Profile Distinguishes Children With Plasmodium falciparum Malaria From Those With Bacterial Blood Stream Infections. JID. 2020;221(7):1098-1106.
- Salimonu LS. Basic immunology for students of medicine and biology. 2003.
- Cytokine Encyclopaedia Britannica. 2012.
- Wroczyńska A, Nahorski W, Bakowska A, Pietkiewicz H. Cytokines and clinical manifestations of malaria in adults with severe and uncomplicated disease. Int Marit Health. 2005;56(4):1-4.
- Iriemenam NC, Okafor CMF, Balogun HA, Ayede I, Omosun Y, Persson JO, et al. Cytokine profiles and antibody responses to Plasmodium falciparum malaria infection in individuals living in Ibadan, southwest Nigeria. Afr Health Sci. 2009;9(2):66-74.
- Angulo I, Fresno M. Cytokines in the pathogenesis of and protection against malaria. Clin Diagn Lab Immunol. 2020;9(6):1145-1152.
- Kelsey JL, Whittemore AS, Evans AS, Thompson WD. Methods in Observational Epidemiology. Oxford University Press, 1996.
- Autino B, Noris A, Russo R, Castelli F. Epidemiology of Malaria in Endemic Areas. J Hematol Infect Dis. 2012;4(1): e2012060.
- World Health Organisation. Basic laboratory methods in medical parasitology, WHO publications. 1991.
- Kurup R. A comparison of microscopic examination and rapid diagnostic tests used in Guyana to diagnose malaria. Mal Reports. 2012;2(1):e2.
- World Health Organisation. Basic malaria microscopy. Lagos state Ministry of Health. 2009.
- World Health Organisation. Severe and complicated malaria. 1990.
- Baker FJ, Silverton RE, Pallister CJ. Introduction to medical laboratory technology 6th ed. Sevenoaks: Butterworths, 1985.
- World Health Organisation. Severe and complicated malaria. 1990.
- Msellem ML, Martensson A, Rotllant G, Bhattarai A, Strömberg J, Kahigwa, E, et al. Influence of rapid malaria diagnostic tests on treatment and health outcome in fever patients, Zanzibar: a crossover validation study. PLoS Med. 2009;6(4):e1000070.
- Ojurongbe O, Adegbosin OO, Taiwo SS, Alli OAT, Olowe OA, Ojurongbe TA, et al. Assessment of Clinical Diagnosis, Microscopy, Rapid Diagnostic Tests, and Polymerase Chain Reaction in the Diagnosis of Plasmodium falciparum in Nigeria. Malar Res Treat. 2014;11(1):308069.
- Igbeneghu C, Olisekodiaka MJ, Onuegbu JA. Malaria and typhoid fever among adult patients presenting with fever in Ibadan, Southwest, Nigeria. Inter. J Trop Med. 2009;4(3):112-115.
- Salihu OM, Sanni NA. Malaria burden and the effectiveness of malaria control measures in nigeria: A case study of asa local government area of kwara state. J Econ Sust. 2013;4(3).
- Nadjm B, Behrens RH. Malaria: an update for physicians. Infect Dis Clin North Am. 2012;26(2):243-259.
- Beare NA, Taylor TE, Harding SP, Lewallen S, Molyneux ME. Malarial retinopathy: A newly established diagnostic sign in severe malaria. Am J Trop Med Hyg. 2006;75(5):790-797.
- Bartoloni A, Zammarchi L. Clinical aspects of uncomplicated and severe malaria. Mediterr J Hematol Infect Dis. 2012;4(1): e2012026.
- Farrington L, Vance H, Rek J, Prahl M, Jagannathan P, Katureebe A, et al. Both inflammatory and regulatory cytokine responses to malaria are blunted with increasing age in highly exposed children. 2017;16(1):499.
- World Health Organization (WHO). World Malaria Report. 2011.
- Temitope W Ademolue TW, Aniweh Y, Kusi KA, Awandare GA. Patterns of inflammatory responses and parasite tolerance vary with malaria transmission intensity. Malar J. 2017;16(1):145.
- Tangpukdee N, Duangdee C,Wilairatana P, Krudsood S. Malaria diagnosis: A brief review. Korean J Parasitol. 2009;47(2):93-102.
- Jelkmann W. Proinflammatory Cytokines Lowering Erythropoietin Production. J Interferon Cytokine Res 2009;18(8):555-559.
- Dodoo D, Omer FM, Todd J, Akanmori BD, Koram KA, Riley EM. Absolute levels and ratios of proinflammatory and anti-inflammatory cytokine production in vitro predict clinical immunity to Plasmodium falciparum malaria. J Infect Dis. 2002;185(7):971-979.
- Janeway CA,. The Immune System in Health and Disease. In: Immunobiology. Janeway CA, Travers P, Walport M, Shlomchik MJ. 5th(Edn), Ncbi publisher, New York, USA, 2001; Pp1:5.
Citation: Enwurua CA, Awoderua T, Enwurub NV, Nduagaa S, Ezeamaramua FU, Akindelea S, et al. (2021) Specific Cytokine Assay for the Diagnosis and Prognosis of Malaria in Adult Patients in A Holoendemic Lagos, Nigeria. Trop Med Surg. 9: 234.
Copyright: © 2021 Enwurua CA, et al. This is an open-access article distributed under the terms of the Creative Commons Attribution License, which permits unrestricted use, distribution, and reproduction in any medium, provided the original author and source are credited.
