Indexed In
- SafetyLit
- RefSeek
- Hamdard University
- EBSCO A-Z
- OCLC- WorldCat
- Publons
Useful Links
Share This Page
Journal Flyer
Open Access Journals
- Agri and Aquaculture
- Biochemistry
- Bioinformatics & Systems Biology
- Business & Management
- Chemistry
- Clinical Sciences
- Engineering
- Food & Nutrition
- General Science
- Genetics & Molecular Biology
- Immunology & Microbiology
- Medical Sciences
- Neuroscience & Psychology
- Nursing & Health Care
- Pharmaceutical Sciences
Research Article - (2021) Volume 24, Issue 9
Sea-level Rise and Coastal Vulnerability: A Preliminary Assessment of UAE Coast through Remote Sensing and GIS
P. Subraelu1*, M.M. Yagoub2, Ahmed Sefelnasr1, Kakani Nageswara Rao3, Raj Sekhar A4, Mohsen Sherif1 and Abdel Azim Ebraheem12Department of Geography, College of Humanities and Social Sciences, UAEU, P.O.Box: 15551, Al Ain, UAE
3Department of Geo-Engineering, Andhra University, Visakhapatnam, A.P.,Box:530003, India
4Gayatri Vidya Parishad College of Engineering (Autonomous), Madhuruwada, Visakhapatnam, A.P.,Box: 530048, India
Received: 26-Oct-2021 Published: 16-Nov-2021
Abstract
The eustatic sea-level rise due to global warming is predicted to be about 42 cm to 98 cm by 2100. Global measurements specify that the rise in sea-level is persistent or close to the worst case scenarios. In this regard, Coastal areas around the world will bore the brunt, because of inundation and flooding as storm surges are predicted to increase in frequency and severity, coupled to the inundation due to higher sea levels. It is necessary at this juncture, to identify local and regional level coastal vulnerability, using advanced geo spatial technologies and protect the vulnerable sections of UAE coasts. The UAE coast, which includes tourist resorts, ports, hotels, residential complexes, and mega construction projects, will have threat from the impending eustatic sea-level rise. Evaluation of vulnerability level of UAE coast as an illustration, is corroborated in this study using six physical variables, namely geomorphology of the coast, coastal slope, coastal land use/land cover (LU/LC), shoreline change, mean spring tide, and significant wave height. A coastal vulnerability index was meticulously studied by integrating the weighted rank values of the six variables, based on which the shoreline is divided into very high-risk, high, moderate, and low categories. About 13.8% of the studied 500 km-long UAE coast is under very high-risk, followed by another 19.4% under high risk, and 47.5% under moderate risk category, finally 19.3% under low risk category. These results contributes in assisting the planners and authorities to mitigate the disasters, adapt and design optimal coastal structures in these susceptible sections of the coast from the impending eustatic sea-level rise and storm surges.
Keywords
Sea-level rise; Coastal vulnerability index; Coastal risk assessment; UAE Coast; Geo-spatial technology; GIS; Remote sensing
Introduction
The most conventional concerns of global warming induced climate change is that global sea levels will continue to rise. The most recognized impact of global warming is the eustatic sea level rise [1]. The contrivance for this is well fathomed: as ocean waters heat up, thermal expansion of the water body occurs, while ice melt water from land based ice caps and glaciers also contributes more water resulting in a rise in global sea levels [2]. The eustatic sea-level rise due to global warming is predicted to be about 42 to 98 cm by the 2100 [3], which demands identification and protection of vulnerable sections of the coasts in the world. The most apparent effect of a sea levels rise is the gentle engulfing of shorelines [4]; but this is not the only concern. Heightened coastal erosion [5,6], as well as elevated storm surges and higher extreme tides, waves and amplified wave run-up, inundation of wetlands and estuaries [7] coastal flooding [8,9], decreases the efficacy of coastal structures [10-12] and subsidence [13] are all the consequences of increasing sea levels. The same factors similarly increases the flood and intensity of the damage [14,15]. It has also been anticipated that the frequency of extreme wave events will rapidly increase many folds. what is now a once in a hundred year event is, by 2099, likely to occur two or three times a year.
Anthropogenic activities of modern era such as deforestation, fossil fuel burning, draining of wetlands, adoption of modern technology in farming and livestock rearing, etc., are the main reasons for the present degraded state of the global environment [16]. The increasing urbanization and industrialization, the impacts began to appear on the world climate and reached such a level at present that it is no more a tomorrow’s crisis but very much a today’s growing cataclysm [17]. At present (Sep 2021), the atmospheric carbon dioxide levels are at 413.30 ppm (http://co2now.org) an increase of about 150 ppm from its pre- industrial levels of 260-270 ppm [18]. The ramifications of increased greenhouse gases like carbon dioxide in atmosphere are already visible.
The top 11 warmest years in the recorded history have occurred in the last 15 years [19]. Arctic and Antarctic ice sheet are receding in a fast pace and if this tendency continues further the polar bear population would decline by two-thirds by the midcentury [20]. There are clear indications of large scale ice melt in the large Greenland ice repository which is at a rate of 239 ± 23 km3 per year [21]. Also extent of Arctic ice is decreasing at approximately 8% per decade since the middle of last century [22]. The most frightening is the widespread loss of ice in west Antarctica [23] contributing to global sea level rise of ~0.36 mm/ year [24].
Other relevant significant studies predict that even 1.0 m to 1.5 m rise in sea levels will be experienced by the end of this century [25,26]. In worst case scenarios, a sea level rise of between 61 cm and 1.1 m is now likely by 2100, 10 cm higher than the IPCC’s last big assessment just eight years ago, due to better understanding of how the Antarctica ice sheet is melting. The rise could be substantially higher, if Antarctica ice disappears faster, the echoing recent research suggesting a rise of as much as 2 m by 2100 AD [27]. The coastal zones, which are the interface between the continents and oceans, constitute a mere 5% of the total landmass, but they sustain approximately one-third of the world’s population [28]. The huge population attraction towards the coastal zones is mainly due to the availability of rich natural resources such as marine resources and moderate climate, in addition to conducive for marine trade and transportation, industrial and cultural activity [29]. Human activities at the global scale, such as increased carbon dioxide levels and deforestation leads to global warming, which in turn causes large-scale ice melt, thereby contributing to eustatic sea level rise.
Keeping in view of the above discussions, the rising sea levels portends several tiny island nations, such as Maldives, Lanai and Kiribati etc., which are barely 2 m above sea level [30]. High concentration of people in low-lying regions of many countries especially in highly populated coastal deltas mainly in Bangladesh, China [25] and Vietnam face the danger of being displaced. Subsequently, identifying the vulnerability of different coastal sectors to the impact of rising sea levels is an important aspect of coastal zone management. Drastic assessments is needed to analyze the degree of vulnerability experienced by a coast [31] since measuring vulnerability is a key step towards effective risk reduction [32]. High quality research have been made to measure coastal vulnerability and determine risk intensities to sea-level rise taking various physical parameters such as coastal geomorphology, relief, relative sea level changes, history of shoreline morphodynamics, tide and wave regimes, and land use/land cover etc.
Thieler and Hammer-Kolse [33] used CVI which is based on the research of Gornitz et al. [34] to evaluate the vulnerability of the Atlantic, Pacific, and Gulf of Mexico coasts of the United States to sea level rise. The six physical variables used in their study are geomorphology, historical shoreline erosion or deposition, rate of relative sea level change, coastal slope, mean tidal range, and mean wave height, as the final product highlighting the coastal sections where the impacts of sea level rise are anticipated to be most severe. Pendleton et al. [35] developed a CVI to estimate the vulnerability of the coast in the Northern California to sea level rise used the same variables [33]. Many other similar CVI attempts have been made by Diez et al. [36] of the Buenos Aries coast and Doukakis [37] pertaining to Greece coast by taking the physical variables such as geomorphology, relief, geology, relative sea level changes, shoreline change history, tide and wave. A CVI was also developed by Aysan Koruglu [7] on the Barcelona coast, Spain, Daniel Pantusa [38] studied along the Apulian coastline, Italy, Sasi Mary et al. [39] worked on the Tamil Nadu coast, India, and Faour Ghaled et al. [40] on the Syrian coast, all these studies used the same variables such as geomorphology, relative sea level changes, shoreline change rate, coastal slope, tides and waves. But Akshay and Arkal [41] worked on Karnataka coast in India, included elevation and population into their study apart from the above mentioned parameters [42]. Studied Pichavaram a section of Tamil Nadu coast, India, considered land use/ land cover and bathymetry apart from the above parameters into their study.
In recent years, an important infrastructural and human development focus for United Arab Emirates has been predominantly along the shorelines. It is imperative and quite obvious that impacts of future sea level changes must be taken into consideration. In general, the UAE coastal regions is not well researched with respect to impacts of eustatic SLR and its vulnerability, although, demonstrated that in the Middle East and North Africa, the UAE would be one of the most impacted countries for SLR [43-46]. Restricting sea level impact analysis and to plotting the slow creeping of rising sea levels up the shore over several decades is naïve and overlooks other significant changes in flood risks that accompany rising sea levels. The main aim of this paper is to quantitatively assess the degree of vulnerability of various coastal sections pertaining to all the Emirates of UAE along the Arabian Gulf and Gulf of Oman coast to the impending sea level rise.
Study area
The United Arab Emirates (UAE) abuts the southern Arabian Gulf bordering Oman to the east and Saudi Arabia to the south and west as well as sharing maritime borders with Iran to the north and Qatar to the west. The gulf itself is a large, warm, shallow semi-enclosed body of water with multifarious oceanography and geomorphological history [44]. The UAE is a federation of seven emirates consisting of Abu Dhabi (Capital), Dubai, Sharjah, Ajman, Umm Al Quwain (UAQ), Ras Al Khaiman (RAK), and Fujairah. The UAE is in-between 22° 30’ and 26° 10’ north latitude and 51° and 56° 25’ east longitude. The UAE coast stretches for more than 1000 km along the southern shore of the Arabian Gulf. The present study area is approximately 500 kmlong coast of UAE (represented by dotted box in the Figure 1 including all the coastal Emirates. The shoreline for Abu Dhabi in the study area is taken around 146 km–long out of approximately 500 km, as most of the south-western part of the Abu Dhabi is under no-man’s-land therefore there is no much activity in the southern part. UAE has the sovereignty over almost 200 small islands, and an increasing number of near-shore manmade structures. Most of the structures as well as some natural and man-made islands like Saadiyat in Abu Dhabi is three meters above sea level. The coastal sector north of UAE is characterized by headland-bay configuration with a number of rock promontories (breakwaters) jutting into the sea, especially along Fujairah and Ras Al Khaimah coast (Figure 2). The worth of the present infrastructures, mainly in the capital city of Abu Dhabi, Dubai and Ras-Al Khaimah, erected on many natural and man-made islands is enormous. The Dubai and Abu Dhabi Emirate has a number of near shore manmade and natural islands like Palm Jumeirah, Palm Jebel Ali, World Islands, Palm Deira, Saadiyat Island, Yas Island, which are the dominant and attractive features along the Coast. UAE is densely populated (as per 2019 statistics) with Dubai city having 3,297,980, Abu Dhabi city consists of 1,807,000, Sharjah City 1,274,749, Ajman City 226,172, RAK City 115,949, UAQ City 61,700, Khor Fakkan 39,151 and Kalba 37,545.
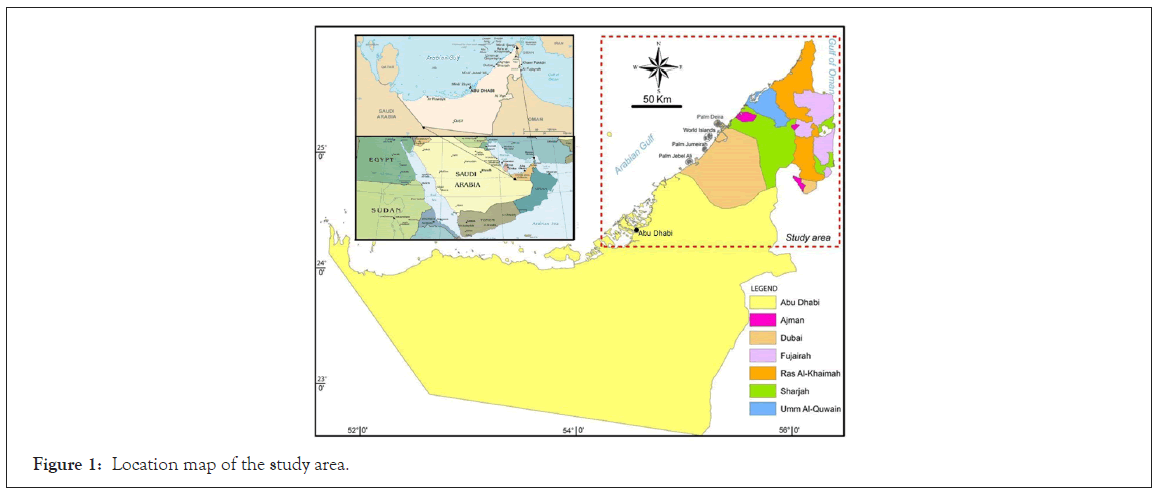
Figure 1: Location map of the study area.
Materials and Methods
The overall aim of the present methodology is to develop an objective method to identify those portions of the UAE coast at risk due to eustatic (global) sea-level rise. The future sea-level rise is likely to further intensify before accelerating shoreline erosion and other problems like damage to coastal structures, thereby making UAE coast much more vulnerable in future. The main reason to predict the future coastal changes with a notch of inevitability is useful for coastal management and development. In this background, a coastal vulnerability assessment is made in this study, aimed at identifying the degree of vulnerability of different coastal segments of UAE. To achieve the overall goal, six physical risk variables of the UAE coast are used in this study to measure the coastal vulnerability (Table 1). They are (1) coastal geomorphology (geomorphology map prepared to the coastal zone of UAE, which is below the approximate 5 m contour), (2) coastal slope, (3) shoreline change (erosion and accretion during a 19-year period between 2000 and 2019), (4) Land use/Land cover (LU/ LC map, prepared to the coastal zone of UAE, which is below the approximate 5 m contour) (5) mean spring tide range and (6) significant wave height. Earlier studies in other parts of the globe considered different parameters than above-mentioned six, which suits their coast, for coastal vulnerability. For instance, Pendleton et al. [47], Thieler and Hammer-Klose [33] included relative sea-level rise as a parameter besides leaving LU/LC from the above listed parameters for a part of the Californian coast. Rate of subsidence is considered by Doukakis [37] as one of the variables in their study. As there is no data either on the variations in relative sea-level rise or subsidence rates, so, these are not included in the present study. Elevation (instead of slope), geology and sea-level rise (including the effects of local tectonics) as three of the total six variables included in their respective studies by Gornit [48]. Geology as a parameter is not used as a separate variable in our analysis since the landform material is taken care by the geomorphology variable. We consider the slope a better parameter than elevate on in this type of analysis, since elevation refers to a point, whereas slope, which is calculated based on elevations and distances involved, denotes an area. Each physical parameter is assigned a relative risk value based on the potential magnitude of its contribution to physical changes on the coast as the sea-level rises. There are relatively number of ways to rank the variables in a CVI. The USGS approach Thieler and Hammer-Klose [33] consists of ranking each variable on an ordinal scale from one to five. Most of the CVI studies have followed the same ranking procedure but mostly without keeping the same range for the ranking of the risk variables. As per Pendleton et al. [35] used different ranges for the vulnerability ranking of a number of variables. However, no standards exist to define what should be considered very low, low, moderate, high, or very high vulnerability and even some studies used a different number of risk categories than the USGS studies. For example Boruff et al. [49] used the USGS methodology but ranked the variables into four rather than five categories, while Kumar and Kunte [50] segregated the coastline of Chennai, India into three risk categories. In the present study, the entire UAE coast is divided in to five vulnerability classes very low, low, moderate, high, and very high, separately for each of the six parameters. This kind of approach was ideal as the purpose of this study was to rank the entire UAE coast according to their relative vulnerability to the mentioned physical parameter.
| Parameters | Data used |
|---|---|
| Geomorphology | Sentinnel 2A (Jan 2019) 20 m, spatial resolution |
| Coastal slope topographical information | SRTM (30 m resolution) |
| Shoreline change | Landsat ETM (Aug 2000) 15 m, spatial resolution Sentinnel 2A (Jan 2019) 20 m, spatial resolution |
| Land use/Land cover | Sentinnel 2A (Jan 2019) 20 m, spatial resolution |
| Tidal and Wave height data | UKHO, Admirality charts (2011) |
Table 1: Source data used for different parameters.
Physical parameters and their ranking
As revealed previously, six physical variables are considered in this study for a quantitative assessment of the vulnerability of UAE coast to the predicted sea-level rise. They are (1) Geomorphology of the UAE coast, (2) Coastal Slope, (3) Shoreline change during the recent years, (4) Land use/Land cover, (5) Mean spring tide range and (6) Significant wave height. Following the nature of each of these variables, the entire UAE coast is divided and assigned vulnerability ranks ranging from 1 to 5 with rank 1 signifying very low vulnerability and rank 5 specifying very high vulnerability as detailed in the subsequent sections.
Geomorphology: Geomorphology is defined as the study of surface landforms, its processes and sediments at the surface of the Earth. The morphology of the coast is shaped by tectonic and structural features and plays an important role in determining the impact of the Sea level rise. Landforms and the material they are made of reflect their responses to sea-level rise since every landform offers certain degree of resistance to erosion [33]. While the rocky cliffs and wave cut benches offer maximum resistance and therefore very less vulnerable, the soft sandy and muddy forms such as low dunes, sabkhas, mudflats, and mangroves, etc., offer minimum resistance, on the other hand are extremely vulnerable to sea-level rise.
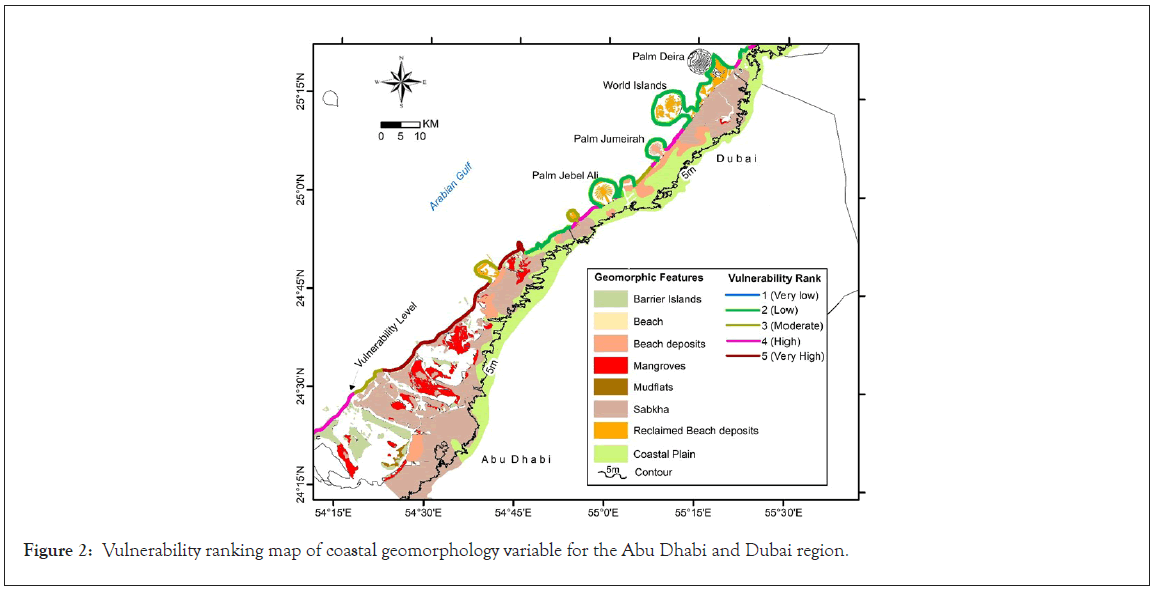
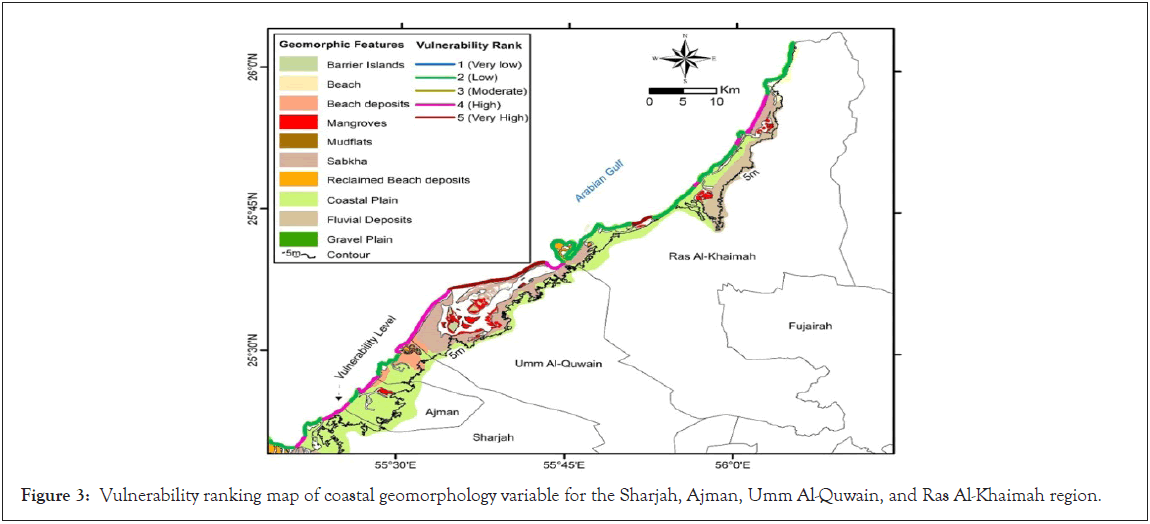
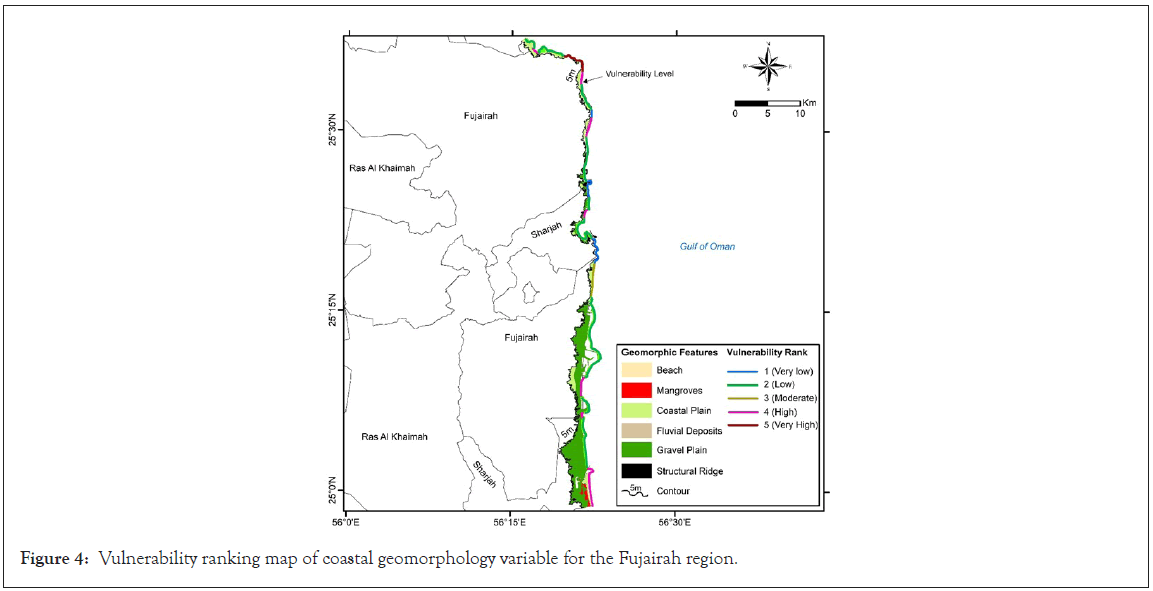
Based on the interpretation of satellite images (Sentinel 2A), a comprehensive map of coastal geomorphology of the UAE coastal region is prepared in three different maps in order to show the geomorphic features much more precisely, which are below the approximate 5-m contour (Figures 2-4). The UAE coast is predominated by landforms such as dunes, sabkhas, mudflats, barriers, spits, tidal inlets, mangrove swamps, number of rocky headlands are fringed by cliffs, wave-cut benches, and sea stacks. Considering the nature of landforms qualitatively, the entire UAE coast is segmented into five vulnerability classes as per the classifications structure detailed in Table 2. As per the above structure, a vulnerability rank number is assigned to each segment of the coast (representing the vulnerability level in terms of the geomorphology of the coast) for further scrutiny in geographical information system (GIS).
| Variable | Coastal vulnerability rank | ||||
|---|---|---|---|---|---|
| Very low (1) | Low (2) | Moderate (3) | High (4) | Very high (5) | |
| Geomorphology | Rocky coasts | Embayed/indented coasts | High dunes vegetated | Low fore dunes, creeks, lagoons | Mangroves, Creek, Mudflats, Barrier spits/islands, Sabkhas |
| Coastal slope (%) | >36 | 22-36 | 10-22 | 5-10 | <5 |
| Land use/Land cover | Barren lands | Built upland under development | Plantations, wetlands with shrubs | Built upland residential/ Industrial | Beaches, Mangroves, mudflats, Spits/islands |
| Shoreline change (m/year) | Accretion >10 | Accretion<10 | Nil | Erosion<5 | Erosion>5 |
| Mean spring tide (m) | 1.48-1.68 | 1.68-1.80 | 1.80-2.02 | 2.02-2.11 | 2.11-2.74 |
| Significant wave height (m) | <0.5 | 0.5-0.8 | 0.80-1.0 | 1.0-1.1 | >1.1 |
Table 2: Coastal vulnerability classification based on the six physical variables.
Figure 2: Vulnerability ranking map of coastal geomorphology variable for the Abu Dhabi and Dubai region.
Figure 3: Vulnerability ranking map of coastal geomorphology variable for the Sharjah, Ajman, Umm Al-Quwain, and Ras Al-Khaimah region.
Figure 4: Vulnerability ranking map of coastal geomorphology variable for the Fujairah region.
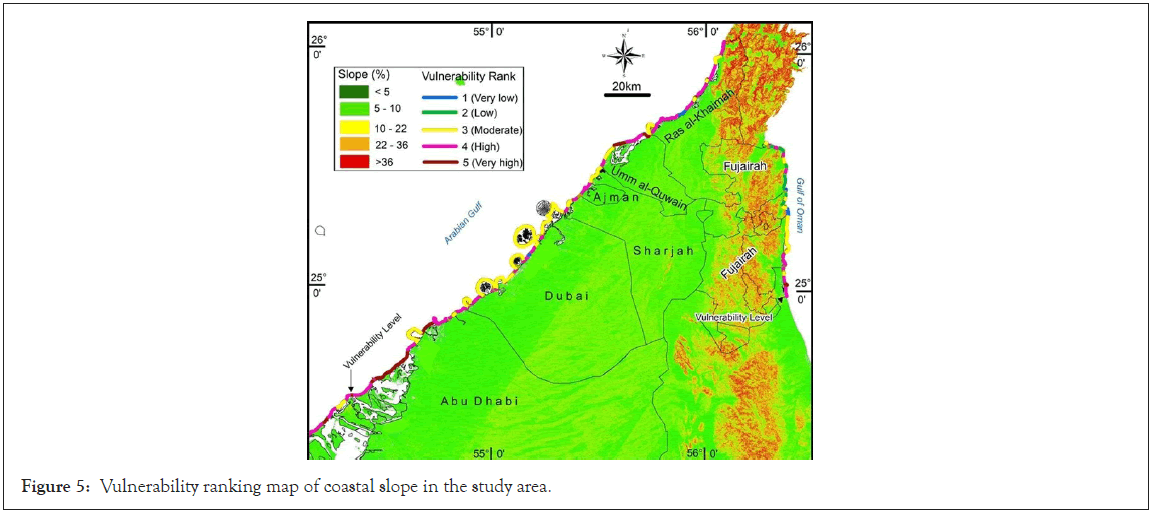
Coastal slope: Coastal slope (steepness or flatness of the coastal region) is the major factor to be considered along with the coastal morphology in estimating the impact of sea-level rise on a given coast. The vulnerability of the coast due to inundation by flooding and the concomitant land loss is a direct function of coastal slope [33]. Therefore, on a steep coast, the impact of sea-level rise would be insignificant differing to a gently sloping coast where any rise in sea level would inundate large extents of land [51]. The digital elevation models (DEM) of the entire UAE coastal area available on the internet from Shuttle Radar Topographic Mission (SRTM, 30 m resolution) are processed by removing the bad and null values (Figure 5). The final processed image is used for the preparation of Slope. The slope (%) varies from >36 to <5. The entire range of slopes is categorized into five rank classes from 1 to 5 keeping in view, the fact that higher the slope value, lower the vulnerability of the coast. Based on this, vulnerability ranks (indicating the vulnerability levels in terms of coastal slope) are assigned to all segments of the coast for further GIS analysis.
Figure 5: Vulnerability ranking map of coastal slope in the study area.
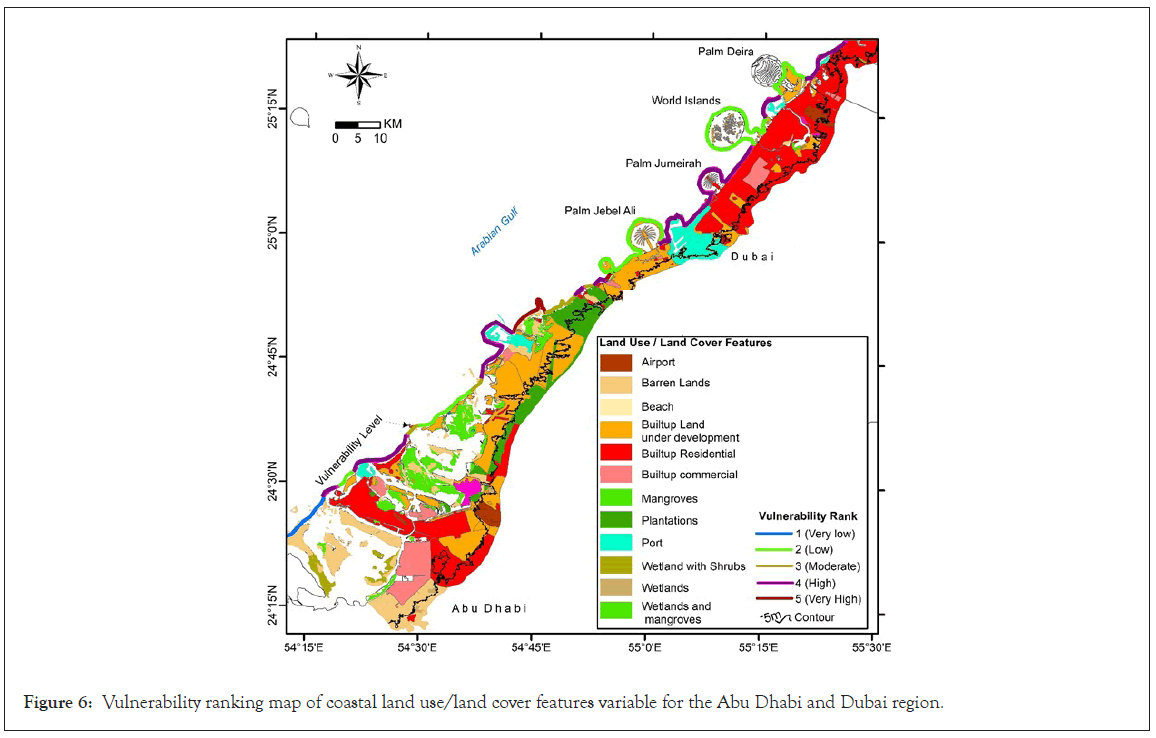
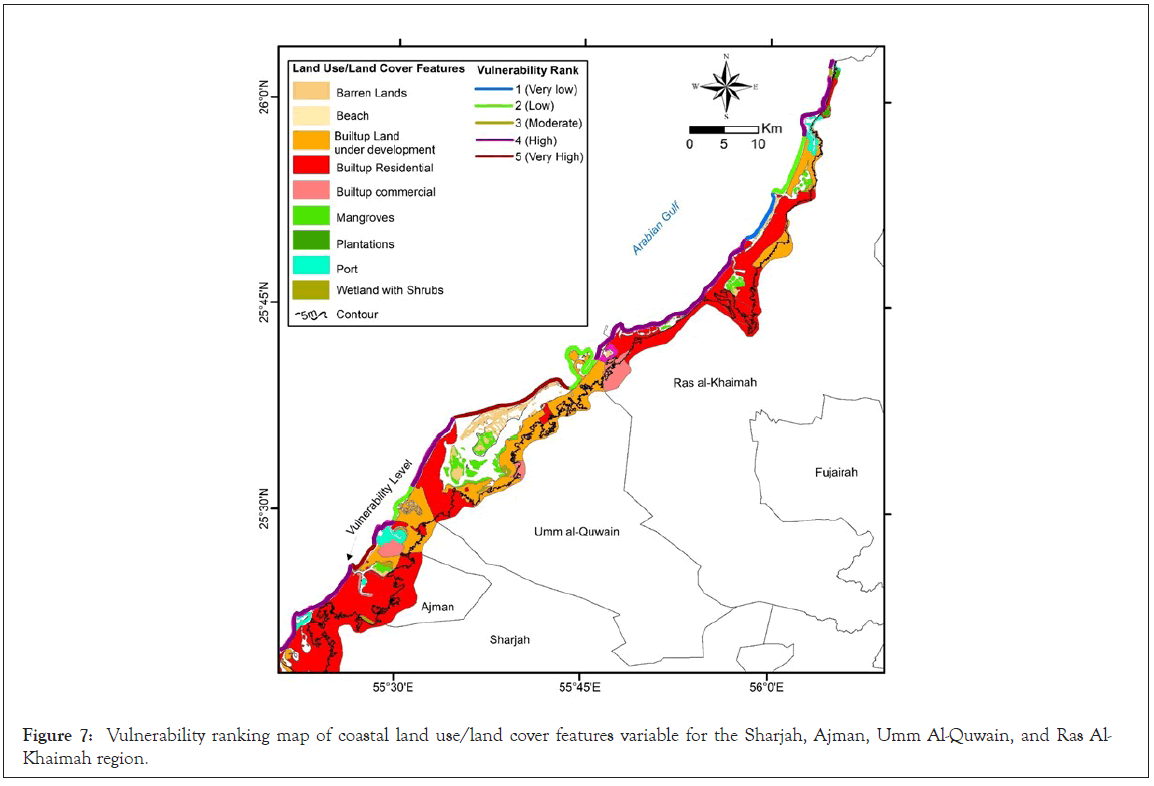
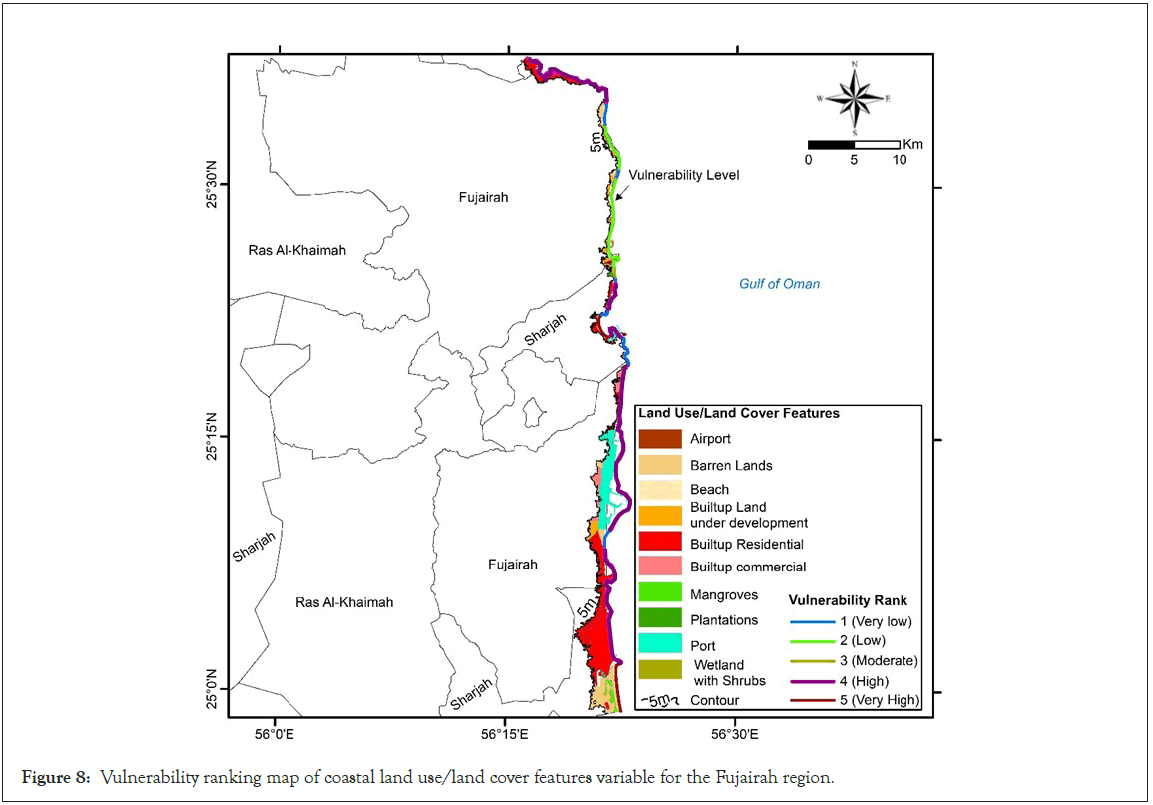
Land use/Land cover: Coastal zones are most vulnerable for land use/land cover (LU/LC) changes in this rapid urbanization and industrialization epoch. It is necessary to study the LU/LC along the coastal zones in order to develop efficient management strategies. A land use/land cover map is essential to understand the different classes in a particular region and it facilitates in increasing or diminishing the vulnerability of an area due to eustatic sea-level rise. LU/LC of a particular region is completely dependent on the anthropogenic activities [52] in addition to the climate changes. Urban areas along the shores of Abu Dhabi, Dubai, and Ras Al- Khaimah (RAK) makes the UAE coastal zone more vulnerable to the sea-level rise. In the current study, a LU/LC map is prepared (which is below the approximate 5-m contour) by image interpretation and on-screen digitization of various features in ArcGIS 10.6 on 20 m spatial resolution Sentinel 2A image pertaining to 2019. From the LU/LC map, which is prepared in three separate maps for the entire coastal region of UAE (Figures 6-8), it can be seen that the Built-upland residential covers 36% of the total area, most of it is distributed along the coast in Dubai, Abu Dhabi (Figure 6) and RAK (Figures 7 and 8). Built-upland under development is 27% in the entire UAE having 750 km2, which clearly shows the region is undergoing the construction boom. Industrial and commercial areas comprises of 6% of the total UAE area. Mangroves constitute of 5.3% along with 0.4% with mudflats, and only 0.23% of the total area comprises of sandy beaches. The main areas of urban agglomeration are considered as high vulnerable zones, and beaches, mangroves, mudflats barrier spits/islands are as very high vulnerable zones. Other areas such as plantations, builtup-under development are ranked as moderate and low vulnerable zones. Based on this, vulnerability ranks (indicating the vulnerability levels in terms of LU/LC) are assigned to all segments of the coast for further GIS analysis, refer to classification scheme (Table 2).
Figure 6: Vulnerability ranking map of coastal land use/land cover features variable for the Abu Dhabi and Dubai region.
Figure 7: Vulnerability ranking map of coastal land use/land cover features variable for the Sharjah, Ajman, Umm Al-Quwain, and Ras Al- Khaimah region.
Figure 8: Vulnerability ranking map of coastal land use/land cover features variable for the Fujairah region.
Shoreline change: Coastal shorelines are always jeopardized to the changes due to coastal processes, which are controlled by wave characteristics and the resultant near-shore circulation, sediment characteristics, and beach forms etc. The breaking of the waves and currents especially in the near–shore zone are mainly liable for the transport of shoreline sediments resulting in shoreline change. This scenario is part of a process called littoral (drift) transport, which moves the eroded material in the coastal zone by means of waves and currents. In view of the Coastal vulnerability, coasts subjected to accretion will be considered as less vulnerable areas as coast moves toward the ocean and results in the addition of land areas, where as coasts experiencing erosion are considered as vulnerable because of the resultant loss of private, public property and important natural habitats such as beaches, dunes, and marshes.
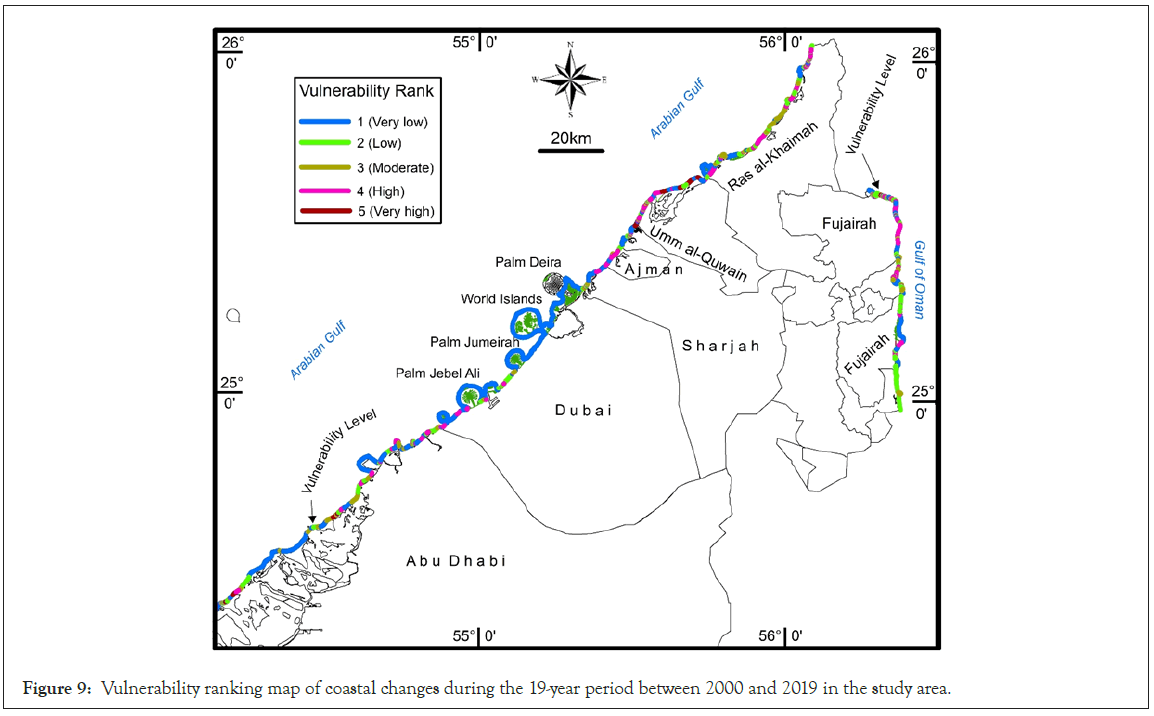
The extensive trends in shoreline behavior in the recent past are helpful to a certain extent in understanding the coastal response to future sea-level rise. The shorelines were digitized using the Landsat ETM of year (2000) which is projected to the Universal Transverse Mercator (UTM) projection system zone 40 with WGS-1984 datum and made a comparison with the present Sentinel 2 image (2019) shoreline which is projected to the Universal Transverse Mercator (UTM) projection system zone 40 with WGS-1984 datum. By using overlay technique in GIS, the shift of the shoreline during the 19- year period from 2000 to 2019 is extracted. The near infrared band and the resampling method – cubic convolution is most suitable for the demarcation of the land-water boundary, has been used to extract the shoreline. The digitized shorelines for the years 2000 and 2019 in the vector format were used as the input to calculate the rate of shoreline change using the Digital Shoreline Analysis System [42]. The Dubai shoreline is under depositional coast as most of the areas are reclaimed in order to develop a world-class real estate developments. Considering the rate of change, which was variable along the coast, vulnerability ranking is assigned to various coastal segments following the ranges in the rankings scheme given in Table 2. Using this classification, all the coastal sectors of UAE coast are ranked from one to five as depicted in Figure 9 for further analysis in GIS.
Figure 9: Vulnerability ranking map of coastal changes during the 19-year period between 2000 and 2019 in the study area.
Spring-tidal Range: Tides are described as the rise and fall of sea levels triggered by the collective effects of the gravitational forces exerted by the moon and the sun and also due to the rotation of the Earth. Tidal range is defined as the vertical difference (in meters) between the high tide and low tide. Both permanent and episodic inundation hazards are linked to tidal range. Gornitz [48] suggested that spring tidal range when concomitant with the stronger tidal currents, will have the capacity to cause conspicuous erosion and helps in transport of the sediments. Therefore, a particular segment of the coastline is considered highly vulnerable, if it is having high tidal range, whereas coastline with low tidal ranges are assigned to be of low vulnerable.
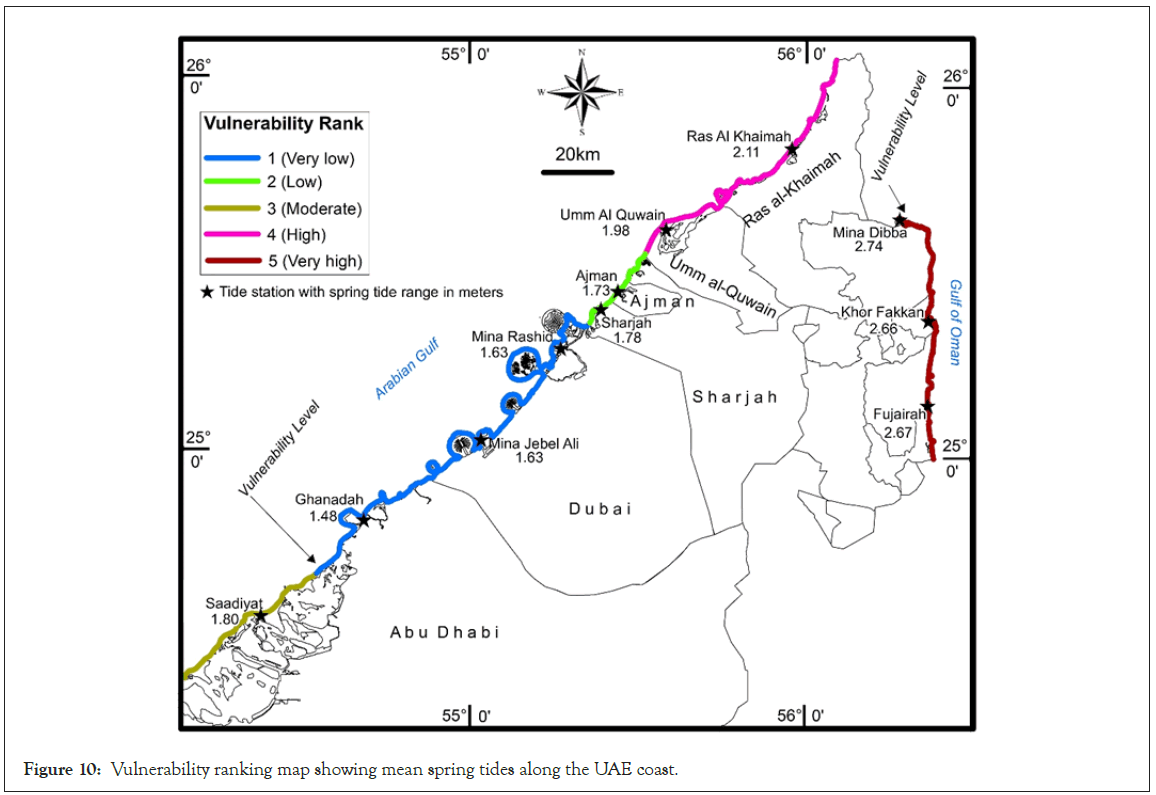
As known form the tidal ranges shown in the hydrographic charts published by the United Kingdom Hydrographic Office, the UAE coast is under the influence of microtidal (<2 m) inside the gulf and mesotidal (2-4 m) environment along the Fujairah coast. The spring tides are taken into consideration from 11 stations all along the coast (Figure 10). The spring tide range at Ghanada located in Abu Dhabi in the southwest is lowest at 1.48 m whereas the highest range of 2.74 m at Mina Dibba in the northeast sector stationed in Fujairah. Based on these tidal ranges at the 12 stations, the entire coastline is segmented to assign the tide range values of the respective nearest tide station. For instance, the coastline between Ghanadah (1.48 m) and Jebel ali (1.63 m) to its immediate north is divided into equal segments with the segment near to Ghanada represents 1.48 m and the segment near to Jebel ali represents 1.63 m. Thus the entire UAE coastline is segmented based on the tidal range values at the 12 stations. Subsequently, the vulnerability ranking is given (Table 2) following the vulnerability ranges from [41]. Since the tidal range is between 1.48 m and 2.74 m, the entire UAE coast has fallen into 5 categories namely very low vulnerable level (1.48 m-1.68 m), low vulnerable level (1.68 m – 1.80 m), and very high vulnerable level (2.11 m–2.74 m) as far as the tidal range is considered. The entire coast is divided into five vulnerable categories as shown in Figure 10.
Figure 10: Vulnerability ranking map showing mean spring tides along the UAE coast.
Significant wave height–SWH: The waves which are basically produced by the energy passing through the water, and are the main hydrodynamic force on the beaches, by transporting the sediment along the coast and therefore transmuting the shoreline periodically. Waves with larger wave height are broken with higher energy on beaches, muster larger sediment volumes, and induce larger morphodynamic changes. Thus, the increase in the incident wave power, particularly if it is combined with an increased sea level, catalyze many coastal responses such as permanent erosion and inundation. In most of the CVI assessments, wave height, is included as an indicator of wave energy, driving coastal sediment budget.
Direct wave measured in-situ datasets are the most reliable sources of information. In the Arabian Gulf area, this information is rare or completely missing in some parts of the gulf. From the last few years, Abu Dhabi Municipality (ADM) and Dubai Municipality (DM) started to monitor the wave conditions in different locations spreading across Abu Dhabi [53] and Dubai waters [www. DubaiCoast.ae] with the help of Acoustic Doppler Current Profilers (ADCP). Considering the data from ADM and DM and absence of data in other parts of the Arabian Gulf and also keeping in mind the offshore conditions in the region, which are quite mild, characterized by the absence of extreme wind and wave conditions as the Arabian Gulf is an enclosed basin. In the absence of the insitu data in other parts of the Arabian Gulf, computer simulated high resolution wave models such as Simulating Waves Nearshore (SWAN) are taken into consideration in this study.
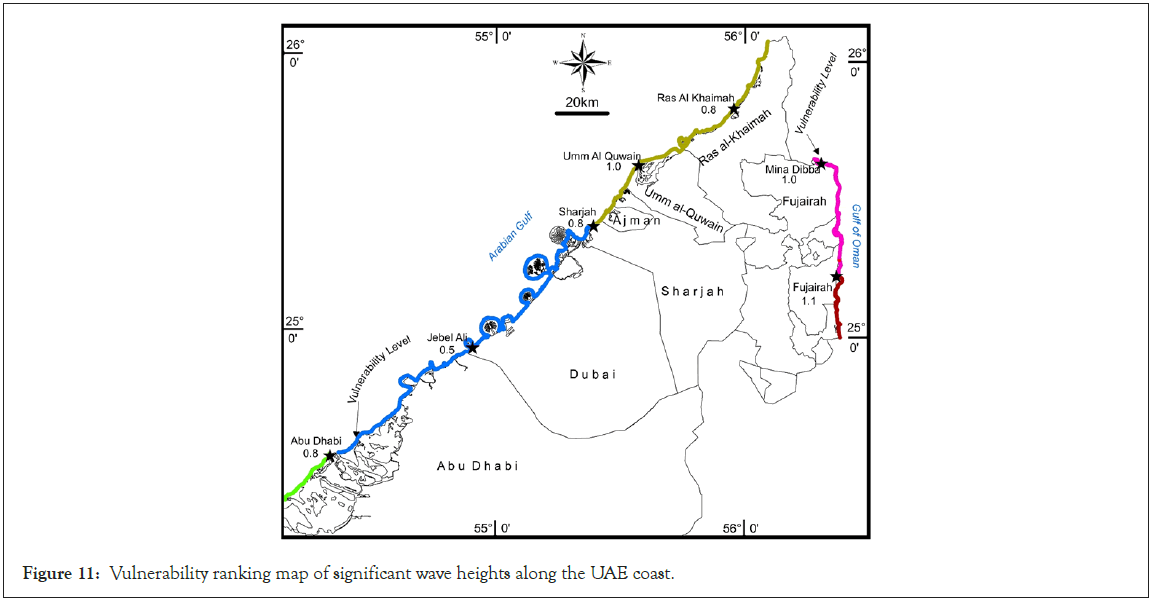
The in-situ data from ADM and DM from a particular time period from 2017 and 2018 were compared with the simulation data of the corresponding same time period. Then a very good correlation coefficient of 0.831 has obtained from comparing the two datasets indicating the dependability of the simulated wave data in the areas where in-situ data is missing. Hence, Data from ADM and DM were used in the respective Abu Dhabi and Dubai areas, whereas in other parts of the UAE coast, modelled data of significant wave heights are used. Apart from the station in Dubai, 7 stations were selected which helps in covering the entire UAE coast (Figure 11). The SWH in Dubai at Jebel Ali is 0.5 m is minimum and maximum of 1.1 m in the northeast part of UAE located in Fujairah. Based on the significant wave heights at these 7 locations, the entire coastline is segmented to assign the SWH values of the nearest station. In order to assign the SWH values to the entire coast, the coastal segment between the two wave stations is approximately divided into two parts and the SWH value of the station nearer is dispensed to each coastal division. Further the entire UAE coast is classified into five vulnerability classes adopting the SWH classification from [33,47].
Figure 11: Vulnerability ranking map of significant wave heights along the UAE coast.
Coastal vulnerability index
All the six maps showing the entire coastline, divided according to their respective vulnerability ranks, are combined in ArcGIS to derive a coastal vulnerability index (CVI) for various sections of the entire UAE coast. The CVI was earlier calculated before from Argentina coast [36,42] from Tamil Nadu coast, India [41] from Karnataka coast, India, and from Spain [7], as the square root of the product of the ranking factors (1 to 5 for each parameter) divided by the number of parameters, and also multiplying the variables with a particular value and adding each other from Andhra Pradesh coast [51], India. On the contrary, examining the product and as well as the sum of individually weighted variables was more receptive to the ecological diversity. The present calculation is using both the methods also indicated that the sum of the six variables with the rank numbers (1 to 5) of each multiplied by a definite weightage value, as detailed below. As such the six variables are individually weighted by multiplying the vulnerability rank values by certain multiplication factors depending upon the fundamental significance of the six variables in the study.
For example, geomorphology, slope and Land use/Land cover (LULC) are the three major factors influencing the coastal retort to sea-level rise. This was profusely evident from the impact of the tsunamis that happened in 2004 Dec 26 and 2011 Japan tsunami. Several investigations made along the Indian coast and the Japanese coast indicated, the role of geomorphology, coastal slope and LULC in the tsunami impact. Consequently, because of the relative significance of geomorphology, slope and LULC over the rest of the three variables in deciding the coastal response to sea-level rise, a maximum value of 4 is assigned to first two variables and weightage 3 to LULC and 2 to shoreline change. The ranks for tide and SWH are taken for calculation without assigning any additional weightages. Finally, the subjective values of all the six variables are used to calculate the CVI for the entire UAE coast through the method of addition using the below formula:
Coastal Vulnerability Index=4g+4s+3lulc+2c+t+hs
Here g denotes vulnerability ranking of geomorphology, s denotes to the coastal slope, c denotes to shoreline change, lulc denotes to the land use/land cover, t denotes to spring tide range, and finally hs denotes to the significant wave height. The numbers 4, 3 and 2 are the weightage numbers assigned to the respective variables depending upon their comparative importance. The entire six variables data are processed in the GIS software (ArcGIS 10.6). The six variables which are in the shapefiles format are taken into ArcGIS and the vulnerability ranks for all the coastal sections for the six variables are entered into their respective attribute tables against the ID of each coastal division. The weighted values of each variable for each coastal section are also obtained by multiplying the vulnerability rank values by the given weightage factors of the respective variables. For instance, if the vulnerability rank of a specific coastal segment is 4 ( which is high vulnerable) for the variable ‘geomorphology’, the rank value 4 is multiplied by the weightage factor of 4, which is assigned to geomorphology. Therefore, the weighted value for that coastal section would be 16 as far as geomorphology is concerned. Similarly, the weighted values of all the coastal divisions for all the variables are entered in the respective column in the attribute tables. The weighted values are generated once the formula with the multiplication factor is given in the particular column head in the attribute table. Then the six shapefiles are fused together using the ‘Spatial Join’ option in ‘Overlay’ module in ‘ArcTools’ menu. In this study, we have taken the entire coastline as a line feature class in GIS, therefore, every point along the coast is considered for the analysis. The final output layer contains the attributes of all the six variables. Thus the final map generated, combining all the variables showed 269 segments of the coast having a unique number in its respective attribute table. Another column in the attribute table is added for entering the above stated CVI formula so that the system generated the CVI values for all the 269 coastal sections of the UAE coast by adding the weighted values of the vulnerability ranks assigned to the various segments of all the six variables.
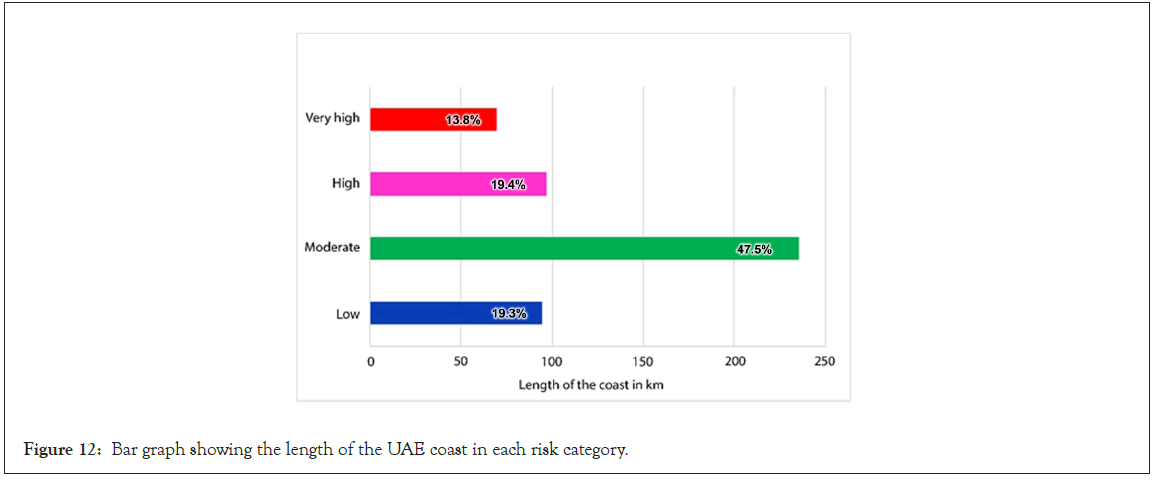
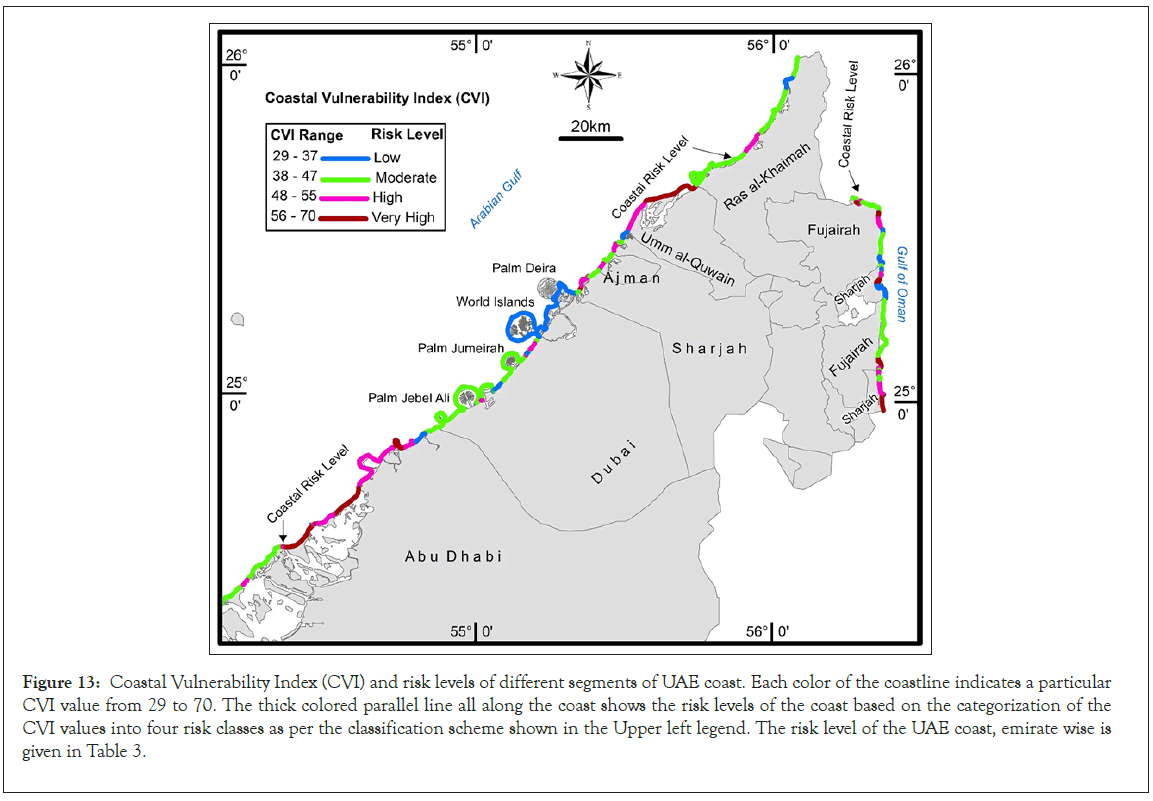
The CVI values hence arrived ranged between 29 to 70. The mean CVI value is 45.9 and the standard deviation is 25. The CVI scores are divided into low, moderate, high and very high risk categories based on the quartile ranges and visual inspection of the data (Figure 12). The CVI values when divided into quartile ranges, the rocky coast along the Fujairah have fallen into low risk coasts and barrier spits, mangrove coast, mudflats/sabkhas coasts into very high risk coasts. We tested and finalized the CVI values. Below 37 are assigned to the low risk category. Values from 37 to 47 are considered as moderate risk, values lying between 47 to 55 are considered as high-risk category and CVI values above 55 are classified as very high risk category. Accordingly the coastal risk level map for the UAE coast is generated by grouping various coastal segments into above said classes. Figure 13 shows a bar graph of the length and percentage of the shoreline in each risk category. A total of 500 km long shoreline is studied, out of which, 69 km (13.8%) of the UAE coast is under very high-risk category and 96.82 km (19.4%) is under high risk and 235.8 km (47.5%) into moderate risk category, and finally 94.5 km (19.3%) is under low risk category.
Figure 12: Bar graph showing the length of the UAE coast in each risk category.
Figure 13: Coastal Vulnerability Index (CVI) and risk levels of different segments of UAE coast. Each color of the coastline indicates a particular CVI value from 29 to 70. The thick colored parallel line all along the coast shows the risk levels of the coast based on the categorization of the CVI values into four risk classes as per the classification scheme shown in the Upper left legend. The risk level of the UAE coast, emirate wise is given in Table 3.
Discussion
The fact that the advancement of vulnerability index tools are scientifically popular, CVI’s are robust management tools to highlight potential coastal hotspots to coastal hazards. It is also imperative to understand the effect of a calculation upon the resultant index, while selecting the specific method for the integration of variables in calculation of a vulnerability index. In this study the vulnerability of the UAE coast is scrutinized by relating the sensitivity of different versions of CVI, to mention a few [38,48,51]. Geomorphology is the only variable that all the above CVI rankings categorized with similar vulnerability classes. This is due to the fact that all of them consider the role played by this variable to control vulnerability in the same way. As this variable is gauged in qualitative terms i.e, coastal type, the interrelated ranking intervals are mostly the same for different methods.
Coming to the shoreline changes, all methods considers the same way, provides different vulnerability values due to differences in the ranking system adopted due to the local prevailing conditions. In some studies, it is not only the typical shoreline changes but also the beach width is also considered [38,54].
Coastal slope and elevation assessment shows disparity in vulnerability ranks. For example, coastal elevation to reflect in their vulnerability index [41,48,55,56]. In this study, we consider the slope a better parameter than elevation on in this type of analysis, since elevation refers to a point, whereas slope, which is calculated based on elevations and distances involved, denotes an area.
Regarding the wave parameter, mostly minute variations are observed among different methods. This is mainly due to different ways adopted to depict the wave climate. If this component is going to be used to distinguish storm induced risks then the use of mean significant wave height should not be the best choice. In this regard, the use of maximum wave height would be more demonstrative method [48]. The selected intervals to characterize the vulnerability associated to this parameter is adapted to regional wave characteristics.
As per the tidal contribution, CVI’s reflect very different vulnerability conditions because the role played by the tide is different in various studies. One of the observed features from all the studies is that, unless the analysis is done at a very large spatial scale where tidal range can significantly vary, this variable does not add much information to the vulnerable hotspots along the coast. Although as previously revealed, different views can be adopted, it’s been pondered that micro-tidal coastlines are very sensitive to SLR and their coastal ecosystems [57], such as wetlands are less resilient to water level changes [58,59].
Finally in the present study, risk classification indicates that the UAE coast over a length of 69 km (13.8%) out of 500 km-long shoreline is under the very high-risk category mostly along the Abu Dhabi coast and Umm Al-Quwain coast (Figure 13). These coastal areas, which are low lying and almost flat with mudflats, mangrove swamps and lagoons/backwaters and barrier spits. Moreover, these shoreline segments are experiencing sea level inundation by the slowly encroaching sea for the last decade and are also under very high-risk category in our CVI analysis. The Dubai coast is mostly under moderate to low risk category due to the influence of minimum tidal and wave ranges. Geomorphologically the entire coast, which primarily consists of sandy beaches, and backed by the low-level dunes and partly stabilized by the vegetation, has been completely altered by reclaiming and constructing palm islands (Jebel ali, Jumeirah, and Deira), and world islands. A total of ~53.474 km2 has been added to the Dubai coast between 2000 to 2019, this shows how the entire Dubai coastal zone is in tremendous pressure. The UAE coast over a length of 96.82 km (19.4%) is under high-risk category, mostly along the Abu Dhabi, UAQ, Sharjah, certain pockets in RAK and Fujairah. The major section of the UAE coast 235.8 km (47.5%) into moderate risk category (Figure 13), falling mainly along the Dubai, RAK and Fujairah coast. The Fujairah coast, which has certain pockets of rocky coast over a length of 14 km and some embayed/indented coastal sectors, are falling under the low to moderate risk category. While in Ras Al-Khaimah, majority of the coast 61.6 km is falling under the moderate risk category, because mostly the RAK coast is with high dunes stabilized with vegetation and behind the coast is a low-lying plane backed by the Hajar mountains. Also 6.9 km into high-risk category and 4.85 into low risk category (Table 3).
| Coastal Sector | Length of the coast in each risk categories (km) | ||||
|---|---|---|---|---|---|
| Low | Moderate | High | Very high | Total | |
| Abu Dhabi | 4.07 | 34.5 | 45.02 | 32.9 | 116.49 |
| Dubai | 67.5 | 78.5 | 3.8 | 149.88 | |
| Sharjah | 2.9 | 8 | 10.1 | 2.24 | 23.24 |
| Ajman | 5.9 | 4.5 | 10.4 | ||
| Umm Al-Quwain | 11.6 | 18.8 | 30.4 | ||
| Ras Al-Khaimah | 4.85 | 62.6 | 6.9 | 0.5 | 74.85 |
| Fujairah/Khor-Fakkan | 15.12 | 48.3 | 15.9 | 15.5 | 94.82 |
| Grand total | 94.44 | 235.8 | 96.82 | 69.9 | 500 |
Table 3: Data on the risk level of the coast in different emirates.
Apprehensions about climate change all over the world has led to increasing set of researchers on coastal vulnerability to SLR [59]. The present study aimed to bring out the Coastal Vulnerability to UAE coast in the light of the rising sea levels, in order to act appropriately to protect the people and property. The CVI method is very effective way to highlight coastal zones where the effects of sea-level rise may be the greatest. The CVI developed for the UAE coast in this study by ranking six physical variables such as coastal geomorphology, coastal slope, rate of shoreline change, coastal LU/ LC, mean spring tide range and significant wave height showed the risk level of different sections of the coast. These variables are opted on the basis of a brainstorming review of international literature and are in agreement with the variables used in the CVI’s in other parts of the world. Instead of dividing the coast into grids which might simplify the conditions, depending upon the size of the grid cell. Analyzing the entire UAE coastline as a line feature using GIS technology, as validated in this study, conveys a more accurate picture of the vulnerability level of any point along the coast. The CVI map (Figure 12) presented here can be fathomed in at least couple of ways: a) to identify areas where conspicuous changes likely to occur along the coast and b) as a planning tool for managing and protecting resources in the entire UAE coast. The CVI analysis revealed that about 69 km (13.8%) of the UAE coast is under very high-risk category and 96.82 km (19.4%) is under high risk and 235.8 km (47.5%) into moderate risk category, and finally 94.5 km (19.3%) is under low risk category, which calls for protective measures to prevent loss of invaluable coastal assets and displacement of people who, mostly dwelling along the coast by investing huge amounts.
This study is mainly concentrated on vulnerability due to eustatic SLR. There are other impacts of SLR but not discussed here and that are relevant to UAE coast includes industrial and sewage pollution, harmful algal blooms and oil spills which is another hazard affecting the coast of UAE. The Arabian Gulf is crowded with oil rigs and platforms which are engaged in the exploration of oil and natural gas [60,61]. Oil slicks can easily reach the shore during the favorable high wave or spring tidal actions, causing damage to the marine habitats and effecting the people along the coast. These kind of hazards are not considered in the present study but definitely has the potential to increase the likelihood of hazardous events with respect to oil spill.
Conclusion
We strongly ascertain that the results of this assessment which are based on the most reliable scientific information presently available will serve to increase the awareness about the vulnerability of the coastal zones of UAE to erosion, flooding and SLR. In the future, work should include more towards social, economic and also environment characteristics in the assessment. This study remains only a first step towards a comprehensive vulnerability assessment but in the future we can integrate more variables to evaluate the vulnerability of the UAE coastal systems to the impacts of coastal hazards.
Acknowledgements
This research has been supported by the National Water Center of the United Arab Emirates University. The authors would like to thank the editorial board of the journal as well as the reviewers for their professional support.
Conflicts of Interest
The authors declare no conflict of interest
REFERENCES
- Allen JC, Komar PD. Climate controls on us west coast erosion processes. J Coast Res. 2006;22:511-529.
- Meehl GA, Washington WM, Collins WD, Arblaster JM, Hu A, Buja LE. How much more global warming and sea level rise? Science. 2005;307:1769-1772.
- IPCC UN (International Panel on Climate Change). Climate Change: The Physical Science Basis. Cambridge University Press. 2013.
- Sanders BF. Evaluation of on-line dems for flood inundation modeling. Adv Water Resour. 2007;30:1831-1843.
- Bruun P. Sea-level rise as a cause of shore erosion. J Water Harb. 1962;88:117-132.
- Ranasinghe R, Callaghan D, Stive M. Estimating coastal recession due to sea level rise: Beyond the bruun rule. Clim Change. 2012;110 (3–4):561-574.
- Aysun Koroglu, Roshanka Ranasinghe, Jose A Jimenez, Ali Dastgheib. Comparison of coastal vulnerability index applications for barcelona. Ocean Coast Manag. 2019;178:104799.
- Aucelli PPC, Di Paola G, Rizzo A, Rosskopf CM. Present day and future scenarios of coastal erosion and flooding processes along the italian adriatic coast: The case of molise region. Environ Earth Sci. 2018;77(10).
- Woodruff JD, Irish JL, Camargo SJ. Coastal flooding by tropical cyclones and sea-level rise. Nature. 2013;504:44–52.
- Shareef. Disappearing beaches of kerala. Curr Sci. 2007;92(2).
- Meher-Homji, VM. Sea-walls-a necessary evil. Curr Sci. 2007;92:878.
- Armanfor M, Goharnejad H, Niri MZ, Perrie W. Assessment of coastal vulnerability in chabahar bay due to climate change scenarios. Oceanologia. 2019; 61:412-426.
- Aucelli CPP, Di Paola G, Incontri P, Rizzo A, Vilardo G, Benassai G, et al. Coastal inundation risk assessment due to subsidence and sea level rise in a mediterranean alluvial plain (Volturno Coastal Plain E Southern Italy). Estuar Coast Shelf Sci. 2016.
- Ali C Demirkesen, Evrendilek Faith, Berberoglu Suha. Quantifying coastal inundation vulnerablity of turkey to sea-level rise. Environ Monit Assess. 2008;138:101-106.
- Muthusankar G, Lakshumanan C, Pradeep-Kishore V, Eswaramoorthi S, Jonathan MP. Classifying inundation limits in se coast of India: Application of gis. Nat Hazard. 2013;65:2401-2409.
- Kellet J, Balston J, Weston M. Sea-Level Rise And Planning: Retrospect and prospect. Aust Plan. 2014;51(3):203-211.
- Alexander D, Nasheed M. Climate: Rich and poor must work together accessed 24 March. 2020.
- Wigley TML. The pre-industrial carbon dioxide level. Climate change. 1983;5:315-320.
- Climate Central. 2020
- Courtland R. Polar bear numbers set to fall. Nature. 2008;432-433.
- Chen JL, Wilson CR, Tapley BD. Satellite gravity measurements confirm accelerated melting of greenland ice sheet. Science. 2006;313:1958-1960.
- Stroeve J, Holland MM, Meier W. Arctic sea ice decline: Faster than forecast. Geophys Res Lett. 2007;34:L09501.
- Rignot E, Bamber JL, vander Broeke MR. Recent antarctic ice mass loss from radar interferometry and regional climate modeling. Nat Geosci. 2008;1:106-110.
- Chen JL, Wilson CR, Tapley BD, et al. Antarctic regional ice loss rates from grace. Earth Planet Sci Lett. 2008;266:140-148.
- Strohecker K. World sea levels to rise 1.5 M By 2100 scientists. A new scientist news service and reuter’s publication. 2008.
- Milne GA, Gehrels WR, Hughes CW, Tamisiea ME. Identifying the causes of sea-level rise. Nat Geosci. 2009;2:471-478.
- Adam Vaughan. IPCC report: Sea levels could be a metre higher by 2100. New scientist. 2019.
- Lin L, Pussella P. Assessment of vulnerability for coastal erosion with gis and ahp techniques case study: southern coastline of sri lanka. Nat Resour Model. 2017.
- Neumann B, Vafeidis AT, Zimmermann J, Nicholls RJ. Future coastal population growth and exposure to sea-level rise and coastal flooding–A global assessment. PLoS One. 2015;10(3):e0118571.
- Brown LR. Rising sea level forcing evacuation of island country. Earth Policy Inst. 2001.
- Sanchez-Arcilla A, Jimenez A, Valdemoro HI. The ebro delta: Morphodynamics and vulnerability. J Coast Res. 1998;14:754-772.
- Birkmann, J. Conceptual frameworks and definitions. In Birkmann J measuring vulnerability to natural hazards. U N Univ Press Tokyo. 2006;9-54.
- Thieler ER, Hammer-Klose ES. National assessment of coastal vulnerability to sea level rise: Preliminary results for the US atlanta coast. USGS Open File Report. 1999. 99,593.
- Gornitz VM, Daniels RC, White TW, Birdwell KR. The development of a coastal risk assessment database: vulnerability to sea-level rise in the U.S. southeast J Coast Res. 1994;12:e327-e338.
- Pendleton EA, Thieler ER, Jeffress SW. Coastal vulnerability assessment of golden gate national recreation area to sea-level rise. United States Geological Survey Reston Virginia. 2005.
- Diez PG, Perillo GME, Piccolo MC. Vulnerability to sea-level rise on the coast of buenos aires province. J Coast Res. 2007;23:119-126.
- Doukakis E. Coastal vulnerability and risk parameters. EurWater. 2005;11(12):3-7.
- Daniela P, Felice D. Alessandro, Luigia R, Francesca P, Guiseppa RT. Application of a coastal vulnerability index. A case study along the apulian coastline Italy. Water. 2018;10:1218.
- Sasi MPR, Mohammedali NP, Tiwari SP, Vengadasalam R. Mapping and analysis of the physical vulnerability of coastal Tamil Nadu. Hum Ecol Risk Assess. 2019.
- Faour G, Fayad A, Mhawej M. GIS-based approach to the assessment of coastal vulnerability to sea-level rise: Case study on the eastern mediterranean. J Surv Eng. 2013;1(3):41-48.
- Jana AB, Hegde AV. GIS Based approach for vulnerability assessment of the karnataka coast, India. 2016.
- Sankari ST, Chandramouli AR, Gokul K, Mangala SSS, Saravanavel J. Coastal vulnerability mapping using geospatial technologies in cuddalore-pichavaram coastal tract Tamil Nadu, India. Aquatic Procedia. 2015;4:412-418.
- Dasgupta S, Laplante B, Meisner C, Wheeler D, Yan J. The impact of sea level rise on developing countries: A comparative analysis. World bank policy research working paper. 2007;4136:16-22.
- Garland GG. Rising sea level and long-term sustainability of near-shore islands of the united arab emirates: An approach to establishing setback lines for Abu Dhabi. WIT Trans Ecol Environ. 2010;130:135-146.
- Robert AM, Garland GG. Predicting the extent of inundation due to sea-level rise: Al Hamra development, Ras al Khaiman, UAE. A pilot project. Miscellanea Geographica-Regional Studies on Development. 2016;20(2):25-31.
- Taoufik SK, Tarek Y, Abdelmawla E. Sea level rise and abu dhabi coastlines: An initial assessment of the impact on land and mangrove areas. J Ecosyst Ecogr. 2012;2(4).
- Pendleton EA, Thieler ER, Williams SJ. Coastal vulnerability assessment of cape hettaras national seashore (CAHA) to sea level rise. 2004.
- Gornitz V. Global coastal hazards from future sea level rise. palaeogeogr palaeoclimatol palaeoecol. 1991;89:379–398.
- Boruff BJ, Emrich C, Cutter SL. Erosion hazard vulnerability of the us coastal counties. J Coast Res. 2005;21(5):932-942.
- Kumar AA, Kunte PD. Coastal vulnerability assessment for chennai, east coast of India using geospatial techniques. Nat Hazards. 2012;64:853-872.
- Nageswara RK, Subraelu P, Venkateswara RT, Hema MB, Ratheesh R, Bhattacharya S, et al. Sea-level rise and coastal vulnerability: An assessment of Andhra Pradesh coast. India. J Coast Conserv. 2008;12:195-207.
- Murali RM, Vethamony P, Saran AK, Jayakumar S. Change detection studies in coastal zone features of goa, India by remote sensing. Curr Sci. 2006;91:816-820.
- Waleed H, Letizia L, Francesco L, Giuseppe RT, Felice DA. Wave climate at shallow waters along the Abu Dhabi. Coast Water. 2018;10:985.
- Jimenez JA, Valdemoro HI. Shoreline evolution and management implications in beaches along the catalan coast. In: Morales JA (Ed.) the spanish coastal systems. Dynamic processes, sediments and management Springer. 2019;745-764.
- Pravin DK, Nitesh J, Utkarsh M, Mahender K, Andrew SH. Multi-hazards coastal vulnerability assessment of goa, India using geospatial techniques. Ocean & Coast Manag. 2014;95:264-281.
- Shaw J, Taylor RB, Forbes DL, Ruz MH, Solomon S. Sensitivity of the canadian coast to sea-level rise. Geol Surv Can Bull. 1998;505.
- Benassai G, Di Paola G, Aucelli PPC. Coastal risk assessment of a micro-tidal littoral plain in response to sea level Rise. Ocean Coast Manag. 2015;104:22-35.
- Cahoon D, Guntenspergen G. Climate change, sea-level rise and coastal wetlands. National wetlands newsletter. 2010;32:8-12.
- Boruff BJ, Emrich C, Cutter SL. Erosion hazard vulnerability of us coastal counties. J Coast Res. 2005; 21(5):932-942.
- W El-Sayed Elshorbagy, A Awad Elhakeem. Forecasting the oil spill impacts on coastal desalination plants in United Arab Emirates wit transaction on ecology and the environment. 2012;164. WIT Press.
- HA Harahsheh. Oil spill detection and monitoring of Abu Dhabi coastal zone using kompsat-5 SAR imagery. The international archives of the photogrammetry, remote sensing and spatial information sciences. 2016.
Citation: Subraelu P, Yagoub MM, Sefelnasr A, Nageswara Rao K, Allamsatti RS, Sherif M, et al. (2021) Sea-level Rise and Coastal Vulnerability: A Preliminary Assessment of UAE Coast through Remote Sensing and GIS. J Coast Zone Manag. 24:477.
Copyright: © 2021 Subraelu P, et al. This is an open-access article distributed under the terms of the Creative Commons Attribution License, which permits unrestricted use, distribution, and reproduction in any medium, provided the original author and source are credited.

