Indexed In
- Open J Gate
- Genamics JournalSeek
- Academic Keys
- JournalTOCs
- CiteFactor
- Ulrich's Periodicals Directory
- Access to Global Online Research in Agriculture (AGORA)
- Electronic Journals Library
- Centre for Agriculture and Biosciences International (CABI)
- RefSeek
- Directory of Research Journal Indexing (DRJI)
- Hamdard University
- EBSCO A-Z
- OCLC- WorldCat
- Scholarsteer
- SWB online catalog
- Virtual Library of Biology (vifabio)
- Publons
- Geneva Foundation for Medical Education and Research
- Euro Pub
- Google Scholar
Useful Links
Share This Page
Journal Flyer
Open Access Journals
- Agri and Aquaculture
- Biochemistry
- Bioinformatics & Systems Biology
- Business & Management
- Chemistry
- Clinical Sciences
- Engineering
- Food & Nutrition
- General Science
- Genetics & Molecular Biology
- Immunology & Microbiology
- Medical Sciences
- Neuroscience & Psychology
- Nursing & Health Care
- Pharmaceutical Sciences
Research Article - (2023) Volume 14, Issue 3
Screening of Bread Wheat Genotypes for Slow Rusting Resistance to Yellow Rust (Puccinia striiformis f.sp. tritici) and Association among Parameters in Southeastern Ethiopia
Tilahun Bayisa1*, Habtamu Terefe2 and Tesfaye Letta32Department of Plant Sciences, Haramaya University, Dire Dawa, Ethiopia
3Department of Plant Sciences, Oromia Agricultural Research Institute, Addis Ababa, Ethiopia
Received: 29-Dec-2021, Manuscript No. JPPM-21-15307; Editor assigned: 03-Jan-2022, Pre QC No. JPPM-21-15307(PQ); Reviewed: 17-Jan-2022, QC No. JPPM-21-15307; Revised: 02-Jun-2023, Manuscript No. JPPM-21-15307(R); , DOI: 10.35248/2157-7471.23.14.674
Abstract
Rapid evolution and spread of new virulent races of yellow rust results in frequent failure of new varieties released in Ethiopia. Thus, it is inevitable to identify durable sources of resistance for wheat rusts. The study was conducted to identify slow rusting resistance to yellow rust among thirty bread wheat genotypes and to understand the association of slow rusting characters with grain yield at Sinana and Agarfa, Southeastern Ethiopia, during 2017 cropping season. The experiment was laid out in alpha lattice design with three replications. Susceptible varieties PBW 343, Morocco and Digalu were planted around experimental blocks to enhance natural infection. Disease parameters including Coefficient of Infection (CI), Final Rust Severity (FRS), Area Under Diseases Progress Curve (AUDPC) and infection rate (r-value) were used to identify slow rusting resistance. Analysis of variance revealed highly significant (P<0.01) difference among genotypes for all disease parameters at both locations. Genotype × environment interaction also showed significant differences for disease parameters. Based on CI, FRS and AUDPC values, bread wheat genotypes ETBW 8064, ETBW 8451, Kingbird, ETBW 8342, ETBW 8065, ETBW 8348, ETBW 8206, ETBW 8292, ETBW 8359 and ETBW 8290 grouped under high slow rusting resistance; genotypes ETBW 8163, ETBW 8070 and Pavov-76 grouped as susceptible at both locations. Genotypic and phenotypic correlation indicated CI, FRS and rvalue had negative and highly significant association with grain yield. Studied genotypes had wide variability for yellow rust regarding from complete resistance to susceptible. Therefore, best genotypes with durable slow rusting resistance can be used to transfer resistance genes to high yielding cultivars in wheat improvement programs.
Keywords
Coefficient of infection; Final rust severity; Slow rusting; Yellow rust
Introduction
Wheat yellow rust is a foliar disease of major economic importance on wheat production and can causes major losses of wheat yield. The disease is most common in cooler wheat growing regions. Losses of up to 100% have been recorded when the initial infection occurred in very early cropping season particularly on susceptible wheat varieties. Early attack leads to the occurrence of underdeveloped wheat plants and grain losses are attributed to damaged tillers and shriveled grains [1].
In Ethiopia repeated rust epidemics have occurred in the last three decades. The first yellow rust epidemics occurred in 1977 on wheat variety Laketch. In 1988, another yellow rust epidemic noted on wheat variety, Dashen, which carried Yr9 gene. In 2010, a devastating yellow rust epidemic affected widely grown Kubsa and Galema, bread wheat varieties and the Yr27-virulent strain have been attributed to be a major cause of this epidemic. Another new race was detected in Ethiopia in 2016, after being first detected in Afghanistan in 2012 and 2013 on resistance gene PstS11. The race was prevalent as epidemics in countries where a series of varieties became severely affected by yellow rust, which demands for serious monitoring and management schemes [2].
Management of yellow rust including cultural practices, application of fungicides and breeding for host resistance are the major control options. The use of fungicides in Ethiopia is limited by the fact that most wheat farmers are small holders who are resource poor and cannot afford chemicals. In addition, the chemical fungicides are environmentally unsafe. An effective deployment of resistance genes for the management of yellow rust in wheat requires knowledge about the resistance status and the diversity of resistance genes in cultivars under consideration. Moreover, knowledge on the prevailing pathogen races is also crucial as pathogens evolve their virulence frequently, thereby compromising the durability of resistance [3].
Slow rusting wheat cultivar, as an alternative management option, is the simple solution for rust disease management and thus, replacing susceptible cultivars with slow rusting is important in resistance diversity. For such rapid evolution and spread of new virulent races of yellow rust and frequent failure of new varieties with major gene resistance in bread wheat improvement programs require to identify durable sources of resistance [4].
Therefore, achievement of slow rust resistance against wheat yellow rust requires constant characterization and identification for deployment of new resistant genotypes that resist the prevailing virulent races. Hence, this study was designed to screen advanced bread wheat genotypes with slow yellow rusting character under field conditions in Southeastern Ethiopia and identify the association of slow rusting characters with grain yield [5].
Methods and Materials
Description of experimental sites
The experiment was conducted at Sinana Agricultural Research Centre (SARC) and Agarfa district in 2017 main cropping season. SARC is located at 07°07′N latitude and 40°10′ E longitude at 2400 meter above sea level (m.a.s.l). The area is characterized by bimodal rainfall pattern and received annual total rainfall ranging from 750 nm to 1400 mm. The main season extends from August to December that received 270 mm to 842 mm rainfall, while the short season is from March to June and received 250 mm to 562 mm rainfall annually. Mean annual minimum and maximum temperatures were 9.6°C and 20.7°C, respectively. Agarfa district is located at 07°26′ N latitude and 39°87′ E longitude with an elevation of 2510 m.a.s.l. Its total annual rainfall ranges from 1000 mm to 1451 mm. The mean annual minimum and maximum temperatures were 7.3°C and 22.8°C, respectively [6].
Experimental materials and procedures
The experimental materials comprised of thirty bread wheat genotypes including two released varieties viz. Kingbird and Pavon-76 and 28 advanced bread wheat lines. These advanced lines composed of materials introduced from CIMMYT, ICARDA and advanced genotypes developed from local crosses (Table 1). The experiment was laid out in alpha lattice design with three replications having a plot size of six rows of 0.2 m spacing and 2.5 m length. Four central rows were harvested for grain yield computations.
Mixture of universal susceptible bread wheat varieties including PBW 343, Morocco and Digalu variety, which are extremely susceptible to yellow rust, were planted around the blocks as spreader rows to ensure uniform spread of inoculum and facilitate natural infection. No artificial inoculation took place as the disease pressure was very high in the cropping season. Seed rate of 150 kg ha-1 and fertilizer rates of 41/46 N/ P2O5 were used. Weed was controlled using hand weeding as well as by using herbicide called Pallas 45OD (Pyroxsulam Triazolopyrimidine) at a recommended rate of 0.5 l ha-1 at a stage of 21 days after planting [7].
| S/N | Genotype | Pedigree | Selection history | Origina |
|---|---|---|---|---|
| 1 | ETBW 8252 | SW895124*2/FASAN/3/ALTAR84/AESQ//2*OPATA/4/ARREHANE | CMSA05Y01220T-040M-040ZTP0Y-040ZTM-040SY-9ZTM-01Y-0B | CIMMYT |
| 2 | ETBW 8064 | Line 1 Singh/ETBW4919 | KU07-01-0KU-0KU-0KU-0BK1-4KU | KARC |
| 3 | ETBW 8065 | Line 1 Singh/ETBW4919 | KU07-01-0KU-0KU-0KU-0BK1-5KU | KARC |
| 4 | ETBW 8066 | Line 1 Singh/ETBW4919 | KU07-01-0KU-0KU-0KU-0BK2-1KU | KARC |
| 5 | ETBW 8070 | Line 1 Singh/ETBW4919 | KU07-01-0KU-0KU-0KU-0BK2-22KU | KARC |
| 6 | ETBW 8145 | OPATA/RAYON//KAUZ/3/MILAN/DUCULA | - | ICARDA |
| 7 | ETBW 8163 | SUDAN#3/SHUHA-6//FLAG-5 | ICW07-0774-0AP-0AP-0AP-05KUL | ICARDA |
| 8 | ETBW 8290 | KACHU/KINDE | CMSS07B00101S-099M-099NJ-099NJ-10WGY-0B | CIMMYT |
| 9 | ETBW 8310 | ND643/2*WBLL1//ATTILA*2/PBW65/3/MUNAL | CMSS07B00807T-099TOPY-099M-099NJ-099NJ-1WGY-0B | CIMMYT |
| 10 | ETBW 8336 | PFAU/MILAN//ETBW 4921 | - | ICARDA |
| 11 | ETBW 8342 | N-AZRAQ-3/ETBW 4921 | - | ICARDA |
| 12 | ETBW 8348 | CMH82A1294/2*KAUZ//MUNIA/CHTO/3/MILAN/4/AMIR-2 | - | CIMMYT |
| 13 | ETBW 8253 | SOKOLL*2/ROLF07 | CMSA05Y01226T-040M-040ZTP0Y-040ZTM-040SY-17ZTM-03Y-0B | CIMMYT |
| 14 | ETBW 8265 | FRANCOLIN #1/4/2*BABAX/LR42//BABAX*2/3/KURUKU | CMSS07Y00670T-099TOPM-099Y-099M-099Y-21M-0RGY | CIMMYT |
| 15 | ETBW 8280 | SNLG/3/EMB16/CBRD//CBRD/4/KA/NAC//TRCH | CMSA08Y00061T-079(1A1RSR26)B-050 ZTY-026(1A1RSR26)ZTM-03Y-03B-0Y | CIMMYT |
| 16 | ETBW 8283 | KA/NAC//TRCH/3/DANPHE #1 | CMSA07M00445S-040M-0NJ-0NJ-9Y-0B | CIMMYT |
| 17 | ETBW 8287 | CNO79//PF70354/MUS/3/PASTOR/4/BAV92*2/5/HAR311 | CMSS06Y00706T-099TOPM-099Y-099ZTM-099NJ-099NJ-41WGY-0B | CIMMYT |
| 18 | ETBW 8292 | KACHU/KIRITATI | CMSS07Y00127S-0B-099Y-099M-099Y-4M-0WGY | CIMMYT |
| 19 | ETBW 8359 | ALMAZ-11/3/PASTOR/FLORKWA-1//PASTOR | - | ICARDA |
| 20 | ETBW 8362 | JAWAHIR-2//MILAN/DUCULA | - | CIMMYT |
| 21 | ETBW 8309 | SUP152*2/KIRITATI | CMSS07B00612T-099TOPY-099M-099Y-099M-1WGY-0B | CIMMYT |
| 22 | ETBW 8206 | FARIS-17//PFAU/MILAN | F5-MR-TA 2011-12 | ICARDA |
| 23 | ETBW 8304 | FRNCLN/4/WHEAR/KUKUNA/3/C80.1/3*BATAVIA//2*WBLL1 | - | ICARDA |
| 24 | ETBW 8338 | HUBARA-5/ETBW 4922 | - | ICARDA |
| 25 | ETBW 8411 | CHAM-4/MUBASHIIR-9 | ICW06-00411-1AP-0AP -03 SD | CIMMYT |
| 26 | ETBW 8445 | HAAMA-16/MILAN | ICW03-0097-2AP/0TS-0AP-0AP-4AP-0AP-0DZ/0AP | CIMMYT |
| 27 | ETBW 8441 | TURACO/CHIL/6/SERI82/5/ALD’S/4/BB/GLL/CNO67/7C/3/KUZ/TI | - | ICARDA |
| 28 | ETBW 8451 | FLAG-6/ICARDA-SRRL-6 | - | ICARDA |
| 29 | Kingbird | THELIN # 2/TUKURU | - | KARC |
| 30 | Pavon 76 | VCM/CNO/7C/3/KAL/BB | CM8399-D-4M-3Y-1M-1Y-1M-0Y-0ETA | KARC |
Note: aKARC=Kulumsa Agricultural Research Center; CIMMYT=International Maize and Wheat Improvement Center and ICARDA=International Center for Agricultural Research in the Dry Areas
Table 1: List of bread wheat genotypes along with their respective pedigrees, selection history and origin used in the experiment at Sinana and Agarfa, Southeastern Ethiopia during the 2017 main cropping season.
Disease assessment
Slow rusting of bread wheat genotypes for yellow rust resistance was assessed through Final Rust Severity (FRS), Coefficient of Infection (CI), Area Under Disease Progress Curve (AUDPC) and infection rate (r-value). Yellow rust severity was assessed at seven days interval by estimating the approximate percentage of leaf area damaged using modified Cobb’s 0%-100% scale; where, 0% is considered immune while, 100% is completely susceptible to yellow rust. The assessment was made on all tillers of ten randomly selected and pre-tagged plants of four central rows per plot [8]. Coefficient of infection was calculated based on data of the average 10 plants for each experimental unit multiplying the percentage severity (0%-100%) with constant values for host response. The host responses were scored as immune=0.0, R (Resistant)=0.2, MR (Moderately Resistant)=0.4, MS (Moderately Susceptible)=0.8 and S (Susceptible)=1.0.
Area Under Disease Progress Curve (AUDPC) was computed using the formula suggested by Campbell and Madden:

Where, xi=The average severity of ith assessment, xi+1=The average severity of i+1th assessment and ti+1-ti=Number of days between the ith and i+1th assessment, and n=number of observations.
Final Rust Severity (FRS) is the last disease severity score in modified Cobb’s scale percentage severity (0%-100%) multiplied with a constant value for the host response [9]. Apparent infection rate (r-value) was estimated in terms of disease severities recorded in different times using the Logistic model. The r-value per time unit (t) for each line was calculated as the slope of the regression equation of ln [y/(100-y)] versus t, where y is average severity scored against time in days. Moreover, relative Area Under Disease Progress Curve (rAUDPC) was calculated using the following formula relative to the total AUDPC values determined for the susceptible genotype:

Data analysis
All measured disease parameters (CI, FRS, AUDPC, r-value and rAUDPC) were subjected to analysis of variance (ANOVA) following standard procedures using Proc Lattice and Proc GLM of SAS version 9.2 statistical software to estimate the prevailing variation among tested genotypes. Mean separation was carried out using Duncan’s Multiple Range Test (DMRT) at 5% level of significance. The structure of ANOVA for alpha lattice design was presented in Table 2. Disease parameters were homogenized using logarithmic transformation (log x+5) to calculate coefficient of variation [10].
| Source of variation | Degrees of freedom | Sum of squares | Mean squares |
|---|---|---|---|
| Replication | r-1 | SSr | MSr |
| Blocks (within replications, ignoring the genotypes) | r(b-1) | SSb | MSb |
| Genotype (adjusted for blocks) | g-1 | SSg | MSg |
| Error | rg-rb-g+1 | SSe | MSe |
| Total | rg-1 | SST | - |
Table 2: Structure of ANOVA table for analysis of alpha lattice design.
Estimation of phenotypic and genotypic correlations
The simple correlation coefficients were partitioned to genotypic and phenotypic components. Phenotypic and genotypic correlation coefficients were estimated using the formulae of AL-Jibouri et al.
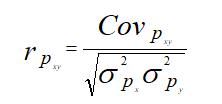
Where,
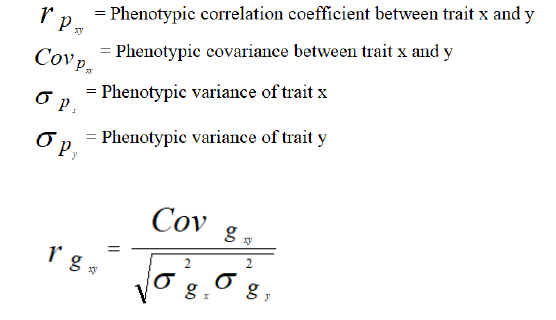
Where,
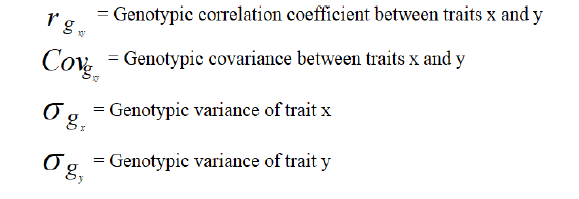
The coefficient of correlations at genotypic level was tested for their significance using the formula described by Robertson.
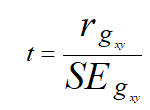
The calculated value was compared with the tabulated value at g-2 degree of freedom at 5% level of significance, where, g=number of lines.

Where,
Hx=Heritability of the trait x
Hy=Heritability of the trait y
Results and Discussion
Analysis of variance
Test for homogeneity of error variance showed that the error mean squares were homogeneous for CI-1, CI-3, FRS, infection rate (r-value), AUDPC and rAUDPC. Hence, combined data analysis was done for such disease characters. Combined ANOVA across locations were carried out for all disease parameters (Table 3). There was a highly significant (P<0.01) difference for all traits among the test genotypes. This could indicate the presence of sufficient genetic variability for level of resistance/susceptibility among the genotypes tested. Similar research reports confirmed the presence of significant difference among wheat genotypes for yellow rust resistance based on slow rusting parameters.
The genotype x environment interaction for yellow rust showed highly significant (P<0.01) differences among wheat genotypes for FRS, r-value, AUDPC and rAUDPC. Significant (P<0.05) genotypic x environment interaction was also found for CI-1 and CI-3 (Table 3), which could imply that genotypes responded differently to varying environments for disease parameters [12]. This suggested the importance of assessing genotypes under different environments in order to identify better performing genotypes and analysis was done for individual locations [11].
| Charactersa | Source of variationb | Mean | CV | |||||
|---|---|---|---|---|---|---|---|---|
| Loc | Rep (Loc) | Block (Loc × rep) | Genotype | Genotype × Loc | Error | |||
| CI-1 | 3.6ns | 3.4ns | 5.8* | 120.0** | 6.6* | 3.5 | 2.7 | 7.8 (69.7) |
| CI-3 | 131.1* | 36.1ns | 44.1ns | 991.4** | 55.9* | 29 | 8.4 | 10.9 (64.5) |
| FRS | 315.9** | 10.68ns | 31.3ns | 1822.6** | 122.9** | 21.6 | 12.1 | 11.4 (38.5) |
| r-value | 0.0003ns | 0.001ns | 0.001ns | 0.01** | 0.0009** | 0.001 | 0.05 | 0.4 (74.2) |
| AUDPC | 7741.3ns | 5302.6ns | 8550.6* | 302841.7** | 13961.8** | 4779.3 | 149.2 | 15.9 (46.4) |
| rAUDPC | 9.8ns | 52.8ns | 98.5* | 3335.4** | 140.5** | 54.6 | 15. 7 | 11.7 (47.1) |
Note: aCI-1 and 3=Coefficient of Infection at 1st and 3rd assessment; FRS=Final Rust Severity; r-value=infection rate of disease development; AUDPC=Area Under Disease Progress Curve and rAUDPC=relative Area Under Disease Progress Curve; bLoc=Location; Rep=Replication; **=highly significant at P<0.01; *=significant at P<0.05; ns=no significant difference and numbers in square bracket indicates degree of freedom; CV=Coefficient of Variation with log transformed data; number in bracket under CV indicates raw coefficient of variation
Table 3: Combined analysis of disease parameters in bread wheat genotypes tested at Sinana and Agarfa, Southeastern Ethiopia during the 2017 cropping season.
Mean performance of disease parameters
Final rust severity: The range and mean values for six disease characters of 30 bread wheat genotypes evaluated at Sinana and Agarfa are presented in Table 4. Final rust severity showed highly significant variation among genotypes at both experimental sites. At Sinana FRS mean score ranged from 0% to 71.3% with mean score of 13.4%. Also, FRS ranged from 0%-69.3% with mean score of 10.8% at Agarfa. A high mean disease pressure recorded at both testing sites for genotype ETBW 8163, followed by Pavon-76 and ETBW 8070. Based on FRS values, the tested genotypes were grouped into three categories in which those genotypes with FRS values of 1%-30%, 31%-50% and 51%-70% as high slow rusting resistance, moderate slow rusting resistance and susceptible, respectively. In this regard, twenty one and twenty five genotypes were included in high slow rust resistance group Sinana and Agarfa, respectively [12]. Two tested genotypes (ETBW 8163 and Pavon-76) were grouped in low level of slow rusting resistance category (Table 4).
Coefficient of infection: The result showed wide variation for coefficient of infection. First coefficient of infection (CI-1) ranged from 0% to 24.3% and 0%-22.0% at Sinana and Agarfa, respectively. The highest (24.3%) CI-1 value was recorded for genotype ETBW 8163, followed by genotype ETBW 8070 (15.0%) and genotype Pavon-76 (7.7%) at Sinana. At Agarfa, the same genotypes ranked on top three. Similarly, genotypes ETBW 8163, Pavon-76 and ETBW 8070 had high CI-3 at both Sinana and Agarfa (Table 4). Based on CI values, Ali et al. and Safavi and Afshari grouped wheat genotypes as having high slow rusting resistance (0%-20% CI), moderate slow rusting resistance (21%-40% CI) and susceptible (41%-60% CI).
Accordingly, 21 genotypes were grouped into high slow rusting resistance among 30 genotypes evaluated at Sinana (Table 4). Three genotypes, ETBW 8163, Pavon-76 and ETBW 8070, were identified to have no slow rusting resistance to yellow rust in same location. Similarly, 24 genotypes were clustered under high slow rusting resistance category at Agarfa. Genotypes ETBW 8163 and Pavon-76 showed susceptible reaction and the rest genotypes (ETBW 8280 and ETBW 8411) observed to have zero CI values and grouped under immune class (Table 4).
Area under disease progress curve and relative Area Under Disease Progress Curve (rAUDPC): At Sinana, the highest (1009%-days) AUDPC recorded for genotypes ETBW 8163, followed by genotypes ETBW 8070 (888.3%-days) and Pavon-76 (616.5%-days) (Table 4). Similarly, at Agarfa, genotypes ETBW 8163, Pavon-76 and ETBW 8070 showed high AUDPC values of 896.5, 891.1 and 460.0%-days, respectively. A similar trend was also traced for rAUDPC values at both locations. According to Ali et al., Hei et al. and Safavi and Afshari, cultivars were categorized into two distinct groups based on rAUDPC values. The first group included genotypes exhibiting rAUDPC values less than 30% with the ratio of the most susceptible genotype (ETBW 8163), while genotypes showing rAUDPC values 30% to 70% were categorized in the second group. In such categories, five (Sinana) and seven (Agarfa) genotypes were in the second category [13]. Whereas, 25 and 23 genotypes were grouped under the first category at Sinana and Agarfa testing sites, respectively (Table 4).
Infection rate (r-value): Apparent infection rate computed for genotypes revealed that yellow rust progressed rapidly at 0.16 units day-1 for ETBW 8348, followed by Pavon-76 (0.14 units day-1) and ETBW 8309 (0.13 units day-1) at Sinana. At Agarfa, genotypes ETBW 8290, ETBW 8348 and ETBW 8362 showed the highest r-value of 0.12 units day-1 (Table 4).
Similar to the findings of Ali et al., Safavi and Safavi and Afshari, the present study also demonstrated that infection rate seemed an unreliable parameter for estimation of slow rust resistance when compared to CI, AUDPC and FRS. This is because r-value could not identify different levels of slow rusting resistance among some of the genotypes evaluated as equivalent as other parameters. For instance, the present study identified that genotypes with better level of slow rusting resistance (having CI=0-20 and FRS=1-30) had high infection rate. In this study, based on CI, FRS, AUDPC and rAUDPC values, genotypes ETBW 8064, ETBW 8451, Kingbird, ETBW 8342, ETBW 8065, ETBW 8348, ETBW 8206, ETBW 8292, ETBW 8359 and ETBW 8290 were grouped under high slow rusting resistance (Table 4).
Genotypic and phenotypic correlation coefficients
Genotypic correlation coefficients of grain yield with yellow rust: Results of genotypic correlation coefficients at Sinana and Agarfa are presented in Tables 5 and 6. Grain yield had negative high significant (P<0.01) genotypic correlation coefficient with all yellow rust disease parameters with values ranging from infection rate (-0.680) to AUDPC (-0.930) at Sinana (Tables 5). This indicates that genotypes with high CI-1, CI-3, FRS, AUDPC and r-value would result in reduced grain yield. At Agarfa, high negative genotypic correlation coefficient was observed for grain yield and disease parameters including FRS (-0.74), AUDPC (-0.73) CI-3 (-0.73) CI-2 (-0.72), CI-1 (-0.68) and r-value (-0.54) (Table 6). Hence, selection of genotypes against these parameters may have significant role in yield improvement and for recurrent rust epidemics [14]. Likewise, Safavi and Safavi and Afshari also found high negative correlation coefficient between CI, FRS, AUDPC and r-value with grain yield.
Phenotypic correlation coefficients of grain yield with yellow rust: Result of correlation analysis showed that grain yield had negative and highly significant association with disease parameters ranging from r-value (-0.59) to AUDPC (-0.89) at Sinana (Table 5). Similarly, at Agarfa, grain yield also obtained a negative and highly significant phenotypic correlation with all yellow rust disease parameters studied ranging from r-value (-0.48) to FRS (-0.70) (Table 6). This implies that an average increase in susceptibility, indicated by higher CI-1, CI-2, CI-3, FRS, AUDPC, r-value or rAUDPC, would result in a decreasing pattern in grain yield or vice versa, considering other factors being constant [15]. Findings of this study, which stated that highly negative correlation coefficient of grain yield with slow rusting disease parameters is in agreement with the results of Dereje and Chemeda and other research works.
| Genotypes | Sinanaa | Agarfaa | ||||||||||
|---|---|---|---|---|---|---|---|---|---|---|---|---|
| CI-1 | CI-3 | FRS | AUDPC | r-value | rAUDPC | CI-1 | CI-3 | FRS | AUDPC | r-value | rAUDPC | |
| ETBW 8280 | 0.1g | 0.08e | 0.1h | 2.1h | -0.0001g-j | 0.21h | 0f | 0g | 0i | 0g | 0g-i | 0g |
| ETBW 8310 | 0.003 g | 0.03e | 0.03h | 0.7h | 0.03e-j | 0.07h | 0.1f | 0.03 g | 0.1i | 1.0 g | 0.01f-i | 0.1g |
| ETBW 8064 | 4.3ef | 11.1de | 18.8d | 200.9e | 0.08b-f | 19.9e | 5.8cd | 14.5c-e | 21.8de | 310.2cd | 0.08a-e | 34.6cd |
| ETBW 8252 | 0 g | 0 e | 0h | 0h | 0g-j | 0h | 0.1f | 0.1g | 0.1i | 0.7 g | 0.001f-i | 0.1 g |
| ETBW 8163 | 24.3a | 54.9a | 71.3a | 1009a | 0.1a-e | 100a | 22a | 46.7a | 69.3a | 896.5a | 0.1a-c | 100a |
| ETBW 8451 | 2.3fg | 9.9de | 10.6d-g | 166.6ef | 0.06c-h | 16.5ef | 1.7 ef | 5.6e-g | 9.0f-h | 123.0e-g | 0.09a-d | 13.7e-g |
| ETBW 8309 | 4.6ef | 32.7c | 43.7c | 452.9d | 0.14ab | 44.9d | 3.4d-f | 20.6bc | 27.5cd | 365.2bc | 0.13a | 40.7bc |
| Kingbird | 1.6fg | 7.4de | 13.9d | 136.6e-g | 0.1a-c | 13.5e-g | 3.3d-f | 17.8b-d | 29.7cd | 311.0cd | 0.12ab | 34.7cd |
| ETBW 8362 | 9.6c | 32c | 62.7b | 560.5c | 0.14ab | 55.6c | 2.1ef | 16.2b-d | 22.3de | 280.2cd | 0.13a | 31.3cd |
| ETBW 8336 | 0g | 0 e | 0h | 0h | 0g-h | 0h | 0.2f | 0.2g | 0.2i | 4.1g | -0.006g-i | 0.5g |
| ETBW 8253 | 0.1g | 0.05e | 0.05h | 1.4h | 0.02f-j | 0.14h | 0.2f | 0.2 g | 0.2 i | 2.4 g | -0.01hi | 0.3g |
| ETBW 8265 | 0.01g | 0.03e | 0.03h | 0.5 h | 0.01f-j | 0.05h | 0.1f | 0.1 g | 0.03 i | 0.7 g | -0.02i | 0.1g |
| ETBW 8287 | 0.1g | 0.05e | 0.05h | 1.7h | -0.01h-j | 0.17h | 0.03f | 0.03 g | 0.1i | 0.8g | 0.01f-i | 0.1g |
| ETBW 8342 | 0.3g | 1.3e | 3.2f-h | 27.0gh | 0.07d-g | 2.7gh | 0.2f | 0.7g | 1.1ih | 16.4 g | 0.05c-h | 1.8g |
| ETBW 8445 | 0.07g | 0.03e | 0.03h | 0.5h | -0.02h-j | 0.05h | 0.1f | 0.1g | 0.1i | 1.1g | 0.001f-i | 0.1g |
| ETBW 8065 | 6.0de | 12.9d | 16.8de | 233.2e | 0.06c-i | 23.1e | 6. 7cd | 10.8d-f | 16.9ef | 231.4c-e | 0.06c-g | 25.8c-e |
| ETBW 8348 | 0.4g | 1.8e | 9.99e-g | 63. 6f-h | 0.16a | 6.3f-h | 0.6ef | 3.4fg | 8.5g-i | 70.2fg | 0.13a | 7.8fg |
| ETBW 8145 | 0.4g | 0.3e | 0.3h | 7.4h | -0.02ij | 0.7h | 0.2f | 0.2g | 0.2i | 4g | 0.01f-i | 0.5g |
| Pavon-76 | 7.7cd | 43.2b | 62.7b | 616.5c | 0.14ab | 61.1c | 14.7b | 46. 7a | 58b | 891.1a | 0.1a-c | 99.4a |
| ETBW 8206 | 0.5 g | 0.6e | 0.6h | 12.9 h | 0.01h-j | 1.3h | 1.5ef | 1.9fg | 1.7hi | 36.1fg | -0.01g-i | 4.0fg |
| ETBW 8411 | 0g | 0e | 0h | 0h | 0h-j | 0h | 0f | 0g | 0 i | 0g | 0g-i | 0g |
| ETBW 8292 | 0.6g | 1.3e | 2.5gh | 29.2gh | 0.06c-i | 2. 9gh | 0.3f | 0.3g | 0.3 i | 6.1g | 0.001f-i | 0.7g |
| ETBW 8066 | 0.1g | 0.1e | 0.1h | 2.3h | -0.004g-j | 0.2h | 0.3f | 0.1g | 0.2 i | 4.0g | -0.01hi | 0.4g |
| ETBW 8359 | 4.5ef | 8.8de | 8.1e-h | 155.8ef | 0.02f-j | 15. 5ef | 4.2de | 9.7d-g | 11.7fg | 172.1d-f | 0.06b-f | 19.2d-f |
| ETBW 8070 | 15b | 53a | 64.7ab | 888.3b | 0.12a-c | 88.1b | 8.2e | 24.0b | 34.7c | 460.0b | 0.09a-d | 51.3b |
| ETBW 8283 | 0 g | 0e | 0h | 0h | 0g-j | 0h | 0.1f | 0.03 g | 0.1i | 0.6g | 0.001f-i | 0.1g |
| ETBW 8290 | 1.4fg | 4.0de | 11.8d-f | 89.1f-h | 0.11a-d | 8.8f-h | 0.2f | 5.1fg | 9.3f-h | 81.5fg | 0.13a | 9.1fg |
| ETBW 8441 | 0.2g | 0.3e | 0.3h | 4.3h | 0.04d-j | 0.4h | 0.01f | 0.03g | 0.1i | 0.8g | 0.02e-i | 0.1g |
| ETBW 8304 | 0.2g | 0.2e | 0.3h | 4.3h | 0.01f-j | 0.4h | 0.1f | 0.1g | 0.2i | 3.0g | 0.04d-i | 0. 4g |
| ETBW 8338 | 0.3g | 0.2e | 0.2h | 4.8h | -0.02j | 0.5h | 0.2f | 0.2g | 0.2i | 3.7g | 0.01f-i | 0.4g |
| Mean | 2.8 | 9.2 | 13.4 | 155.7 | 0.047 | 15.4 | 2.5 | 7.5 | 10.8 | 142.6 | 0.044 | 15.9 |
| CV | 6.3 | 10.7 | 11.2 | 16.4 | 0.43 | 10.7 | 9.2 | 11.2 | 11.6 | 15.4 | 0.39 | 12.6 |
Note: aCI-1, 2, and 3=Coefficient of Infection at 1st, 2nd, 3rd assessments; FRS=Final Rust Severity; r-value=rate of disease development; AUDPC=Area Under Disease Progress Curve and rAUDPC=relative Area Under Disease Progress Curve
Table 4: Mean performance of bread wheat genotypes for disease parameters at Sinana and Agarfa, Southeastern Ethiopia, 2017.
| Variablea | GY | Tkw | CI-1 | CI-2 | CI-3 | FRS | AUDPC | r-value |
|---|---|---|---|---|---|---|---|---|
| GY | 1 | 0.79** | -0.90** | -0.86** | -0.92** | -0.92** | -0.93** | -0.68** |
| Tkw | 0.74** | 1 | -0.80** | -0.77** | -0.75** | -0.77** | -0.79** | -0.63** |
| CI-1 | -0.84** | -0.72** | 1 | 0.98** | 0.92** | 0.89** | 0.96** | 0.53** |
| CI-2 | -0.82** | -0.71** | 0.94** | 1 | 0.90** | 0.85** | 0.94** | 0.51** |
| CI-3 | -0.86** | -0.68** | 0.88** | 0.88** | 1 | 0.98** | 0.99** | 0.67** |
| FRS | -0.88** | -0.73** | 0.85** | 0.84** | 0.95** | 1 | 0.98** | 0.74** |
| AUDPC | -0.89** | -0.73** | 0.93** | 0.93** | 0.99** | 0.97** | 1 | 0.66** |
| r-value | -0.59** | -0.57** | 0.42** | 0.46** | 0.59** | 0.69** | 0.60** | 1 |
Table 5: Genotypic (above diagonal) and phenotypic (below diagonal) correlation coefficients among yield and yellow rust disease parameters at Sinana, during 2017 main cropping season.
| Variable | GY | Tkw | CI-1 | CI-2 | CI-3 | FRS | AUDPC | r-value |
|---|---|---|---|---|---|---|---|---|
| GY | 1 | 0.74** | -0.68** | -0.72** | -0.73** | -0.74** | -0.73** | -0.54** |
| Tkw | 0.65** | 1 | -0.75** | -0.77** | -0.80** | -0.82** | -0.80** | -0.68** |
| CI-1 | -0.62** | -0.66** | 1 | 0.93** | 0.94** | 0.94** | 0.95** | 0.48** |
| CI-2 | -0.66** | -0.67** | 0.92** | 1 | 0.99** | 0.97** | 0.99** | 0.60** |
| CI-3 | -0.66** | -0.66** | 0.91** | 0.96** | 1 | 0.99** | 0.99** | 0.65** |
| FRS | -0.70** | -0.74** | 0.91** | 0.95** | 0.97** | 1 | 0.99** | 0.68** |
| AUDPC | -0.68** | -0.69** | 0.93** | 0.98** | 0.99** | 0.99** | 1 | 0.64** |
| r-value | -0.48** | -0.55** | 0.35** | 0.49** | 0.55** | 0.60** | 0.54** | 1 |
Note: GY=Grain Yield; CI-1, 2 and 3=1st, 2nd, 3rd coefficient of infection; FRS=Final Rust Severity; AUDPC=Areas Under Disease Progress Curve and r-value=infection rate; **=highly significant association at P<0.01 and *=significant association at P<0.05
Table 6: Genotypic (above diagonal) and phenotypic (below diagonal) correlation coefficients among yield and yellow rust disease parameters at Agarfa, during 2017 main cropping season.
Conclusion
The results indicated that studied bread wheat genotypes showed wide variability regarding slow rusting resistance ranging from complete resistance to susceptible under high disease pressure. Results also confirmed that CI, FRS and AUDPC yellow rust parameters are reliable to assess slow yellow rust resistance among bread wheat genotypes. Based on CI, FRS, AUDPC and r-values, genotypes ETBW 8064, ETBW 8451, Kingbird, ETBW 8342, ETBW 8065, ETBW 8348, ETBW 8206, ETBW 8292, ETBW 8359 and ETBW 8290 grouped under high slow rusting resistance. At both locations, grain yield had negative and highly significant association with CI-1, CI-2, CI-3, FRS, AUDPC and r-value. Thus, the genotypes listed above can be used in future wheat breeding programs to improve existing cultivars with durable slow rusting resistance to yellow rust and high grain yield through transferring genes responsible for the resistance to high yielding cultivars. However, stability evaluation across many contrasting locations and years has to be made along with other desirable traits before preceding the improvement program.
Acknowledgment
The study was financed by Oromia agricultural growth program II and Oromia agricultural research institute, Ethiopia. The authors are very grateful to individuals who participated in facilitating the field management, data collection and analysis.
References
- Ahmad S, Afzal M, Noorka IR, Iqbal Z, Akhtar N, Iftkhar Y, et al. Prediction of yield losses in wheat (Triticum aestivum L.) caused by yellow rust in relation to epidemiological factors in Faisalabad. Pak J Bot. 2010;42(1):401-407.
- Ali S, Shah SJ, Ibrahim M. Assessment of wheat breeding lines for slow yellow rusting (Puccinia striiformis West. tritici). Pak J Biol Sci. 2007;10(19):3440-3444.
[Crossref] [Google Scholar] [PubMed]
- Ali S, Shah SJ, Maqbool K. Field-based assessment of partial resistance to yellow rust in wheat germplasm. J Agric Rur Devel. 2008;6(1):99-106.
- Ali S, Shah SJ, Raman IK, Maqbool K, Ullah W. Partial resistance to yellow rust in introduced winter wheat germplasm at the north of Pakistan. Austr J Crop Sci. 2009;3(1):37.
- Bishaw Z, Struik PC, van Gastel AG. Wheat seed system in Ethiopia: Farmers' varietal perception, seed sources and seed management. J New Seeds. 2010;11(4):281-327.
- Broers LH, Cuesta Subias X, Lopez Atilano RM. Field assessment of quantitative resistance to yellow rust in ten spring bread wheat cultivars. Euphytica. 1996;90:9-16.
- Bux H, Ashraf M, Hussain F, Rattu AU, Fayyaz M. Characterization of wheat germplasm for stripe rust (Puccini striiformis f.sp. tritici) resistance. Austr J Crop Sci. 2012;6(1):116-120.
- Chen XM. Epidemiology and control of stripe rust (Puccinia striiformis f.sp. tritici) on wheat. Canadian J Plant Pathol. 2005;27(3):314-337.
- Hei N, Shimelis HA, Laing M, Admassu B. Assessment of Ethiopian wheat lines for slow rusting resistance to stem rust of wheat caused by Puccinia graminis f.sp. tritici. J Phytopathol. 2015;163(5):353-363.
- Hovmoller MS, Walter S, Bayles RA, Hubbard A, Flath K, Sommerfeldt N, et al. Replacement of the European wheat yellow rust population by new races from the centre of diversity in the near‐Himalayan region. Plant Pathol. 2016;65(3):402-411.
- Jin Y, Szabo LJ, Pretorius ZA, Singh RP, Ward R, Fetch Jr T. Detection of virulence to resistance gene Sr24 within race TTKS of Puccinia graminis f.sp. tritici. Plant Dis. 2008;92(6):923-926.
[Crossref] [Google Scholar] [PubMed]
- Jin Y, Szabo LJ, Rouse MN, Fetch Jr T, Pretorius ZA, Wanyera R, et al. Detection of virulence to resistance gene Sr36 within the TTKS race lineage of Puccinia graminis f.sp. tritici. Plant Dis. 2009;93(4):367-370.
[Crossref] [Google Scholar] [PubMed]
- McCallum BD, Hiebert CW, Cloutier S, Bakkeren G, Rosa SB, Humphreys DG, et al. A review of wheat leaf rust research and the development of resistant cultivars in Canada. Canad J Plant Pathol. 2016;38(1):1-8.
- Peterson RF, Campbell AB, Hannah AE. A diagrammatic scale for estimating rust intensity on leaves and stems of cereals. Canad J Res. 1948;26(5):496-500.
- Robertson A. The sampling variance of the genetic correlation coefficient. Biometrics. 1959;15(3):469-485.
Citation: Bayisa T, Terefe H, Letta T (2023) Screening of Bread Wheat Genotypes for Slow Rusting Resistance to Yellow Rust (Puccinia striiformis f.sp. tritici) and Association among Parameters in Southeastern Ethiopia. J Plant Pathol Microbiol. 14:674.
Copyright: © 2023 Bayisa T, et al. This is an open-access article distributed under the terms of the Creative Commons Attribution License, which permits unrestricted use, distribution, and reproduction in any medium, provided the original author and source are credited.
