Indexed In
- Open J Gate
- Genamics JournalSeek
- Academic Keys
- JournalTOCs
- The Global Impact Factor (GIF)
- China National Knowledge Infrastructure (CNKI)
- Ulrich's Periodicals Directory
- RefSeek
- Hamdard University
- EBSCO A-Z
- OCLC- WorldCat
- Publons
- Geneva Foundation for Medical Education and Research
- Euro Pub
- Google Scholar
Useful Links
Share This Page
Journal Flyer

Open Access Journals
- Agri and Aquaculture
- Biochemistry
- Bioinformatics & Systems Biology
- Business & Management
- Chemistry
- Clinical Sciences
- Engineering
- Food & Nutrition
- General Science
- Genetics & Molecular Biology
- Immunology & Microbiology
- Medical Sciences
- Neuroscience & Psychology
- Nursing & Health Care
- Pharmaceutical Sciences
Research Article - (2019) Volume 10, Issue 2
Quantitative Estimation of Dapagliflozin in Blood Plasma by Using UV Spectroscopy
Bhagwat J Bodade, Dhiraj A Kanade and Sandip S Chaudhari*Received: 05-Apr-2019 Published: 29-Apr-2019, DOI: 10.35248/2153-2435.19.10.608
Abstract
An accurate, precise and reproducible quantitative estimation of dapagliflozin in blood plasma method were developed. Spectrophotometric estimation was done by absorption method followed by using sample of blood plasma of patient who are given dapagliflozin tablet. In this method λmax for DAPA was selected at 224 nm at concentration range of 20-100 μg/ml for DAPA in UV spectrophotometric method (the value of r2=0.994). The developed methods were validated according to ICH guidelines and values of accuracy, precision and other statistical analysis were found to be in good accordance with the prescribed values. Therefore this method is useful for quantitative estimation of drug and amount of drug absorb in blood plasma.
Keywords
Dapagliflozin; Bioanalytical; Blood plasma; ICH
Introduction
Dapagliflozin is a drug of the Gliflozin class, used for the treat type 2 diabetes. Dapagliflozin tablets are approved as a once-daily oral medication in adult patients with Type 2 diabetes mellitus.
Dapagliflozin inhibits subtype 2 of the Sodium-Glucose Transport Proteins (SGLT2) which are responsible for at least 90% of the glucose reabsorption in the kidney. Blocking this transporter mechanism causes blood glucose to be eliminated through the urine. It was developed by Bristol-Myers Squibb in partnership with AstraZeneca Company [1].
Dapagliflozin is an inhibitor of the Sodium Glucose Co- Transporter-2 (SGLT-2), which is found almost exclusively in the proximal tubules of nephronic components in the kidneys (Figure 1).
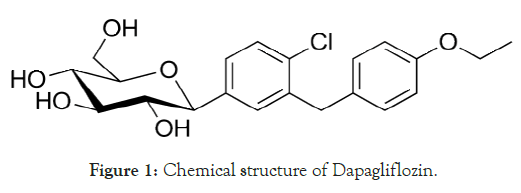
Figure 1. Chemical structure of Dapagliflozin.
Materials and Methods
Chemicals and reagents
Dapagliflozin Tablet (Forxiga) 10 mg was obtained from local pharmacy and gives to patient and after 6 hours collect blood sample for analysis. All chemicals and reagents of analytical grade and were purchased from Merck Chemicals, Mumbai, India
Instrumentation
Samples were analysed on Shimadzu 1800 UV-visible spectrophotometer, equipped with UV spectroscopic detector, with 1 cm quartz cell and slit width 1.0 nm. The solvent was prepared freshly filtered through 0.45 μm membrane filter (Millipore, USA) and Sonicated for 30 min [2].
Preparation of standard stock solutions
A) Collection of blood plasma: Blood sample was transferred into purple top EDTA tubes and centrifuged (2000 rpm) at 4°C for 20 minutes. After centrifugation using clean pipette technique place 1.0 ml of plasma into 1.5 ml eppendorf tube labelled with tracking number and plasma and freeze immediately at –80º freezer [3]. After collecting blood plasma it can considered as working stock solution.
B) Preparation of working standard solution: By using the working standard solution it is further diluted by normal patient’s blood plasma and prepares concentration up to 20, 40, 60, 80 and 100 μg/m for linearity study.
Determination of λmax of tablet
The sample of blood plasma containing dapagliflozin drug solution was scanned separately between 200 nm to 400 nm.
Study of beer-lambert’s law [linearity study]
A) Linearity Study for DAPA: An accurately measured aliquot portion of working standard solution blood plasma in 10 ml volumetric flask [4]. The volume was made up to the mark using blood plasma to obtain concentrations (20-100 μg/ml). Absorbance of this solution was measured at 224 nm, Calibration curve was plotted, absorbance vs. concentration (Table 1 and Figures 2-7).
| Sr. No. | Concentration of DAPA [µg/ml] | Absorbance mean ± S.D. [n=5] | % R.S.D. |
|---|---|---|---|
| 1 | 0 | 0 ± 0 | 0 |
| 2 | 20 | 0.229 ± 0.0015 | 0.152753 |
| 3 | 40 | 0.502 ± 0.0005 | 0.057735 |
| 4 | 60 | 0.636 ± 0.0021 | 0.216025 |
| 5 | 80 | 0.885 ± 0.0014 | 0.141421 |
| 6 | 100 | 1.078 ± 0.0020 | 0.206155 |
Table 1: Linearity study of DAPA at 224 nm.
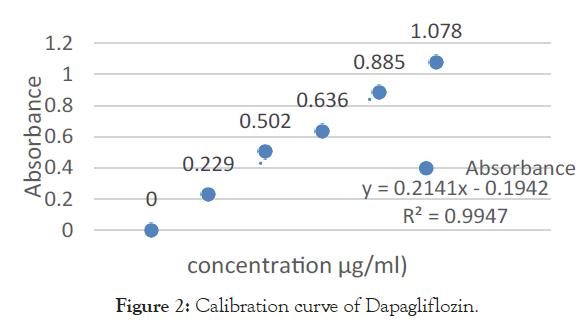
Figure 2. Calibration curve of Dapagliflozin.
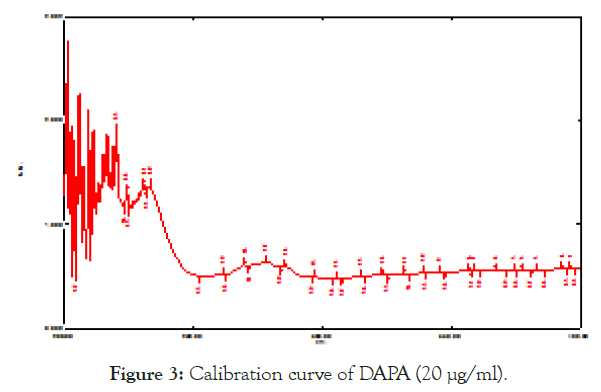
Figure 3. Calibration curve of DAPA (20 μg/ml).
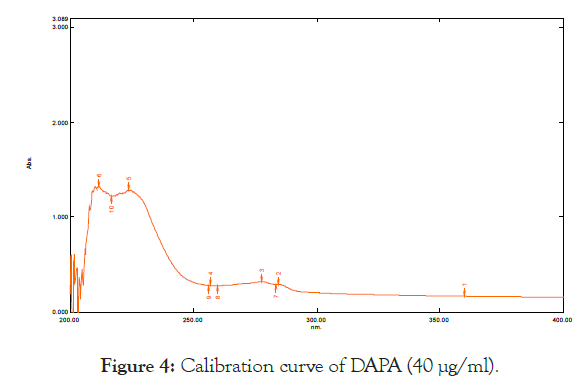
Figure 4. Calibration curve of DAPA (40 μg/ml).
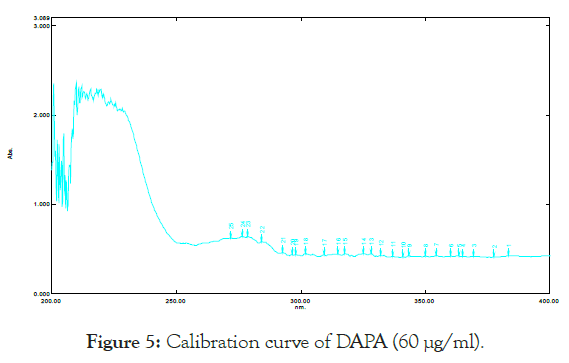
Figure 5. Calibration curve of DAPA (60 μg/ml).
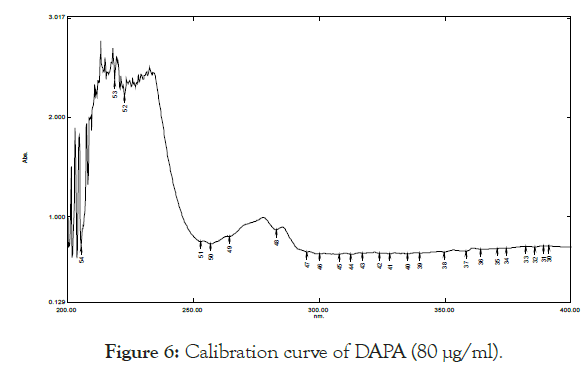
Figure 6. Calibration curve of DAPA (80 μg/ml).
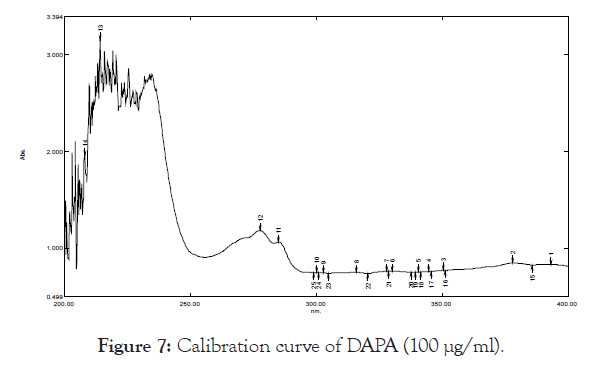
Figure 7. Calibration curve of DAPA (100 μg/ml).
Results
Application of the proposed method for estimation of drug
Absorbance of drug in stock solution can study by amount of drug estimated. The results are reported in the Table 2.
| Sr. No. | Concentration of drug sample | Absorbance of mixture at 224 nm | % of Drug estimated |
|---|---|---|---|
| DAPA | |||
| 1 | 20 | 0.229 | 98.32 |
| 2 | 40 | 0.502 | 98.31 |
| 3 | 60 | 0.636 | 98.33 |
| 4 | 80 | 0.885 | 98.35 |
| 5 | 100 | 1.078 | 98.34 |
| Mean | 98.33 | ||
| SD | 0.015811 | ||
| % RSD | 1.581139 | ||
Table 2: Results of estimation of dapagliflozin in sample.
Validation of proposed method
Validation is normally done to assure the reliability of the proposed method and was performed as per the ICH guide lines for the following criteria [5].
1) Accuracy: Accuracy of method is ascertained by recovery studies performed at different levels of concentrations (80%, 100% and 120%). Mean % recovery were found to be 98.33% for absorption method with % RSD less than 2.
2) Precision: Precision studies were calculated as SD and % RSD. The results within prescribed limit showed that the method was found to be precise and % RSD less than 2.
3) Ruggedness: The method was found to be rugged with no significant changes on test result upon change of analytical conditions like different time (Intraday), different day (Interday) and different analyst [6-8].
4) Linearity and range: The study of linearity and range was performed as per the USP/ICH recommendation. DAPA marketed formulation was found to be linear in the range of 20 to 100 μg/ml, with r2=0.994 for all drugs at selected wavelength for the methods [9,10].
5) LOD: Limit of detection of Dapagliflozin was found to be 1.09743 μg/ml.
6) LOQ: Limit of Quantitation of Dapagliflozin was found to be 0.01233 μg/ml.
Discussion
The management of various diseases and disorders are done by the use of multiple therapeutic agents which acts at different sites. It is necessary to measurement of amount of drug estimate in blood. So that blood plasma of patient given by dapagliflozin tablet is used as sample.
On extensive literature survey it was found that very few quantitative estimation of dapagliflozin by using UV spectroscopy method were used and it seems that this method is accurate, precise and linear.
Conclusions
It was made to develop a quantitative estimation of Dapagliflozin tablet (Forxiga) by using UV Spectroscopy. The developed method was validated for linearity, Accuracy, precision, ruggedness and results were within the limits according to ICH guidelines. The proposed method was cost effective, simple, rapid, economic, cheap, Precise and robust.
Acknowledgments
The author’s were thankful to Principle of KYDSCT’s College of Pharmacy, Sakegaon Bhusawal (MS) INDIA for providing necessary help for work.
REFERENCES
- Willard HH, Merritt LL, Dean JA, Settle FA. Instrumental methods of analysis, (7th Edn.). NewDelhi. 1989;pp:531-530.
- Beckett AH, Stanlake JB. Practical pharmaceutical chemistry, (4th Edn.). Part 2, CBS Publishers and Distributors. 2002;pp:1.
- Skoog DA, West DM, Holler J, Crouch SR. Fundamental of analytical chemistry, (7th Edn.). Saunders College Publishing. 1992;1.
- Gennaro AR. Remington: the science and practice of pharmacy, (19th Edn.). Mack Publishing Company. 1995;pp:534.
- Corners KA. Textbook of pharmaceutical analysis, (3rd Edn.). A Wiley Interscience Publication. 1999;pp:616-622.
- Sharma BK. Instrumental methods of chemical analysis, (16th Edn.). Goel Publishing Housing. 2002;pp:S71.
- ICH–Guidelines Q2B. Validation of Analytical Procedures: Methodology (CPMP/ICH/281/95) Geneva, Switzerland. 1996.
- Swamy Gk, Shruthi S, Rajkumar M, Kumar DS. A new stabilty indicating Rp-Hplc Method for simultaneous determination of saxagliptin and dapagliflozin in bulk and combined tablet dosage forms. Asian J Pharm Anal Med Chem. 2017;5:113-121.
- Patel AB, Patel DR, Shah Z. Development and validation of stability indicating method for the simultaneous estimation of saxagliptin hydrochloride and dapagliflozin using Rp-hplc method in tablet dosage form. World J Pharm Pharm Sci. 2017;6:444-458.
- Kommineni V, Chowdaryand KPR, Prasad SVUM. Development of a new stability indicating Rp-Hplc method for simultaneous estimation of saxagliptin and dapagliflozin and its validation as per ich guidelines. Indo Am J Pharm Pharm Sci. 2017;4:2920.
Citation: Chaudhari SS (2019) Quantitative Estimation of Dapagliflozin in Blood Plasma by Using UV Spectroscopy. J Develop Drugs 10:608.
Copyright: © 2019 Chaudhari SS. This is an open-access article distributed under the terms of the Creative Commons Attribution License, which permits unrestricted use, distribution, and reproduction in any medium, provided the original author and source are credited.


