PMC/PubMed Indexed Articles
Indexed In
- Open J Gate
- Genamics JournalSeek
- JournalTOCs
- Ulrich's Periodicals Directory
- RefSeek
- Hamdard University
- EBSCO A-Z
- OCLC- WorldCat
- Publons
- Geneva Foundation for Medical Education and Research
- Euro Pub
- Google Scholar
Useful Links
Share This Page
Journal Flyer

Open Access Journals
- Agri and Aquaculture
- Biochemistry
- Bioinformatics & Systems Biology
- Business & Management
- Chemistry
- Clinical Sciences
- Engineering
- Food & Nutrition
- General Science
- Genetics & Molecular Biology
- Immunology & Microbiology
- Medical Sciences
- Neuroscience & Psychology
- Nursing & Health Care
- Pharmaceutical Sciences
Research Article - (2021) Volume 12, Issue 4
Presentation of an Intertwined Tumor Chain from Diploid over Tetraploid towards the Aneuploid Tumors
Roland Sennerstam1, Jan-Olov Strömberg2 and Gert Auer1*2Department of Mathematics, Royal Institute of Technology, Stockholm, Sweden
Received: 18-May-2021 Published: 07-Jun-2021, DOI: 10.35248/2157-2518.21.12.363
Abstract
The role of Tetraploidization (TPZ) in tumor progression is not clearly described as an important link from one benign tumor to a more malign tumor. In this report we will intertwine the TPZ in a chain starting with diploid and during a lot of replicative stress parameters and hypoxia under increasing genomic instability losing genetic material and move down to aneuploids tumors. To arrange this connection between DNA (DI) entities we separated all tetraploid tumors in two subgroups (1.8 ≥ DI<2.0) and to (2.0 ≥ DI<2.2), and furthermore, two aneuploid groups divided in (1.2 ≥ DI<1.4) and (1.4 ≥ DI<1.8). This rather simple higher level of resolution has opened a new way to a deeper understanding of ploidy alterations during tumor progression. In total 1253 breast cancer patients divided in five decades were included from age <40 years and up to ≥ 70s. Two connected decades (50 ≥ age<70 years) were included in mammography screening interfering with the data and improved the results. The whole data of DNA- indices in each of the four DI intervals were included within (1.2 ≥ DI<2.2). Furthermore, the genomic instability was analyzed by three increasing levels of Stemline-Scatter Index (SSI): SSI<6, SSI<15 and SSI ≤ 60 rel. units which drives the genomic instability towards higher degree of malignancy.
Keywords
Breast cancer; Genomic instability; Tumor progression; Tetraploidization; Stemline-Scatter Index (SSI).
Abbrevations
DI: DNA-Index; Hyper-T-type tumors: 2.0 ≤ DI <2.2; Hypo-T- type tumors: 1.8 ≥ DI <2.0; Hypo-A1-type tumors: 1.4 ≥ DI<1.8; Hyper - A1 - type tumors: 1.2 = DI<1.4; D-type tumor: Diploid Tumor; G1-phase: Gap1; G2-phase: Gap2; TPZ: Tetraploidization; A2-type tumors: DNA-index 2.2.
Introduction
Significant research efforts have been made since the 1970s to identify the gene mutations responsible for the initiation and development of cancer [1]. Clarifying the genetic mechanisms underlying cancer development remains an important and unsolved question. A specific mutation in the c-kit receptor gene was shown to result in overproduction of a tyrosine kinase, generating uncontrolled cancer cell growth in gastrointestinal stroma tumors. A therapeutic strategy that targets the mutated gene has been developed dramatically improved the survival rate of patients [2]. To analyze the first steps in tumor development are difficult since the start of cancer development is 10-15 years before it will reach clinical detection.
A rather new concept to analyze tumors are to focus on gains and losses, on fractions and large sections of chromosomes as on whole chromosome. It has been collected under the concept “Cancer Chromosomal Instability” (CIN) as a link to aneuploidy [3,4]. Chromosomal alterations in CIN tumors include variations in chromosomal copy and a high rate of gains and losses [5,6]. An established method to visualize gains and losses is by Comparative Genomic Hybridization (CGH) [7,8].
Centrosome duplication is strictly coordinated with DNA replication, mitosis and cell division and defines the early evolution of tetraploid cells. [9-11] This opens the main topic of this paper.
Within the ‘CIN’ concept the method used as a reference for an aneuploid tumor is to test against a normal haploid chromosome [4]. That is a too narrow limit when we analyze diploid, tetraploids as well as aneuploids in a huge simulation. We compere mostly between the tetraploid and aneuploid tumors and against diploid tumors.
Extensive research has been dedicated to analyzing polyploidy including the whole genome duplication. Polyploidy is a common phenomenon in nature observed already before cleavages of the evolutionary tree [12,13]. Two rounds of genome duplication were present before the separation between fish and land vertebrates split. It is frequently observed in fungi and flowering plants at the creating of new species [14].
Polyploidy is not present in animals, because duplication copies of chromosomes, might probably be too problematic, and a high risk of failures during the cleavage embryo. Only one red vizcacha rat currently exists as a genomic tetraploid species [15]. In plants and in angiosperms doubling of the genome is very frequent and new flowers still appear after new polyploidizations [13,16].
Polyploidy has been reported in specific instances in humans; for example, in human heart as a prerequisite for heart muscle numerical hyperplasia in heart hypertrophy [17]. Hepatocytes polyploidizations is a rather common phenomenon related to liver development and diseases [18]. In glia cells in the cerebellum, a significant number of tetraploid cells has been observed, but only in human and chimpanzee. Maybe an example of evolutionary step in development [19]. Megakaryocytes in the blood produce a huge number of platelets and requires large amounts of resources, and megakaryocytes doubling the genome under normal conditions (≤ 64 c) and in paraneoplastic syndromes (≤ 128 c) as an effect of cell maturation [20,21].
Tumor growth is initially dependent on the host. In solid tumors there is a risk of suffering from nutrition, oxygen and blood vessels that initiate hypoxia, lactic acidosis and DNA replication stress, that will be an adverse prognostic factor for patient outcome. Near- Tetraploid cancer cells show chromosome instability triggered by replication stress and exhibit enhanced invasiveness [22-24]. Telomere-driven tetraploidization occurs in human cells undergoing transformation in mouse cells [25]. Hypoxia is a result from an imbalance between the supply of consumption of oxygen and almost 60% of breast cancers contain hypoxic tissue in dispersed areas with pO2 values ≤ 2.5 mm Hg. Normal breast tissue revealed 28 mmHg [26]. In vitro studies showed that when cells are exposed to hypoxia, the expression of specific genes are activated, such as the gene encoding Vascular Endothelial Growth Factor (VEGF/ VPF) gene, a key angiogenic factor, which was demonstrated in human melanoma cells and commonly observed in other cancers [27,28].These results indicate that hypoxia is involved in inducing angiogenesis to promote tumor growth, but are more frequently found in the literature to cause genomic instability [29]. About 40% of all tumors have passed a doubling of the genome during their development. It is a transition from diploid to aneuploid tumors with tetraploids as a vehicle, and the true number of tetraploid passages might me more than 40%. Although tetraploid tumors appear often in cancer, it also occurs in normal development, as well as in normal tissues by endoreplication when the genome replicates without cell division or by cytokinesis failure [30]. Several reports also describe tetraploid tumors to establish genomic instability and move towards aneuploidy [31]. Doubling of the genome can also occur after prolonged arrest in mitosis or by mitotic slippage. Cytokinesis failure is also reported to trigger Hippo tumor suppressor pathway activation [32,33]. Furthermore, cytogenesis failure generating tetraploid tumors promotes tumorigenesis in P53-null cells [34,35].
Materials and Methods
Study population
This study included 1253 breast cancer patients obtained from the nineties (1991-1993) with n=1019 patients they were separated according to age decades <50 years (n=227), 50≥ age< 60 (n=236), 60 ≥ age<70 (n=332) and age ≥70 (n=224). The youngest patient group <40 years from age 24,8 to 39 years (n=234) was selected from (1994- 2001) to obtain a separate sample to avoid an overlapping from the age group<50 years Total numbers of tumors based on age groups was 1253 breast cancers.
During 1989 the mammography screening was introduced in the Stockholm Gotland county Sweden for women 50 ≥ age< 70. All the clinical data was retrieved from the Stockholm Cancer Center and screened every other year.
Sometimes we used the mammography screened decade 60 ≥ age <70 years since those patients had the longest period in screening that started 1989 as compared to the extended 50 ≥ age<70 years. It confirmed a better screening result at age group 60 ≥ age<70. Small tumors were perceptible but had been observed as small X-ray spots and when increasing in size an investigation with needle biopsies was done.
Stemline-Scatter Index (SSI)
The parameter SSI was previously established as a tool to estimate genomic instability [36]. The SSI includes three components: I) the tumor G1CV (G1 is the DNA first peak before S-phase and CV the coefficient of variation, II) and III) the S-Phase Fraction (SPF) is also included in SSI. The aneuploid tumors with its G1-peak position above the tetraploid level (A2-type tumors with DI ≥ 2.2) representing tumors from penta- to octaploid DNA contents. These three components (G1CV+SPF+A2-type DNA) are useful for visualization of genomic instability and proliferative activity. The aneuploids below tetraploids we denoted as A1-type tumors. We applied an equation from a three- dimensional surface using xyz variables with A2-type tumors denoted as: z with the equation z=0.152+0.0508x+0.0506y. It reveals that G1CV (x) and SPF(y) contribute equally to the combined SSI parameter. These determinations offered an opportunity to follow tumor growth with increasing CIN. In our previous study in 2004, we determined the SSI value of 8.8 to be the cut point for genomic instability, however this work clarify it to be a continuum. In our subsequent publication, the SSI parameters were shown to add a stronger predictive prognostic value than the DNA ploidy parameters alone [37].
Development of tetraploidization
SSI was used to reflect the frequency of TPZ during three increasing levels of SSI<6 relative (rel.) units, and SSI<15 as an intermediate value and SSI ≤ 60 rel. units in each of the five age patient groups. The upper limit of SSI ≤ 60 was chosen to have the same endpoint for all five patient groups. Age groups with SSI ≥ 60 rel. units was only observed in two patient groups: 50≤ age<60 (n=4) and age ≥ 70 years (n=3).
DI intervals and ploidy
The total breast cancer sample based on DI intervals was: (1) diploid tumors (D-type: 0.80 ≥ DI <1.2; n=564), (2) tetraploid tumors (T-type tumors:1.8 ≤ DI<2.2; n=362) (3) aneuploid tumors (A1-type tumors): 1.2 ≥ DI <1,8; n=259 (below T-type tumors ) and (4) a small group of penta-to-octa-ploidy tumors (A2-type tumors: DI ≥ 2.2; n=62). The youngest group <40 years at age 24,8 to 39 years we needed to retrieve from years 1994-2001 to reach an equal sample size related to the other groups (n=234) and to avoid an overlap with age group <50 years. Based on DI intervals the total numbers were 1253 patients.
Statistical analysis
Statistical calculations were performed using the Statistica software package (StatSoft, Inc., Tulsa, OK, USA). Statistical significance for categorical variables was calculated using the chi squared test and an independent t-test was used for continuous ones. Linear regression was performed for the correlation test. Statistical significance was indicated at P<0.05. For differences between two percentages, the P-value is computed based on the t-value for the receptive comparison:
|t|=√ [N1 *N2)/(N1+N2)] |p1-p2|/(p*q)
P is equal to (p1*N1+p2*N2)/ (N1+N2)
q=(1-p).7 Estimations of statistical differences were used in two-sided test.
Feulgen staining
Kasten FH: The Feulgen reaction: An enigma in cytopathology. Acta Histochemica 17:88-99, 1964, [38]. DNA measurements were performed using an Ahrens computer assisted systems (Zeiss, Baden- Wutternberg, Germany).
Results
Ploidy and a low genomic instability at SSI<6 rel units
We first examined genomic instability in patients divided according to age groups: <40, <50, and 60 ≥ age <70 years the last having the longest time in mammography screening (see M&M.) and age ≥ 70 years. In this experiment we used the lowest level of genomic instability at SSI<6 rel. units. Even at this low SSI value we found that TPZs occurred in all age groups together with diploid tumors. In the four age groups, the DI of the D-type tumors varied between DI=1.01 ± 0.03 to 1.03 ± 0.05 which is close to normal. Among T-type tumors the age group <40 years had DI=1.96 ± 0.09 and the other three T-type tumors from DI=1.99 ± 0.09 to DI=2.01±0.09 and age ≥ 70 years old DI=2.00 ± 0.10, which was again close to normal. In the whole sample in Figure 1b, we found that 6 tumors were aneuploid among a total of 191 D- and T-type tumors in all four patient groups. The number of T-type tumors were 1/3 of the diploid tumors.
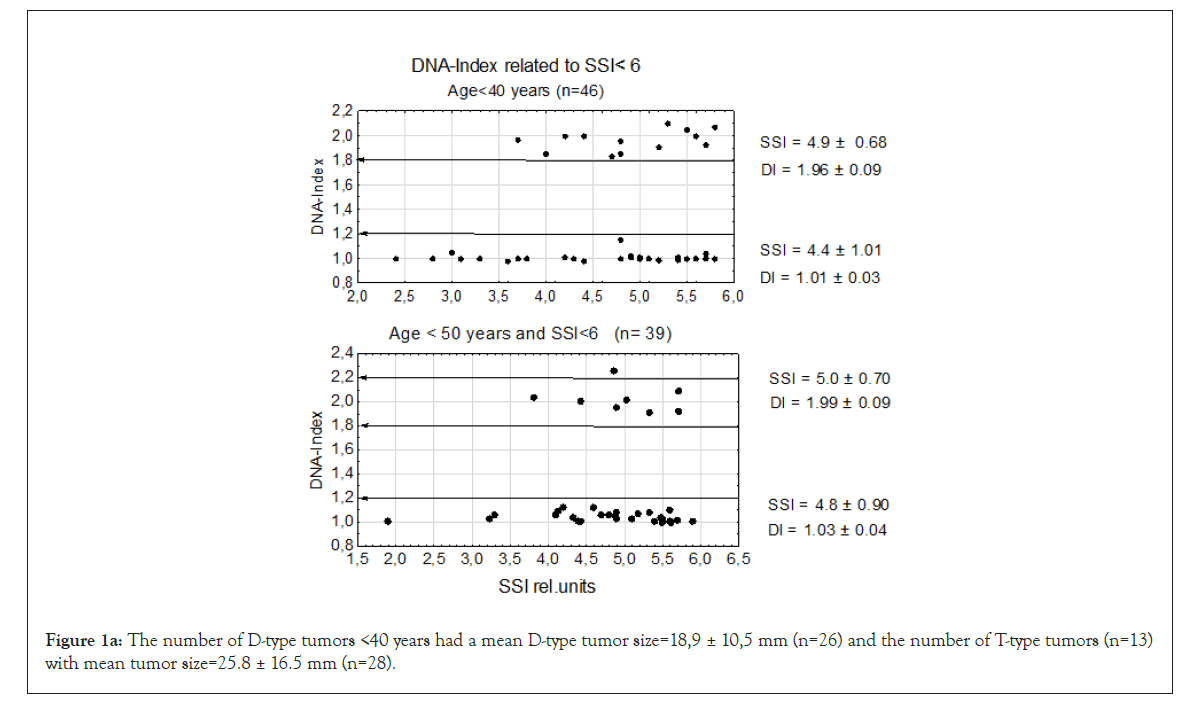
Figure 1a: The number of D-type tumors <40 years had a mean D-type tumor size=18,9 ± 10,5 mm (n=26) and the number of T-type tumors (n=13)with mean tumor size=25.8 ± 16.5 mm (n=28).
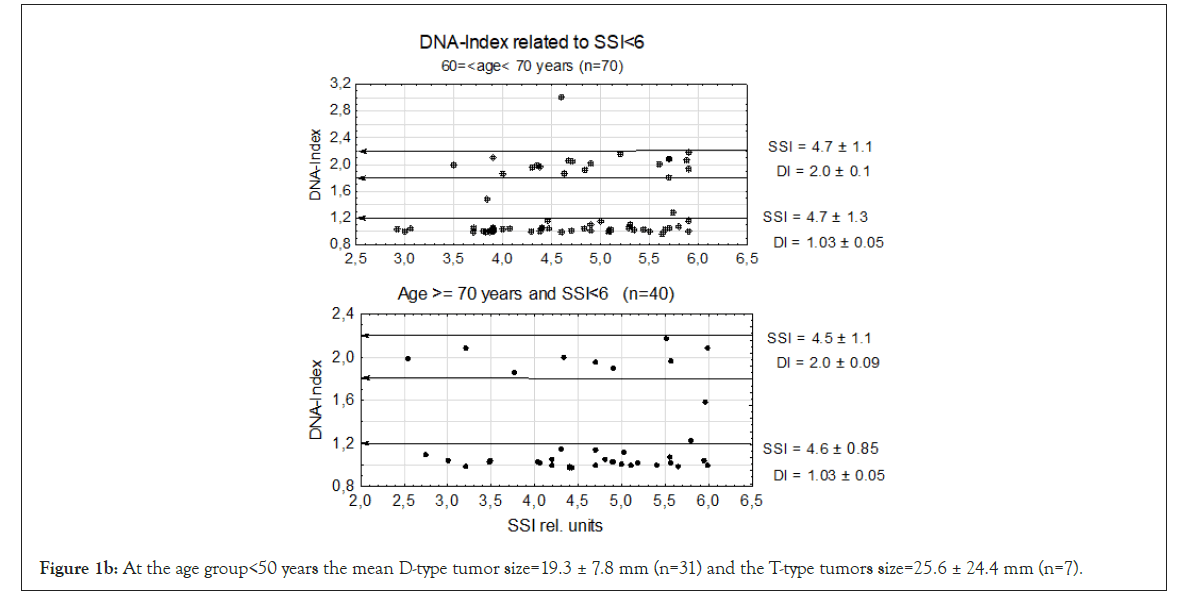
Figure 1b: At the age group<50 years the mean D-type tumor size=19.3 ± 7.8 mm (n=31) and the T-type tumors size=25.6 ± 24.4 mm (n=7).
There is one A2-type tumor in the age groups <50 years close to DI=2.2. It might be more a question of sliding upwards over the T-type tumor border than a second polyploidization. No A2 tumors were found in the DI interval 1,2 ≥ DI<1.8 in either of the age groups <40 or <50 years.
In age group 60 ≥ ag<70 there was one A2-type tumor close to DI=3.0 and might be a DNA doubling from an A1-type tumor to A2-type tumor. At age group ≥ 70 years there were 2 A1-type tumors but no A2-type tumors.
Establishment of all four DI entities within the DNA limits 1.2 ≥ DI<2.2
A 48-50 tumors were registered at every second step on the x-axis (see Figures 2a-2d). In all four DI groups the increasing numbers of tumors were assembled accumulatively along with the y-axis (<40 years to=70 years) Table 6.
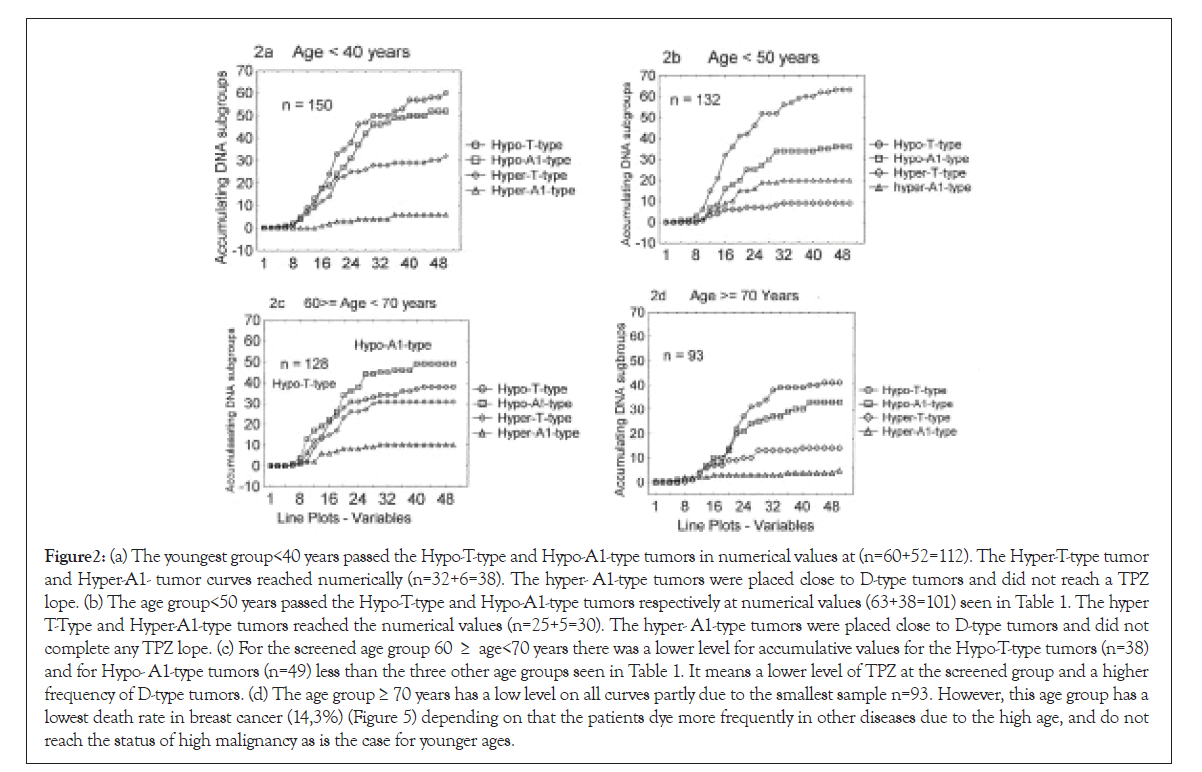
Figure 2: (a) The youngest group<40 years passed the Hypo-T-type and Hypo-A1-type tumors in numerical values at (n=60+52=112). The Hyper-T-type tumor and Hyper-A1- tumor curves reached numerically (n=32+6=38). The hyper- A1-type tumors were placed close to D-type tumors and did not reach a TPZ lope. (b) The age group<50 years passed the Hypo-T-type and Hypo-A1-type tumors respectively at numerical values (63+38=101) seen in Table 1. The hyper T-Type and Hyper-A1-type tumors reached the numerical values (n=25+5=30). The hyper- A1-type tumors were placed close to D-type tumors and did not complete any TPZ lope. (c) For the screened age group 60 ≥ age<70 years there was a lower level for accumulative values for the Hypo-T-type tumors (n=38) and for Hypo- A1-type tumors (n=49) less than the three other age groups seen in Table 1. It means a lower level of TPZ at the screened group and a higher frequency of D-type tumors. (d) The age group ≥ 70 years has a low level on all curves partly due to the smallest sample n=93. However, this age group has a lowest death rate in breast cancer (14,3%) (Figure 5) depending on that the patients dye more frequently in other diseases due to the high age, and do not reach the status of high malignancy as is the case for younger ages.
| <40 years | <50 years | 60 ≥ age 70 | >=70 years | |
|---|---|---|---|---|
| Hypo-T-type Hypo-A1-type |
n=60 n=52 Σ=112 |
n=63 n=38 Σ=101 |
n=38 n=49 Σ=87 |
n=41 n=33 Σ=74 |
| Hyper-T-type Hyper-A1-type |
n=32 n=6 Σ=38 |
n=24 n=6 Σ=30 |
n=31 n=10 Σ=41 |
n=14 n=5 Σ=19 |
| Total sample | n=150 | n= 131 | n=128 | n=93 |
Table 1: In the age group <40 years 150 tumors were within the specified DI interval (1.2 ≥ DI<2.2), while 131 were detected in the age group <50 years, 128 tumors in the age group 60 ≥ age <70 years and 93 tumors in the age group ≥ 70 years.
The combined DI interval (1.4 ≥ DI <2.0) with the largest flow of tumors did dominate in numbers in all age groups: <40 years (74.7%), <50 years (77.1%), 60 ≥ age <70 in the screened group (68%) and age ≥ 70 (79.6%). No significant difference appeared pairwise in the four age groups (Table 2). In this Table the screened group does not differ from the other three age groups when have entered the TPZ.
| <40 years | <50 years | 60 ≥ age 70 | >=70 years | |
|---|---|---|---|---|
| Hypo-T-type Hypo-A1-type |
112/150 74.7% |
101/131 77.1% |
87/128 68.0% |
74/93 79.6% |
| P value | P <0.001 | P<0.001 | P<0.001 | P<0.001 |
| Hyper-T-type Hyper-A1-type |
38/150 25.3% |
30/131 22.9% |
41/128 32.0% |
19/93 20.4% |
| 100% | 100% | 100% | 100% |
Table 2: The hypo-T-type + hypo-A1-type tumors represent a mainstream with a mean of 74.8% in all four groups (See Table 1).
The DI interval including in 1.4 ≥ DI <2.0 was presented in a linear regression analysis.
To investigate the progress in the DI combined interval (Hypo-T- Type+Hypo-A1-type tumors), we analyzed the unified sample two SSI values in two levles (<15 and ≤ 60 rel. units) in linear regression analysis we found at SSI ≤ 60 rel. units a significant negative slope P<0.001), but not for SSI<15 rel. units. It conforms an established mainstream flow of tumor from the highest genomic instability (SSI ≤ 60) at the lower-tetraploid position (Hypo-T-type tumors) and further down towards aneuploidy (Hypo-A1-type tumors) (Figures 3a and 3b).
| Age<50 years | ||||||
|---|---|---|---|---|---|---|
| D-type tumor | SSI=11.0 ± 9.7 | n=90 | ns | n=26 | SSI=13.4 ± 7.9 | Hyper-T-type |
| D-type tumor | SSI=11.0 ± 9.7 | n=90 | P < 0.001 | n=44 | SSI=18.7 ± 10.8 | Hypo-T-type |
| D-type tumor | SSI=11.0 ± 9.7 | n=90 | P < 0.0001 | n=40 | SSI=23.6 ± 11.9 | Hypo-A1-type |
Table 3a: Ninety D-type (diploid) were related to three SSI values against Hyper-T-type, Hypo-T- type and Hypo-A1-type tumors. D-type tumors and Hyper-T-type tumors did not show any significance difference in SSI values, representing the first connection between D-type tumors and aneuploid tumors. The tumors increased strongly in SSI difference stepwise towards increasing genomic instability down to Hypo-A1-type tumors via Hypo-T-type tumors against D-type tumors.
| Age 50 ≥ age <60 years | ||||||
|---|---|---|---|---|---|---|
| D-type tumor | SSI=9.8 ± 6.9 | n=94 | P<0.05 | n=20 | SSI=13.5±10.0 | Hyper-T-type |
| D-type tumor | SSI=9.8 ± 6.9 | n=94 | P < 0.002 | n=42 | SSI=14.7±11.0 | Hypo-T-type |
| D-type tumor | SSI=9.8 ± 6.9 | n=94 | P < 0.0001 | n=33 | SSI=19.0±11.3 | Hypo-A1-type |
Table 3b: D-type tumors with SSI=9.8 ± 6.9 were related to Hyper-T-type, Hypo-T- and Hypo-A1-type tumors with increasing SSI values. A lower level of SSI was found at age 50≥ age <60 years due to mammography screening, but still a significant difference against Hypo-T-type and Hypo-A1-type tumors.
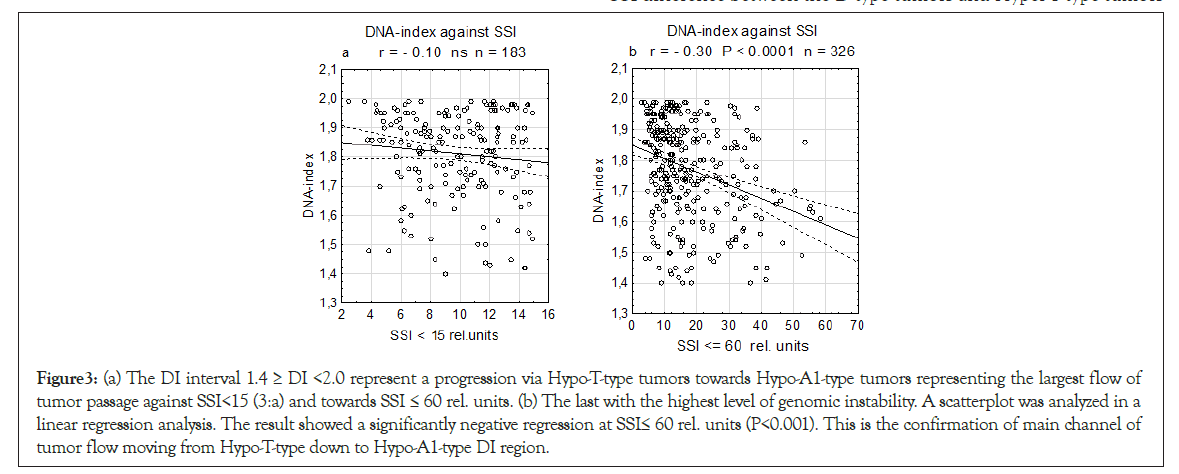
Figure 3: (a) The DI interval 1.4 ≥ DI <2.0 represent a progression via Hypo-T-type tumors towards Hypo-A1-type tumors representing the largest flow of tumor passage against SSI<15 (3:a) and towards SSI ≤ 60 rel. units. (b) The last with the highest level of genomic instability. A scatterplot was analyzed in a linear regression analysis. The result showed a significantly negative regression at SSI≤ 60 rel. units (P<0.001). This is the confirmation of main channel of tumor flow moving from Hypo-T-type down to Hypo-A1-type DI region.
The Hyper-A1-type and Hyper-T-type tumors with the lowest activities were analyzed.
The Hyper-A1-type tumors have a position starting close to the upper border at the D-type tumors within the lower aneuploid DI region and have a low mean values for both DNA-Index (DI)=1.26 ± 0.02 and SSI rel. units=15.6 ± 12.0 (Figure 4a). The Hyper-T- type tumors had a slight positive test in linear regression analysis but not significant and mean SSI=13.0 ± 9.0 and DI=2.06 ± 0.05 (n=92) in a dispersed sample (Figures 4a and 4b).
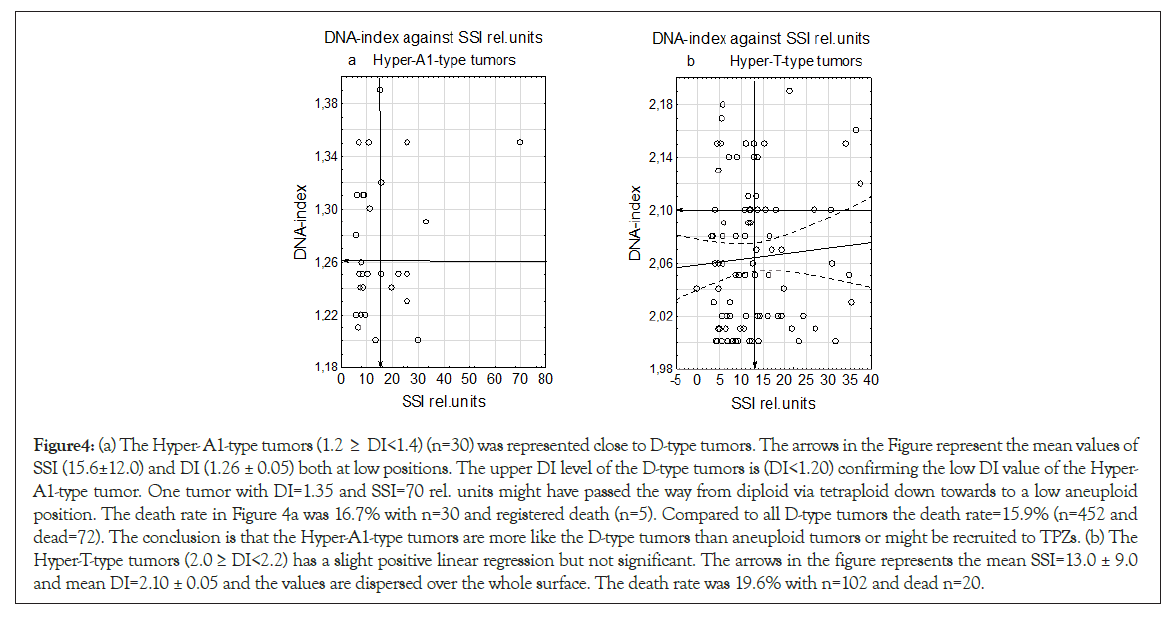
Figure 4: (a) The Hyper- A1-type tumors (1.2 ≥ DI<1.4) (n=30) was represented close to D-type tumors. The arrows in the Figure represent the mean values of SSI (15.6±12.0) and DI (1.26 ± 0.05) both at low positions. The upper DI level of the D-type tumors is (DI<1.20) confirming the low DI value of the Hyper- A1-type tumor. One tumor with DI=1.35 and SSI=70 rel. units might have passed the way from diploid via tetraploid down towards to a low aneuploid position. The death rate in Figure 4a was 16.7% with n=30 and registered death (n=5). Compared to all D-type tumors the death rate=15.9% (n=452 and dead=72). The conclusion is that the Hyper-A1-type tumors are more like the D-type tumors than aneuploid tumors or might be recruited to TPZs. (b) The Hyper-T-type tumors (2.0 ≥ DI<2.2) has a slight positive linear regression but not significant. The arrows in the figure represents the mean SSI=13.0 ± 9.0 and mean DI=2.10 ± 0.05 and the values are dispersed over the whole surface. The death rate was 19.6% with n=102 and dead n=20.
Tumor SSI levels between D-type tumors and the three hyper-T-type, hypo-T-type to hypo-A1-type tumors
At age group <50 years there was no significant SSI difference between D-type tumors and Hyper-T-type tumors comparing the SSI-values, but a strong stepwise increasing difference appeared between D-type tumors against Hypo-T-type tumors (P <0.001) and further stronger against Hypo-A1-type tumors (P <0.0001) (Table 3a).
At the age screened group 50 ≥ age <60 there was a low significant SSI difference between the D-type tumors and Hyper-T-type tumors (P<0.05), and a stronger significance appeared against D-type tumors and Hypo-T-type tumors (P <0.002) and finally Hypo-A1- type tumors (P <=0.0001) (Table 3b).
Diploid tumors were included to four non-D-type tumors (1.2 ≥ DI<2.2)
To investigate the relation between the four DI age intervals within 1,2>=DI<2,2, we included the diploid tumors to each 4 DI groups (Table 4). These results showed significantly that there were more D-type tumors in the age group 60 ≥ age<70 due to mammography screening and patients ≥ 70 years. The elder patients have passed screening rather recently and although they have breast cancer, they die in a higher rate for other sickness, therefore they have the lowest death rate in all other four breast cancer patients (death rate=14.3%) (Table 5).
| <40 years | <50yeas | 60>=age<70 | >=70 years | |
|---|---|---|---|---|
| Relation between the DNA intervals in 1.2>=DI<2.2 and whole samples per age group |
150/234 64.1% |
135/223 60.5% |
128/296 43.2% |
93/209 44.5% |
| <40 years | 64.1%/234 | P<0.0001 | 43.2%/296 | 60>=age<70 years |
| <40 years | 64.1%/234 | P< 0.0001 | 44.5%/209 | >=70 years |
| <50 years | 58.7%/223 | P=<0.001 | 43.2%/296 | 60>=age<70 years |
| <50 years | 58.7%/223 | P<0.001 | 44.5%/209 | >=70 years |
Table 4: Table 4 is related to Table 1: To the four age groups within 1.2 ≥ DI<2.2 interval the D-type tumors were added reaching the whole samples in each age group. A strong significant difference appeared between the two youngest against the two elder patient groups. It means that the elder patients have significantly more D-type tumors.
| Tumor Size mm | Age <40 N=234 | Age <50 N=223 | 50 ≥ age<60 N=210 | 60 ≥ age<70 N=296 | ≥ 70years N=209 |
|---|---|---|---|---|---|
| mean+SD | mean+SD | mean+SD | mean+SD | mean+SD | |
| D-type tumors | 22.5 ± 13.5 | 20.0 ± 10.7 | 17.8 ± 11.3 | 16.1 ± 11.8 | 19.8 ± 12.2 |
| Whole A1- type tumors | 24.6 ± 14.5 | 20.4 ± 8.5 | 19.8 ± 10.6 | 19.2 ± 10.2 | 22.9 ± 12.6 |
| T-type tumors | 25.0 ± 13.9 | 23.6 ± 12.2 | 19.8 ± 9.0 | 18.7 ± 10.4 | 22.1 ± 10.2 |
| A2-type tumors | 31.7 ± 15.3 | 23.4 ± 11.1 | 24.3 ± 9.2 | 19.4 ± 9.5 | 26.5 ± 10.6 |
| Death number | n=81 | n=75 | n=45 | n=55 | n=30 |
| Death rate | 34.60% | 33.60% | 21.40% | 18.50% | 14.30% |
Table 5: The five tumors with age decades are presented in 4 DNA-index groups, increasing tumors size and death rates estimated for each group. The age group ≥ 70 years has the lowest death rate. It depends upon that although several individual in the group have breast cancer, they die frequently in other diseases.
| Age years | TPZs | % | P | % | TPZs | Age years |
|---|---|---|---|---|---|---|
| <40 n=234 | n=71 | |||||
| <50 n=227 | n=80 | 60 ≥ age<70 | ||||
| Σ = 461 | Σ=151 | 32.8% | P <0.03 | 25.0% | n=75 | n=300 |
Table 6: Adding the younger age groups <40 and <50 years with mammography screened age group 60 ≥ age<70 years in a difference between numbers of TPZs, showing a significant difference between the two groups.
A second period of TPZs
Repeating the data from the Introduction with increasing genomic instability suffering from nutrition, oxygen and waiting for ingrowth of vessels. All this will result in initiating of hypoxia and DNA replication stress, a period where several reports linking TPZs to this stress period. Due to these circumstances, we analyze the development of age groups <40 and <50 and 50 ≥ age<70 years following increase in SSI rel. values for D-type, T- type and A1-type tumors. At each point on the curves all three values were changed to percent and all three DI entities together reached 100% at every point on the curve (Figures 5a-5c).
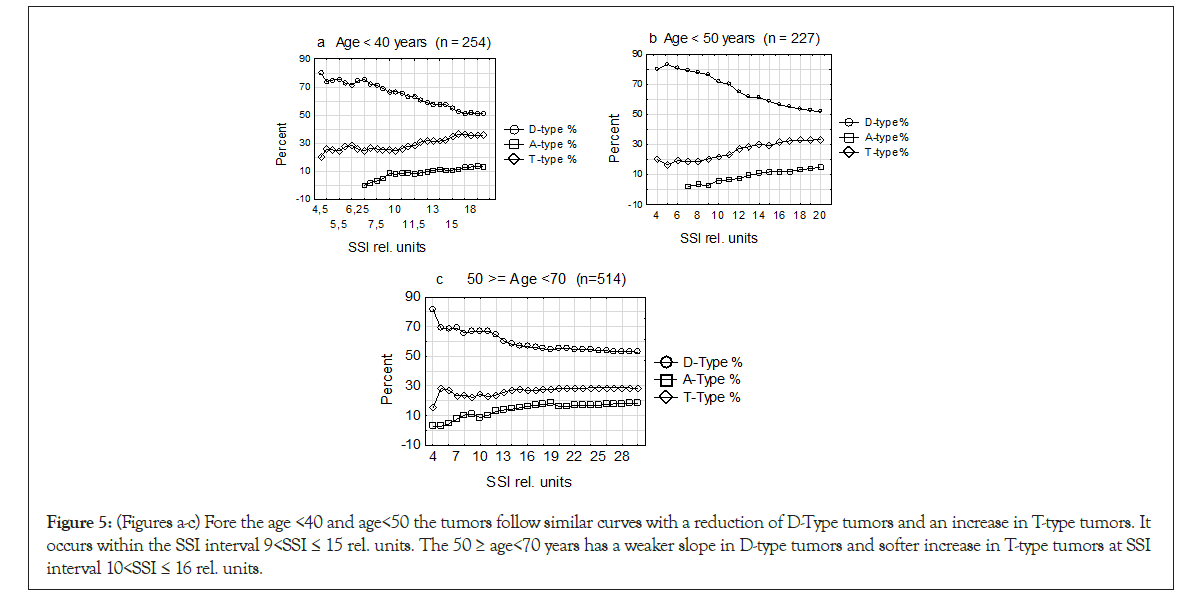
Figure 5: (Figures a-c) Fore the age <40 and age<50 the tumors follow similar curves with a reduction of D-Type tumors and an increase in T-type tumors. It occurs within the SSI interval 9<SSI ≤ 15 rel. units. The 50 ≥ age<70 years has a weaker slope in D-type tumors and softer increase in T-type tumors at SSI interval 10<SSI ≤ 16 rel. units.
| x-axis | Hypo-T-type tumors | Hypo-Al-type tumors | Hyper-T-type tumors | Hyper-Al- type tumors |
|---|---|---|---|---|
| 1 | 0 | 0 | 0 | 0 |
| 2 | 0 | 0 | 0 | 0 |
| 4 | 0 | 0 | 1 | 0 |
| 6 | 0 | 1 | 1 | 0 |
| 8 | 2 | 2 | 1 | 0 |
| 10 | 5 | 4 | 4 | 0 |
| 12 | 9 | 7 | 7 | 0 |
| 14 | 11 | 13 | 9 | 0 |
| 16 | 18 | 18 | 12 | 1 |
| 18 | 24 | 19 | 14 | 2 |
| 20 | 33 | 24 | 22 | 3 |
| 22 | 35 | 27 | 23 | 3 |
| 24 | 38 | 31 | 25 | 3 |
| 26 | 46 | 37 | 25 | 4 |
| 28 | 47 | 42 | 26 | 4 |
| 30 | 50 | 46 | 28 | 4 |
| 32 | 50 | 46 | 28 | 4 |
| 34 | 50 | 47 | 28 | 6 |
| 36 | 52 | 49 | 29 | 6 |
| 38 | 53 | 49 | 29 | 6 |
| 40 | 57 | 50 | 29 | 6 |
| 42 | 57 | 50 | 29 | 6 |
| 44 | 57 | 50 | 29 | 6 |
| 46 | 58 | 52 | 30 | 6 |
| 48 | 58 | 52 | 30 | 6 |
| 50 | 60 | 52 | 32 | 6 |
Table 7: Data obtained from age group <40 years and retrieved in statistics from the graph model and the plot of multiple variables.
Comparing histograms in four age groups within 9>SSI ≤ 15 rel units
During the restrictive SSI interval 9 <SSI ≤ 15 rel. units, we now show how DNA histograms did grow included under those circumstances. We estimate the relation between the G2 peak (tetraploid DNA position in a histogram) with the G1 peak (the diploid position) and registered the numbers on the end top of the peaks.
This investigation shows that there is an increase in TPZs restricted by genomic instability (SSI), during a period of maybe DNA suffering from vital support.
The tumor size within 9> SSI ≤ 15 rel. units was for age<40 years=21.8 ± 16.2 mm n=75, age<50 years=22.0 ± 11.9 mm n=60, 50≥age<70 years=21.5 ± 11.2 mm and ≥ 70=24.0 ± 10.8 n=55. The similarity in these 4 tumor sizes indicates a restricted critical similar period. The screened women 60 ≥ age <70 years with diploid tumors and a mean tumors size=16.1 ± 11.8 mm might be in a safe environment (Table 5).
Discussion
In this paper we have followed DNA- index blocks to find out how they interact during tumor progression. We divided the tetraploid and aneuploid tumors in two subgroups each to get the optimal width of the outcome. The data was analyzed in five age groups from age <40 years to ≥ 70 years with an incorporated mammography screening representing 50 ≥ age <70 years.
We started to analyze tumor growth at SSI<6 rel. units at a low level of genomic instability with D- and T-type tumors having DNAindex close to normal and a death rate near 10%.
A similar early appearance of tetraploid cells in early tumor progression has been observed in precancerous Cervical Intraepithelial Neoplasia (CIN). In CIN I 40% were tetraploid and 0% aneuploid, CIN II (n=0% tetraploid and 60% aneuploid) and CIN III 20% tetraploid and 60% aneuploid and in established cancer 100% aneuploid [39]. These results indicate that tetraploids are present in cervix precancerous lesions. It is in line with our observations with a low level of genomic instability in the early stages of tumor progression as shown in Figure 1, but aneuploids were established faster in cervix cancer [40]. No precancer data is possible to analyze in breast cancer.
The whole sample above the diploid DI-interval was divided in two tetraploid and two aneuploid subgroups. Two of the four subgroups (Hypo-T-type and Hypo-A1-type tumors) did dominate in a mainstream flow of tumor passage representing a medium of 75% at all four tumor age groups (Table 2). The common mainstream was showed in a strong negative significant linear regression analysis (Figure 3b).
Mammography screening has interfered strongly in the analyses. Comparing the death rates of the two youngest age group <40 and <50 years against the screened grope 60 ≥ age <70 years, the younger patients had a near doubled death rate to those of the screened groups. The screened women have significantly more diploid tumors (Table 4) due to an improved result at X-ray examination and over time reach further smaller tumors. The smaller the tumors are at diagnosis, the longer time it takes to enter the Hypo-T-type to Hypo-A1-type tumors position. But when a screened patient has entered a start of TPZ, the tumor must have the required genomic instability needed as shown in Figures 6a-6d.
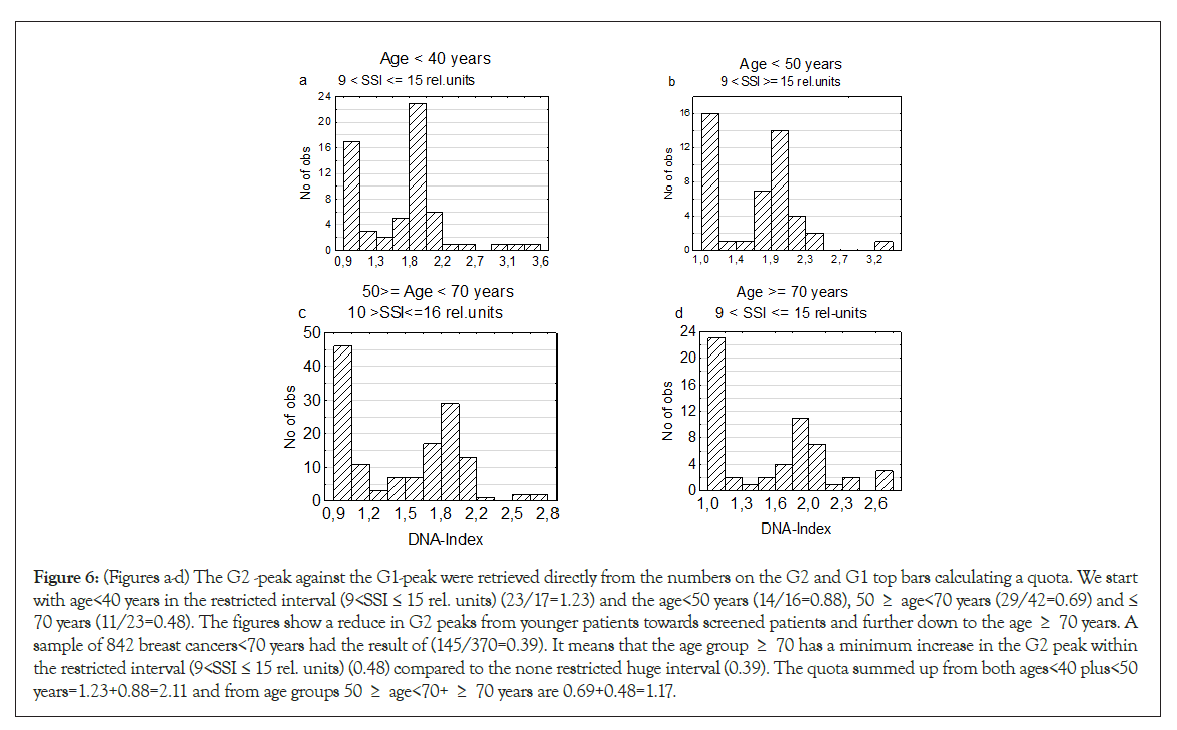
Figure 6: (Figures a-d) The G2 -peak against the G1-peak were retrieved directly from the numbers on the G2 and G1 top bars calculating a quota. We start with age<40 years in the restricted interval (9<SSI ≤ 15 rel. units) (23/17=1.23) and the age<50 years (14/16=0.88), 50 ≥ age<70 years (29/42=0.69) and ≤ 70 years (11/23=0.48). The figures show a reduce in G2 peaks from younger patients towards screened patients and further down to the age ≥ 70 years. A sample of 842 breast cancers<70 years had the result of (145/370=0.39). It means that the age group ≥ 70 has a minimum increase in the G2 peak within the restricted interval (9<SSI ≤ 15 rel. units) (0.48) compared to the none restricted huge interval (0.39). The quota summed up from both ages<40 plus<50 years=1.23+0.88=2.11 and from age groups 50 ≥ age<70+ ≥ 70 years are 0.69+0.48=1.17.
A second period of TPZs was identified at the SSI interval 9< SSI≤15 rel. units followed by increase of TPZ at a high level for the two youngest age groups and reducing stepwise for screening patients and further down towards age group ≤ 70 years [41].
Conclusion
The most important result in this paper is the identification of the two dominating DI intervals Hypo-T-type and Hypo-A1-type tumors. A linear regression analysis confirmed the downward passage of these numerically large tumor groups, having reached a high level of genomic instability. An observed second increase in TPZs indicates a period of stress against pressing for more hardware. A rather daring statement in this breast cancer study is to postulate, that there will appear few highly malignant aneuploid tumor, before passing around the tetraploids.
Ethics
The study design of DNA project approved by the ethics committee at Karolinska lnstitutet, Stockholm,
Sweden (2013 I 707-31 I 3). Three principals are responsible for the necessary financial, structural and personal resources and guarantee the implementation of the research project are Professor Thomas Ried, MD National Institute of Health, National Cancer Institute, Bethesda MD, USA; thomas.ried@nih.gov, Professor Jens H Haberman MD, PhD, University of Lubeck, Germany jens .haberman@uni.luebeck.de The principal researcher is Professor Gert Auer Karolinska lnstitutet and Karolinska University Hospital, Solna 171 76 Stockholm, gert.auer@ki.se
Acknowledgement
We thank Gabriella White Wolf, PhD, from Edanz Group (https://en- author-service.Edanz.com/ac) for editing a draft of this manuscript. Funded by Karolinska Institute Fund, The laboratory technician was supported by the Stockholm Cancer Society mainly for her aid in DNA measurements.
REFERENCES
- Norwell PC. The Clonal evolution of tumor population. Science. 1976;194(4260):23-28.
- Chetty R, Serra S. Molecular and morphological correlation in gastrointestinal stromal tumors (GISTs):an update and primer. J Clin Pathol. 2016;69(4):754-760.
- Geigl JB, Obenauf AC, Schwarzbraun TH, Speicher MR. Defining ‘chromsomal instability’. Trends Genet. 2008;24(2):64-69.
- Thompson SL, Backhoum SF, Compton DA. Mechanisms of Chromosomal instability. Current Biology. 2010;20(6):R285-R295.
- Beckman RA, Loeb LA. Genetic instability in cancer: theory and experiment. Semin Cancer Biol. 2005;15(6):423-435.
- Sieber OM, Heinimann K, Tomlinson I PM. Genomic instability-the engine of tumorigenesis?. Nat Rev Cancer. 2003;3(9):701-708.
- Ried Th, Just KE, Holtgreve-Grez H, du Nonoir S, Speicher MR, Schröck MR, et al. Comparative Genomic Hybridization of Formalin-fxed Paraffin-embedded Breast Tumors Reveals Different Patterns of Chromosomal Gains and Losses in Fibroadenomas and Diploid and Aneuploid Carcinoma. Cancer Res. 1995;55(22):5415-5423.
- Blegen H, Ghadimi M, Jauho A, Zetterberg A, Eriksson E, Auer G, et al. Genetic instability promotes the acquisition of chromosomal imbalances in T1b and T1c breast adenocarcinomas. Analytical Cellular Pathol. 2001;22(3):1213-1231.
- Lingle WL, Barret SL, Negron VCD, Assoro KB, Boeneman K, Wangou Whithead CM, et al. Centrosom amplification drives chromosomal instability in breast cancer. Proc Natl Acad Sci USA 2002;99(4):1978-1983.
- Fukasawa K. Centrosome amplification, chromosome instability and cancer development. Cancer Letter. 2004;230(1):6-19.
- Baudoin NC, Nicholsson JM, Soto K, Martin O, Chen J, Cimini D. Asymmetric clustering of centrosomes defines the early evolution of tetraploid cells. Elife. 2020;9(4):e54565.
- Otto SP. The evolution consequences of polyploidy. Cell. 2007;131(3):452-462.
- Van de Peer Ys, Maere S, Meyer A. The evolutionary significance of ancient genome duplication. Nat Rev Genet. 2009;10(4):725-732.
- Van de Peer Ys, Maere S, Meyer A. The evolutionary significance of ancient genome duplication. Nat Rev Genet. 2009;10(4):725-732.
- Cui L, Wall PK, Wall Leebens-Marck, JH, Lindsay BG, Soltis DE, Doyle J, et al. Widespread genome duplications through the history of flowering plants. Genome Res. 2006;16(6):738-749.
- Gallardo MH, Bickham JW, Honeycutt RL, Ojeda RA, Kohler N. Discovery of tetraploidy in a mammal. Nature. 1999; 401(5):341.
- Vliegen HW, Elderink F, Bruschke AV, van der Laarse A, Comelisse CJ. Plyploidy of myocyte uclei in pressure overloaded human hearts: a flow cytometric study in left and right ventricular myocardium. Am J Cardiovasc Pathol. 1995;5(1):27-31.
- Van Drunen WE, Husband BC. Evolutionar association between polyploidy, conal reproduction, and perennieality in angiosperms. New Phytologist. 2019;224(3):1266-1277.
- Gentric G, Desdouets C, Celton-Morizur S. Hepatocytes polyploidization and cell cycle in liver physiopathology. Int J Hepatol. 2012. 2012(2):282430.
- Mann DM, Yates PO. A quantitative, study of glia of the Purkinje cell layer of the cerebellum in mammals. Neuropathol Appl Neurobiol. 1979;5(1):71-76
- Mazzi S, Lordier L, Debili N, Rasolva, H, Vainchenker W. Megakaryocyte and polyploidizationn. Enperimen Hematol. 2018;57(1):1-13.
- Pfitzer P, Winkelmann M, Schneider W. Polyploidiemuster von Megakaryozyten bei Patienten mit thrombotisher Paraneoplasie und Kontrollkolletive. Verh Dtsch Ges Patol. 1966;67(6):478-82.
- Wangsa D, Quintanilla I, Torabi K, Vila-Casadesús M, Ercilla A, Klus, G, et al. Near-tetraploid cancer cells show chromosomes instability triggered by replication stress and exhibit enhanced invasiveness. FASEB J. 2018;32(7):3502-3517.
- Ichijima Y, Yoshioka KI, Yoshioka Y, Shinohe K, Fujimori H, Unno J, et al. DNA lesions induced by replication stress triggers mitotic aberration and tetraploidy development. PloS ONE. 2010;5(1):e8821.
- Gaillard H, Carcia-Muse T, Aguilera A. Replication stress and cancer. Review Nat Rev Cancer. 2015;15(5):276-82.
- Davoli T, de Lange T. Telomere-driven tetraploidization occurs in human cells undergoing crisis and promotes transformation of mouse cells. Cancer Cell. 2012;21(6):765-776.
- Vaupel F, Briest. S, Höckel M. Hypoxia in Breast Cancer: Pathogenesis, Characterization and Biological/Therapeutic Implications. 2002;152(14):334-342.
- Claffey KP, Robinson GS. Regulation of VEGF/VPF expression in tumor cells: consequences for tumor growth and metastasis. Cancer Metastasis Rev. 1996;15(2):165-176.
- Rofstad EK, Danielsen T. Hypoxia-induced angiogenesis and vascular endothelial growth factor secretion in human melanoma. British J Cancer. 1998;77(6):897-902.
- Luoto KR .Kumareswaran R, Bristov RG. Tumor hypoxia as a driving force in genetic instability. Gemome Itegr. 2013;4(1)5:5.
- Davoli T, de Lange T. The causes and consequences of ployploidy in normal development and cancer. Annu Rev Cell Dev Biol. 2011;27(4):585-610.
- Storchova Z, Pellman D. From polyploidy to aneuploidy, genome instability and cancer. Nat Rev Mol Cell Biol. 2004;5(1):45-54.
- Ganem NJ, Storchova Z, Pellamn D. Tetraploidy, aneuploidy and cancer. Curr Opin Genet Dev. 2007;17(2):157-162.
- Ganem NJ, Cornils H, Chiu SY, O´Rourke KP, Arnoud J, Yimlamai D, et al. Cytokinesis failure trigger Hippo tumor suppressor pathway activation. Cell. 2014;158(4):833-848.
- Rofstad EK, Johnsen NM, Lyng H. Hypoxia-induced tetraploidization of a diploid human melanoma cell line in vitro. Br J Cancer. 1996;27(6):136-139.
- Fujiwara T, Bandi M, Nitta, M, Ivanova EV, Bronson TR. Cytogenesis failure generating tetraploids promotes tumorigenesis in P53-null cells. Nature. 2005;437(4):1043-1047.
- Kronenewett U, Huwendiek S, Östring C, Portwood N, Roblick UJ, Pawitan Y, et al. Improved Gradig of Breast adenocarcinom as Based on Genomic instability. Cancer Res. 2004;64(3):904-909.
- Kasten FH. The Feulgen reaction: An enigma in cytochemistry. Acta Histochemica. 1964;17():88-99,
- Kronenwett U, Ploner A, Zetterberg, A, Berg J, Hall P, Auer G, et al. Genomic Instability and prognosis in Breast Carcinomas. Cancer Epidemiol Biomakers Prev. 2006;15(9):1630-1635.
- Skyldberg B, Fujioka K, Hellsström AC, Sylvén L, Moberger, Auer G. Human papillomavirus infection, centrosome aberration, and geentic stability in cervical lesions. Mod Pathol. 2001;14(4):279-284.
- Olaharski AJ, Sotelo R, Solorza-Luna G, Gonsebatt PG, Mohar A, Eastmond DA. Tetraploidy and chromosomal instability are early events during cervical carcinogenesis. Carcinogenesis. 2006;27(2):337-343.
Citation: Sennerstam R, Strömberg JO, Auer G (2021) Presentation of an Intertwined Tumor Chain from Diploid over Tetraploid towards the Aneuploid Tumors. J Carcinog Mutagen. 12: 363.
Copyright: © 2021 Sennerstam R, et al. This is an open-access article distributed under the terms of the Creative Commons Attribution License, which permits unrestricted use, distribution, and reproduction in any medium, provided the original author and source are credited.
