Indexed In
- Open J Gate
- Genamics JournalSeek
- China National Knowledge Infrastructure (CNKI)
- Ulrich's Periodicals Directory
- RefSeek
- Hamdard University
- EBSCO A-Z
- OCLC- WorldCat
- Publons
- Google Scholar
Useful Links
Share This Page
Journal Flyer
Open Access Journals
- Agri and Aquaculture
- Biochemistry
- Bioinformatics & Systems Biology
- Business & Management
- Chemistry
- Clinical Sciences
- Engineering
- Food & Nutrition
- General Science
- Genetics & Molecular Biology
- Immunology & Microbiology
- Medical Sciences
- Neuroscience & Psychology
- Nursing & Health Care
- Pharmaceutical Sciences
Research - (2021) Volume 11, Issue 5
Predicting the Severity of Disease Progression in COVID-19 at the Individual and Population Level: A Mathematical Model
Narendra Chirmule1*, Ravindra Khare1, Pradip Nair2, Bela Desai3, Vivek Nerurkar4 and Amitabh Gaur52Biocon Research Limited, Karnataka, India
3Nano Cellect Biomedical, California, USA
4Department of Tropical Medicine, Medical Microbiology and Pharmacology, University of Hawaii, Hawaii, USA
5Innovative Assay Solutions LLC, California, USA
Received: 14-May-2021 Published: 04-Jun-2021, DOI: 10.35248/2161-1459.21.11.283
Abstract
The impact of COVID-19 disease on health and economy has been global, and the magnitude of devastation is unparalleled in modern history. Any potential course of action to manage this complex disease requires the systematic and efficient analysis of data that can delineate the underlying pathogenesis. We have developed a mathematical model of disease progression to predict the clinical outcome, utilizing a set of causal factors known to contribute to COVID-19 pathology such as age, comorbidities, and certain viral and immunological parameters. Viral load and selected indicators of a dysfunctional immune response, such as cytokines IL-6 and IFNα which contribute to the cytokine storm and fever, parameters of inflammation d-dimer and ferritin, aberrations in lymphocyte number, lymphopenia, and neutralizing antibodies were included for the analysis. The model provides a framework to unravel the multi-factorial complexities of the immune response manifested in SARS-CoV-2 infected individuals. Further, this model can be valuable to predict clinical outcome at an individual level, and to develop strategies for allocating appropriate resources to mitigate severe cases at a population level.
Keywords
Innate; Interferon; Cytokine-storm; Lymphopenia; Neutralizing-antibodies; Viral factors; Modeling; Prediction
Introduction
The COVID-19 pandemic caused by infection with SARS-CoV-2 was officially announced in March 2020 by the CDC and WHO [1,2]. As of this publication, more than 100 million infections and over 2.6 million deaths have been reported worldwide. Majority of the subjects have asymptomatic infections. The rate of fatality is disproportionately high in the elderly and patients with comorbidities such as diabetes, cardiac disease, and kidney disease [3,4]. The consequences of the pandemic are fraught with potential loss of lives, social and economic distress, and the uncertainty of disease progression because of variable individual pathogenesis.
A unique and deregulated immune response has been shown to be a hallmark of COVID-19 [5-9]. The figure given below schematically depicts the cascade of events that contribute to the progression of disease. Mathematical models have been utilized by several investigators to understand the mechanisms of disease pathogenesis, immune pathways involved and course of viral infections [10,11]. In this article, we have proposed a predictive model that utilizes the levels of clinical and laboratory parameters to determine the severity of clinical outcomes ranging from asymptomatic to mild, moderate, severe, and critical disease states. The proposed model can be useful to predict clinical outcome at the individual-level and develop efficient and effective treatment strategies to manage public health challenges at the population- level.
The questions the model attempts to answer are: at an individual level, what is the probability of an individual infected with SARS- CoV-2, given the clinical signs and laboratory values on various days, likely to progress to severe disease; at a population level, what are the prioritized clinical and laboratory parameters that are most likely to contribute to progression to severe disease. We have used a multiple regression based model to predict severity of the outcome of COVID-19. To evaluate the combinatorics that are not observed in the sample, we have applied resampling methods based on monte carlo simulation (Figure 1).
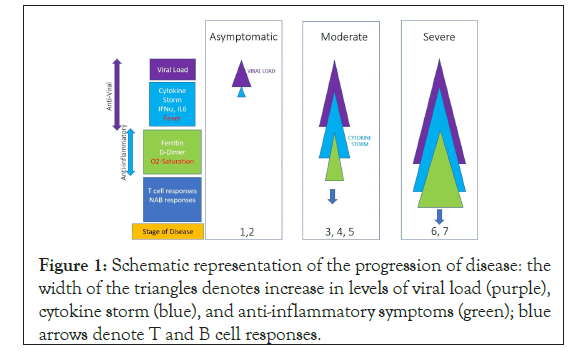
Figure 1: Schematic representation of the progression of disease: the width of the triangles denotes increase in levels of viral load (purple), cytokine storm (blue), and anti-inflammatory symptoms (green); blue arrows denote T and B cell responses.
Materials and Methods
Development of a simulated dataset
A simulated data set of 45 individual subjects was created with 15 subjects assumed to be asymptomatic, 15 with moderate disease, and 15 with severe COVID-19 [12-57]. The simulated values for the viral and immune parameters were generated using data from clinical reports published in the last year for each of the selected parameters. This table provides the ranges and the related references for the values for all parameters and figure shows the box-and-whisker plots for the distribution of the values for each parameter (Table 1) (Figure 2).
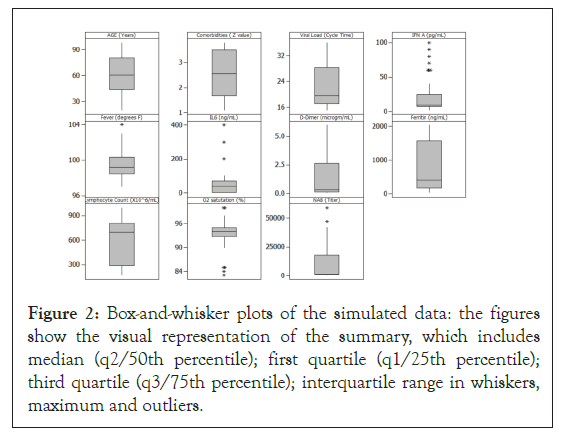
Figure 2: Box-and-whisker plots of the simulated data: the figures show the visual representation of the summary, which includes median (q2/50th percentile); first quartile (q1/25th percentile); third quartile (q3/75th percentile); interquartile range in whiskers, maximum and outliers.
| Parameter | Unit | Reference | COVID-19 ranges | COVID-19 ranges | COVID-19 ranges |
|---|---|---|---|---|---|
| Asymptomatic | Moderate | Severe | |||
| Viral load | Cycle time | Afzal A [20] | >28 | 20-15 | 22-16 |
| IFNaa | pg/mL | McNab F, et al. Buszko M, et al [45,46] | <10 | 10-100 | 10-2 |
| Fever | °F | Qian Z, et al. Kronbichler A, et al. [55,56] | 97-98.6 | 98.6-100 | 100-104 |
| D-dimer | μg/mL | Chi Y, et al. [31] | <0.1 | 0.15-0.62 | 0.5-9.3 |
| Ferritin | ng/L | Chi Y, et al. [31] | 20-200 | 286-1275 | 1400-2000 |
| Oxygen saturation | % | Huang C, et al. Kronbichler A, et al. [3,56] | 95-100 | 85-94 | 60-84 |
| IL-6 | ng/mL | McNab F, et al. Buszko M, et al. [45,46] | <1 | 19-76 | 19-430 |
| Lymphocyte count | x106/mL | Zhou Z, et al. [27] | >785 | 588-785 | 169-415 |
| NAB | Titer | Zhao J, et al. [57] | 1000-45000 | 200-20000 | 500-60000 |
The range of comorbidities was assigned arbitrary nominal value between 1 to 4, with 1 being healthy, and 4 having multiple health-conditions (examples: diabetes, cancer etc). The age ranges in the model were 18-100 years.
Table 1: Ranges of values for the parameters used for developing the simulated dataset for the mathematical model.
Data modeling
We have applied multiple linear regression approach to the simulated data set for COVID-19 subjects generated and analyzed to understand the impact of each of the parameters on the outcome of disease severity. We chose a multiple regression model since both, the outcomes and predictors, were numeric. We used regression models to establish a predictive transfer function and evaluated significance of results. In this model, the relationship between independent variables (x1, x2…xn) with dependent variable (y) can be visualized by the equation, y=f (x1, x2…xn). This is the transfer function that is derived through analysis. The validity of the model was established using ‘Goodness of Fit’ and ANOVA. The statistical significance of the model was tested by evaluating residuals and F Ratio in one-way ANOVA, based on the criteria of p<0.05 and goodness-of-fit with adjusted R-squared>90%. The assumption for this analysis was that each of the parameters was independent. However, in cases where factual patient datasets will be subjected to this type of analysis, there may be multi-co-linearity within the parameters that should be rationalized using dimensionality reduction methods [14,15].
Since the model may not exhibit multiple combination of parameters in the limited dataset of 45 subjects, we have used resampling methods using monte carlo simulation to achieve a better density of combinations. The simulation was applied for resampling of the transfer function with 2000 runs, where a convergence was achieved after multiple runs. The simulation was performed in order to understand the impact of possible parameter combinations on clinical outcomes. Monte carlo simulation uses random variates from selected range of values to model the impact of progression of events leading to outcomes.
Data analysis using training and testing data sets
Model building involved partitioning the data set into ‘training’ and ‘testing’ sets. We apportioned 70% of the data to train the model and used the remaining 30% to test the model, using random selection algorithms. Following development of the model, we analyzed a set of test data to compare predicted versus observed results to validate the model. The regression model generated a prediction formula as follows:
Outcome= -36.898-0.020 AGE+0.894 COMORBID-0.048 Viral Load-0.004 IFN+0.444 Fever -0.003 IL6+0.271 D-Dimer+0.000 Ferritin-0.000 Lymphocyte Count-0.037 O2 saturation- 2.57034e-006 NAB
The linear coefficients of the prediction equation determined the weights of each parameter to predict the clinical outcome.
Estimation of the coefficients of input parameters
The modeling approach was based on utilizing clinical and laboratory parameters to fit the regression models. Since direct comparison of regression coefficients was not necessary, and interactions in factors were not considered on account of assumption of independence of factors, we chose to leave the factor-data in the original scales.
Rationale for the parameters included in the analysis
The input parameters selected for this model, which requires cause (clinical and laboratory parameters) and effect (clinical outcome) relationships, were based on the data reported in recent scientific publications. The Figure 1 shows the schematic representation of the stage of disease progression and parameters associated with the increasing severity of diseases. The following parameters were chosen:
Comorbidities: Though the precise mechanism(s) of disease progression in patients with comorbidities has yet to be elucidated, pre-existing conditions such as diabetes, cancer, neurological, cardiac and lung and kidney disease have been reported to contribute towards severity of COVID-19 [16,17]. The simulated data for comorbidity was generated using an arbitrary range of 1 to 4, where 1 represented a healthy individual and 4 represented an individual with a severe co-morbidity.
Age: A range of 18 to 100 years was utilized for generating the mock data set. The assumption used in generating the data was that disease progression was directly proportional to age [17]. Reports of certain rare pathogenic conditions in children, example Kawasaki disease, have not been considered in the current model [18,19]. Reports indicate that majority of children infected with SARS-CoV-2 are asymptomatic [19].
Viral load: SARS-CoV-2 infects individuals through the nasopharyngeal pathway. This infection is the cause of all subsequent effects. Viral load is measured by reverse-transcriptase quantitative PCR (RT-qPCR), which detects viral RNA from nasopharyngeal swabs [20]. The test relies on multiple cycles of RNA amplification to produce detectable amount of RNA in the mixed nucleic acid sample, reflected in the Cycle-time (Ct) value, which is defined as the number of cycles necessary to detect the virus. A Ct value of less than 20 is considered a high viral load while a Ct value of 35 and higher indicates a lower level or near absence of viral infection [20]. Viral load in patients is dependent on various factors, including number of ACE2 and TMPRSS2 receptors, comorbidities, cytokines, number of viral particles at infection, and the overall immune health status of the patients [21-26]. Viral loads have been demonstrated to have a direct correlation with severity of disease and mortality in COVID-19 [27,28].
Cytokine Storm: High viral loads evoke defensive mechanisms that can induce inflammation leading to a dysregulated innate immune response that could result in a cytokine storm characterized by fever-inducing levels of cytokines such as IL6, IFNα, IL1α and CXCL-10 [27,29-33]. CXCL-10, interestingly was also found to be indicative of severe outcomes in patients affected by the SARS CoV1 outbreak in 2002 [34]. Cytokine storm has been implicated in contributing to pulmonary immunopathology, leading to severe clinical disease and mortality. In this model, we have included levels of IFN and IL6 obtained from the published data.
Systemic Inflammation: Laboratory based parameters indicating inflammation in the serum, such as D-dimer and Ferritin, have been shown to lead to a reduction in blood oxygen saturation levels, reflecting inadequate oxygenation in the lungs [35,36].
Lymphopenia: Viral infection can lead to marked lymphopenia that can affect both CD4+ and CD8+ T cells [3,28,36]. Lymphopenia, reflected by significantly reduced CD4 and CD8 T cells in peripheral blood, is likely due to sequestration and cell death and reflected by significantly reduced CD4 and CD8 T cells in peripheral blood, has been reported in moderate and severe COVID-19 patients. In addition, antigen specific CD8 Cytotoxic T lymphocyte (CTL) responses have been detected approximately a week following viral infection, and the magnitude of the response was observed to have protective or damaging effects [37].
Neutralizing antibodies: Neutralizing antibodies bind to specific surface receptors on infectious agents such as viruses and toxins, reducing or eliminating their ability to exert harmful effects on cells. SARS-CoV-2 infected individuals generate a robust and long-lasting neutralizing antibody response, and plasma from convalescent COVID-19 patients has been used for treatment of severe disease with some success [38,39]. It has recently been reported that neutralizing antibodies to SARS-CoV-2 can predict severity and survival, with higher titers being associated with severe disease in some instances [40].
Results
We evaluated multiple approaches to develop mathematical models using parameters that can predict the progression of disease. Candidate parameters were selected from mechanistic understanding of the process of pathogenesis of COVID-19 to evaluate their possible impact on the clinical outcome. Regression models utilize data to build predictive models. Hypotheses are examined and confirmed with pre-determined statistical confidence and inferential power. These models incorporate all the experimental variability in the data set. Since the models contained numeric factors and numeric ordinal outcomes, we utilized methods of Multiple Linear Regression [41]. In this approach, we used the simulated data set from COVID-19 affected subjects, organized, and analyzed it to understand the variability of each of the parameters.
Regression modeling approach
The data set was parsed into training and testing partitions using methods of randomization. The validity of the model was based on goodness-of-fit of R-squared>90% and ANOVA, [p value<0.05] and a consequent F Ratio. These statistical results confirmed acceptable degree of predictability of the model (Tables 2a and 2b).
| Source | DF | SeqSS | AjdSS | AdjMS | F | p |
|---|---|---|---|---|---|---|
| Regression | 11 | 13.172 | 139.172 | 12.652 | 10.259 | 0 |
| Age | 1 | 116.579 | 0.095 | 0.095 | 0.817 | 0.337 |
| Comborbid | 1 | 10.085 | 0.175 | 0.175 | 1.5 | 0.231 |
| Viral load | 1 | 0.172 | 0.392 | 0.392 | 3.357 | 0.078 |
| IFNaa | 1 | 1.037 | 0.136 | 0.135 | 1.161 | 0.291 |
| Fever | 1 | 8.159 | 0.378 | 0.378 | 3.238 | 0.083 |
| IL6 | 1 | 0.808 | 0.172 | 0.171 | 1.469 | 0.236 |
| D-dimer | 1 | 1.511 | 0.444 | 0.444 | 3.799 | 0.062 |
| Ferritin | 1 | 0.574 | 0.098 | 0.098 | 0.839 | 0.368 |
| Lymphocyte count | 1 | 0.018 | 0.039 | 0.039 | 0.334 | 0.568 |
| Oxygen saturation | 1 | 0.91 | 0.133 | 0.133 | 1.141 | 0.295 |
| Nab | 1 | 0.039 | 0.039 | 0.039 | 0.337 | 0.566 |
The statistical terms are: DF (degrees of freedom); SeqSS (sequential sum square); AdjSS (adjusted sum square), AdjMS (adjusted mean squares), F ratio, p value.
Table 2a: Statistical analysis of coefficients for each parameter based on the multiple regression analysis.
Following this multiple-regression analysis, we conducted 2,000 bootstrap samplings using the predicted coefficients and random variates from chosen intervals of parameters. The assumption for this analysis was that each of the parameters was of independent variables. The coefficients of each parameter were determined by using multiple regression analyses, which is the multiplier to the parameter value in a linear regression equation. The inclusion of all the variables in analysis ensures their contribution to the model [41]. However, analysts applying this model in the future may, at their judgment, evaluate statistical significance of regression coefficients. Parameters that are not significant maybe excluded using step wise regression. In our analysis, results based on training dataset predictors matched with those from the test dataset confirming an acceptable degree of predictability of the model. We invite the readers of this article to contact us to analyze the predictive potential of the model using their data.
| Term | Coefficient | Standard error | t | p |
|---|---|---|---|---|
| Constant | -36.898 | 24.867 | -1.484 | 0.15 |
| Age | -0.021 | 0.023 | -0.904 | 0.374 |
| Comborbid | 0.894 | 0.73 | 1.225 | 0.232 |
| Viral load | -0.048 | 0.026 | -1.832 | 0.078 |
| IFNaa | -0.005 | 0.005 | -1.077 | 0.291 |
| Fever | 0.444 | 0.247 | 1.799 | 0.084 |
| IL6 | -0.003 | 0.003 | -1.212 | 0.236 |
| D-dimer | 0.271 | 0.139 | 1.949 | 0.062 |
| Ferritin | 0.000 | 0.001 | 0.916 | 0.368 |
| Lymphocyte count | -0.001 | 0.001 | -0.578 | 0.568 |
| Oxygen saturation | -0.038 | 0.036 | -1.068 | 0.295 |
| Nab | 0.000 | 0.000 | -0.58 | 0.567 |
| Error | 26 | 3.039 | 3.039 | 0.117 |
| Total | 37 | 142.211 |
The coefficients for each parameter were determined by using multiple regression analyses, which is the multiplier to the parameter value in a linear regression equation. The values of the coefficients of each of the parameters are shown using ANOVA. The table shows the standard error, t and p values. The p value denotes statistical significance to the outcome.
Table 2b: Coefficient and standard error for parameters.
Monte carlo simulation
To determine the factors that contribute to the clinical outcome at the population level, monte carlo simulation was performed on a sample set of laboratory and clinical parameters covering the full range, from asymptomatic to severe disease, of outcomes in Figures 1-4 [12,13]. The histogram and cumulative data show the distribution of asymptomatic to severe outcomes. The tornado chart shows the sensitivity of parameter to the outcome in the selected range (Figures 3a and 3b).
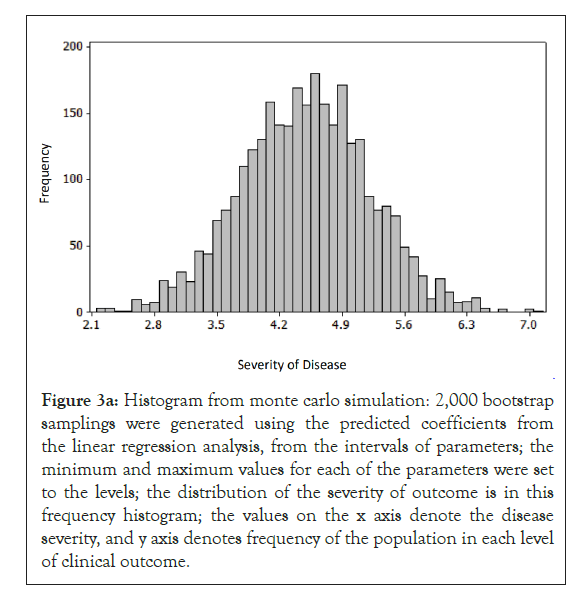
Figure 3a: Histogram from monte carlo simulation: 2,000 bootstrap samplings were generated using the predicted coefficients from the linear regression analysis, from the intervals of parameters; the minimum and maximum values for each of the parameters were set to the levels; the distribution of the severity of outcome is in this frequency histogram; the values on the x axis denote the disease severity, and y axis denotes frequency of the population in each level of clinical outcome.
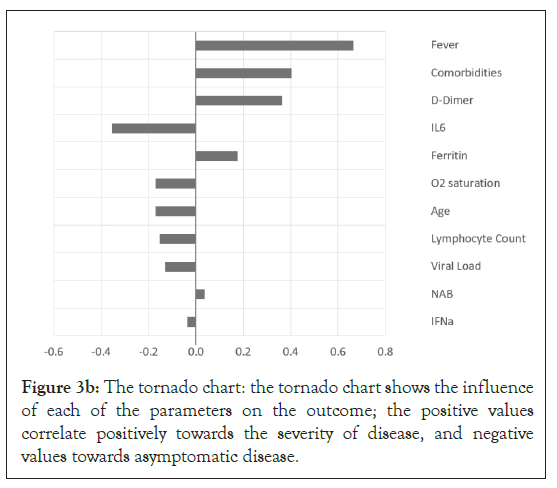
Figure 3b: The tornado chart: the tornado chart shows the influence of each of the parameters on the outcome; the positive values correlate positively towards the severity of disease, and negative values towards asymptomatic disease.
The predictive model
Based on the correlation coefficient of the parameters and the outcome from the training data set, we developed a model using the prediction equation. The table shows the process of predicting the outcome. When the numerical values of the individual parameters for each patient are entered into the columns, the model predicts the outcome. The validation of the model will require data from patients and clinical trials. The goal of this exercise was to develop a model that can be used to predict the outcome in a large number of patients (Figure 4) (Table 3).
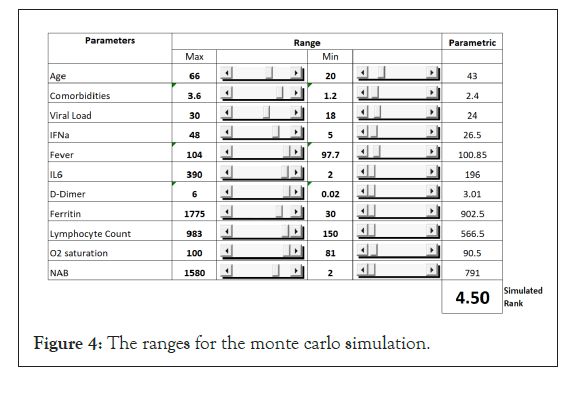
Figure 4: The ranges for the monte carlo simulation.
| Variable | Subject 1 | Subject 2 | Subject 3 | Subject 4 | Subject 5 | Subject 6 | Subject 7 |
|---|---|---|---|---|---|---|---|
| Age | 20 | 52 | 55 | 55 | 62 | 73 | 80 |
| Comborbid | 1.1 | 2.2 | 2.3 | 2.4 | 2.6 | 3.2 | 3.5 |
| Viral Load | 36 | 19 | 16 | 15 | 17 | 21 | 17 |
| IFNaa | 7 | 20 | 50 | 60 | 40 | 9 | 5 |
| Fever | 98.6 | 99.1 | 99.8 | 100 | 99.4 | 100.1 | 100 |
| IL6 | 1 | 30 | 60 | 70 | 50 | 50 | 90 |
| D-dimer | 0.05 | 0.25 | 0.4 | 0.45 | 0.35 | 1.5 | 4 |
| Ferritin | 30 | 350 | 800 | 1275 | 500 | 1500 | 1800 |
| Lymphocyte count | 800 | 740 | 620 | 580 | 640 | 340 | 200 |
| Oxygen saturation | 100 | 95 | 83 | 85 | 90 | 95 | 94 |
| NAB | 2 | 20 | 150 | 200 | 100 | 220 | 400 |
| Calculated outcome rank | 0.723 | 3.299 | 4.008 | 4.237 | 3.228 | 4.916 | 6.427 |
| Predicted | 1 | 3 | 4 | 4 | 3 | 5 | 6 |
| Observed | 1 | 3 | 4 | 4 | 4 | 5 | 6 |
The values of the parameters for each of the seven subjects are entered in columns, upon running of the model. The predicted values are calculated in numerical values in a range of 1-7, with 1 being asymptomatic, and 7 most severe.
Table 3: The prediction of outcome based on observed and predicted values.
Discussion
We have evaluated multiple regression analysis for mathematically modeling the course of COVID-19 to predict clinical outcome. The premise of this model is that quantitatively measured clinical and laboratory parameters involved in the pathogenesis of disease progression can be mathematically mapped to a multiple-regression model. COVID-19 is initiated by infection of the subject with SARS-CoV-2 with subsequent replication in the epithelial cells of the lung. The factors that contribute to the viral load include number of cells that express the ACE2 and other receptors, and inflammatory cytokines. Comorbidities contribute towards a more serious disease progression. Virus infection of antigen presenting cells, such as dendritic cells, macrophages, and other cell types including endothelial cells, result in activation of biochemical signals, which lead to secretion of a battery of cytokines that include IL1α and IL-6. The viral infection as well as inflammatory cytokines causes fever and an increase in serum inflammatory factors such as D-Dimer and Ferritin. Induction of an inflammatory response contributes to reduction of the total numbers of lymphocytes from circulation. The inflammation results in a loss of lung function (example: reduction in blood-oxygen levels), cardiac function (blood pressure) and can culminate in multi-organ failure.
Subjects with a normal immune response can generally mount an adequate innate and adaptive response to the virus. These individuals clear the virus by generating adaptive T cell responses and neutralizing antibodies. Subjects with comorbid conditions can have compromised immune function which could result in dysfunctional activation of inflammatory responses, leading to worse clinical outcomes.
Selection of the parameters that were included in the model building process was influenced by their perceived significance from current research reports. This list of factors is by no means complete and it is expected that in due course a more comprehensive list will emerge. This report provides a basis for creating a tool, independent of the number and type of parameters that could find utility in predicting the disease outcome using those parameters.
Viral Load: Association of viral load and progression of diseases has been reported for several viral infections [42-44]. Viral load in COVID-19 is measured by qRT-PCR of SARS-CoV-2 using primers for the spike gene [43]. The correlation of high viral load with severity of disease progression has been extensively demonstrated. The systemic dissemination of the virus has been associated with expression of the ACE2 receptor on endothelial cells [21]. Comorbid conditions could enhance the expression of receptors and enable distribution of virus, thereby enhancing the viral load, which can result in progression of disease.
IFN: The critica l r ole of T ype I i n terferons in in nate and adaptive immunity, leading to both protective and pathogenic responses, has been reported in the case of several viral and bacterial infections [45]. SARS-CoV-2 infection has been shown to result in a diverse range of effects on Type I immune responses. Most patients elicit a strong IFN response along with a battery of inflammatory cytokines, some of which progress to a cytokine storm [46,47]. Specific blocking of the type I mediated signal transduction by various proteins of SARS-CoV-2 has been demonstrated [48]. A remarkably high proportion of male subjects experiencing severe or critical COVID-19 disease expressed an inability to produce sufficient levels of IFN due to various types of errors in the IFN genes. Curiously, majority of the male subjects possessed circulating IFN autoantibodies that had the ability to neutralize the endogenously produced cytokine, thereby effectively reducing the available IFN. The discovery of these two mechanisms for lowering IFN levels underscores i ts relevance in controlling the progression of disease in individuals infected with the SARS-CoV-2 [49].
D-dimer: D-dimer is routinely measured in clinical situations because its levels correlate with serious underlying conditions including venous thromboembolism, cancer and sepsis [48]. In the case of COVID-19 patients, introduction of the virus brings about infection-induced inflammatory alterations leading to coagulopathy. Lungs being the target of SARS-CoV-2, acute injury to the lung as well as multi organ failure have been caused by the virus-induced cascade of the inflammatory pathway. In an early study on 41 COVID-19 patients, those with severe disease had higher levels of D-dimer along with high levels of IL-8, TNF and IL-2R [31]. Male patients were found to have higher levels of IL- 6, IL-2R, Ferritin and other markers of inflammation compared to female. High levels of IL-6 showed a statistically significant correlation with severe disease in a retrospective study as well [27]. One can hypothesize that such patients would likely benefit from anticoagulation therapy.
Ferritin: A high level of ferritin, measure of stored iron, was found to be associated with severe disease in COVID-19 patients and was linked to high fatality rates in a 72 patient prospective study [33,50,51]. In another study on 39 patients, those with mild COVID-19 symptoms had lower levels of ferritin while those with moderate or severe symptoms expressed higher levels of ferritin [50].
Lymphopenia: Loss of lymphocytes after viral infections has been associated with severe disease. The mechanisms involved in lymphodepletion can been implicated to be due to cell death, cytokine storm and/or redistribution of lymphocyte populations [3,33,37]. In this model, we have utilized lymphopenia as a measure of severity of disease progression. Loss of immune function could result in several potential mechanisms of pathogenesis including autoimmunity, hyperactivation, increased susceptibility to infections and organ dysfunction.
Neutralizing antibodies: Induction of neutralizing antibodies directed to the receptor-binding domain of the spike protein is critical for restricting entry of the virus into the cells and has been one of the central tenets of a protective immune response. In this model, we have used a range of IgG titers to spike protein for the simulated data set [52]. However, the role of neutralizing antibodies induced in a large proportion of subjects following natural infection is still being studied [53]. Some subjects do not elicit strong antibody responses. Sub-optimal levels of antibodies may catalyze generation of virus mutants [54]. Neutralizing antibodies to the virus have generally not correlated with reduced severity of disease in the primary infection. In addition, it will be interesting to decipher the role of pre-existing antibodies reported recently in the modulation of disease and its impact on vaccination regimens. Thus, the mechanisms involved in the induction of antibodies, the repertoire and diversity of responses, and effects on protection versus progression, remains to be clearly established [55-57].
The predictive model can have multiple applications, such as forecasting the percentage of the population that will progress to severe disease in each geography, enabling logistics planning for hospital beds, health care providers and personal-protective safety equipment. Analysis of the coefficient of correlations of parameters with outcome of disease may provide clues to a better understanding of the mechanism of action of disease pathogenesis. The model can predict the probability of disease progression at an individual level, based on parameter data, and can be used to understand the effect and impact of therapeutic interventions. The predictive model can be utilized to analyze large amounts of data to develop algorithms for personalized treatment regimens.
Conclusion
In conclusion, we have developed a probabilistic model that can be utilized to predict progression of disease following infection with SARS-CoV-2. This model was developed using simulated data based on published levels of COVID-19 related clinical and laboratory parameters and provides an approach to predicting the outcome of disease. Validation of the model will require existing data and the clinical outcomes of patients. Prediction of disease progression can be highly valuable at an individual as well as population level.
Acknowledgement
VRN is partly supported by a grant (P30GM114737) from the Centers of Biomedical Research Excellence, National Institute of General Medicine, National Institutes of Health.
Conflict of Interest
Narendra Chirmule and Ravindra Khare are employed by SymphonyTech Biologics Inc, and own stock in the company; the opinions of Pradip Nair do not represent those of Biocon; Bela Desai, Vivek Nerurkar and Amitabh Gaur do not have any conflict of interest.
REFERENCES
- Centers for Disease Control and Prevention. Coronavirus 2020. 2021.
- World Health Organization. Coronavirus (COVID-19) dashboard. 2020.
- Huang C, Wang Y, Li X, Ren L, Zhao J, Hu Y, et al. Clinical features of patients infected with 2019 novel coronavirus in wuhan, china. The Lancet. 2020;395(10223):497-506.
- Kim GU, Kim MJ, Ra SH, Lee J, Bae S, Jung J, et al. Clinical characteristics of asymptomatic and symptomatic patients with mild covid-19. Clin Microbiol Infect. 2020; 26(7):948e1-948e3.
- Cervantes LK, Pampena MB, Meng W, Rosenfeld AM, Ittner CAG, Weisman AR, et al. Comprehensive mapping of immune perturbations associated with severe covid-19. Sci Immunol. 2020;5(49): eabd7114.
- Cervantes LK, Pampena MB, Meng W, Rosenfeld AM, Ittner CAG, Weisman AR, et al. Immunologic perturbations in severe covid-19/sars-cov-2 infection. BioRxiv. 2020.
- Vabret N, Britton GJ, Gruber C, Hegde S, Kim J, Kuksin M, et al. Immunology of covid-19: current state of the science. Immunity. 2020;52(6):910-941.
- Zheng HY, Zhang M, Yang CX, Zhang N, Wang XC, Yang XP, et al. Elevated exhaustion levels and reduced functional diversity of t cells in peripheral blood may predict severe progression in covid-19 patients. Cell Mol Immunol. 2020;17(5):541-543.
- Moderbacher CR, Ramirez SI, Dan JM, Grifoni A, Hastie KM, Weiskopf D, et al. Antigen-specific adaptive immunity to sars-cov-2 in acute covid-19 and associations with age and disease severity. Cell. 2020;183(4):996-1012.e19.
- Norton KA, Gong C, Jamalian S, Popel AS. Multiscale agent-based and hybrid modeling of the tumor immune microenvironment. Processes (Basel). 2019;7(1):37.
- Foy BH, Gonçalves BP, Higgins JM. Unraveling disease pathophysiology with mathematical modeling. Annu Rev Pathol. 2020;15(1):371-394.
- Zhang C, Qin L, Li K, Wang Q, Zhao Y, Xu B, et al. A novel scoring system for prediction of disease severity in covid-19. Front Cell Infect Microbiol. 2020;10(1):318.
- Cadegiani FA, Zimerman RA, Campello de Souza B, McCoy J, Pereira ECRA, Gustavo Wambier C, et al. The androcov clinical scoring for covid-19 diagnosis: a prompt, feasible, costless, and highly sensitive diagnostic tool for covid-19 based on a 1757-patient cohort. Cureus. 2021;13(1):e12565.
- Booth AL, Abels E, McCaffrey P. Development of a prognostic model for mortality in covid-19 infection using machine learning. Mod Pathol. 2020; 34(1):522-531.
- Ko J, Baldassano SN, Loh PL, Kording K, Litt B, Issadore D. Machine learning to detect signatures of disease in liquid biopsies - a user's guide. Lab Chip. 2018;18(3):395-405.
- Pinto BGG, Oliveira AER, Singh Y, Jimenez L, Gonçalves ANA, Ogava RLT, et al. Ace2 expression is increased in the lungs of patients with comorbidities associated with severe covid-19. J Infect Dis. 2020;222(4):556-563.
- Bonafe M, Prattichizzo F, Giuliani A, Storci G, Sabbatinelli J, Olivieri F. Inflamm-aging: why older men are the most susceptible to sars-cov-2 complicated outcomes. Cytokine Growth Factor Rev. 2020; 53(1):33-37.
- Feldstein LR, Rose EB, Horwitz SM, Collins JP, Newhams MM, Son MBF, et al. Multisystem inflammatory syndrome in u.s. children and adolescents. N Engl J Med. 2020;383(4):334-346.
- Centers for Disease Control and Prevention. Covid-19 in children and teens. 2020.
- Afzal A. Molecular diagnostic technologies for covid-19: limitations and challenges. J Adv Res. 2020;26(1):149-159.
- Ratajczak MZ, Bujko K, Ciechanowicz A, Sielatycka K, Cymer M, Marlicz W, et al. Sars-cov-2 entry receptor ace2 is expressed on very small cd45(-) precursors of hematopoietic and endothelial cells and in response to virus spike protein activates the nlrp3 inflammasome. Stem Cell Rev Rep. 2021: 17(1):266-277.
- Lukassen SO, Chua RL, Trefzer T, Kahn NC, Schneider MA, Muley T, et al. Sars-cov-2 receptor ace2 and tmprss2 are primarily expressed in bronchial transient. Embo J. 2020;39(10):e105114.
- Hirano T, Murakami M. Covid-19: a new virus, but a familiar receptor and cytokine release syndrome. Immunity. 2020;52(5):731-733.
- Hoffmann M, Weber HK, Schroeder S, Krüger N, Herrler T, Erichsen S, et al. Sars-cov-2 cell entry depends on ace2 and tmprss2 and is blocked by a clinically. Cell. 2020;181(2):271-280.e8.
- Finkel Y, Mizrahi O, Nachshon A, Gabbay SW, Morgenstern D, Ronen YY, et al. The coding capacity of Sars-cov-2. Nature. 2020;589(7840):125-130.
- Wang K, Chen W, Zhang Z, Deng Y, Lian JQ, Du P, et al. Cd147-spike protein is a novel route for Sars-cov-2 infection to host cells. Signal Transduct Target Ther. 2020;5(1):283.
- Zhou Z, Ren L, Zhang L, Zhong J, Xiao Y, Jia Z, et al. Heightened innate immune responses in the respiratory tract of covid-19 patients. Cell Host Microbe. 2020;27(6):883-890.e2.
- To KK, Tsang OT, Leung WS, Tam AR, Wu TC, Lung DC, et al. Temporal profiles of viral load in posterior oropharyngeal saliva samples and serum antibody responses during infection by sars-cov-2: an observational cohort study. Lancet Infect Dis. 2020;20(5):565-574.
- Azkur AK, Akdis M, Azkur D, Sokolowska M, Veen WVD, Brüggen MC, et al. Immune response to sars-cov-2 and mechanisms of immunopathological changes in covid-19. Allergy. 2020;75(7):1564-1581.
- Catanzaro M, Fagiani F, Racchi M, Corsini E, Govoni S, Lanni C. Immune response in covid-19: addressing a pharmacological challenge by targeting pathways triggered by sars-cov-2. Signal Transduction and Targeted Therapy. 2020;5(1):84.
- Chi Y, Ge Y, Wu B, Zhang W, Wu T, Wen T, et al. Serum cytokine and chemokine profile in relation to the severity of coronavirus disease 2019 in china. J Infect Dis. 2020;222(5):746-754.
- Diamanti AP, Rosado MM, Pioli C, Sesti G, Laganà B. Cytokine release syndrome in covid-19 patients, a new scenario for an old concern: the fragile balance between infections and autoimmunity. Int J Mol Sci. 2020;21(9):3330.
- Grifoni A, Weiskopf D, Ramirez SI, Mateus J, Dan JM, Moderbacher CR, et al. Targets of t cell responses to sars-cov-2 coronavirus in humans with covid-19 disease and unexposed individuals. Cell. 2020;181(7):1489-1501.e15.
- Ernst D, Bolton G, Recktenwald D, Cametron MJ, Danesh A, Persad D, et al. In: YW Tang, CW Stratton (eds) Bead based flow cytometric assays : a multiplex assay platform with applications in diagnostic microbiology. In: Advanced techniques in diagnostic microbiology, Springer, NewYork, United States. 2006:427-443.
- Bassoli C, Oreni L, Ballone E, Foschi A, Perotti A, Mainini A, et al. Role of serum albumin and proteinuria in patients with sars-cov-2 pneumonia. Int J Clin Pract. 2021;75(4):e13946.
- Pernía SP, Pérez LG, Sevilla ÁFR, Gil JS, Canales SN. Absolute lymphocytes, ferritin, c-reactive protein, and lactate dehydrogenase predict early invasive ventilation in patients with covid-19. Lab Med. 2021;52(2):141-145.
- Chen Z, John Wherry E. T cell responses in patients with covid-19. Nat Rev Immunol. 2020;20(9):529-536.
- Wajnberg A, Amanat F, Firpo A, Altman DR, Bailey MJ, Mansour M, et al. Robust neutralizing antibodies to sars-cov-2 infection persist for months. Science. 2020;370(6521):1227-1230.
- Bloch EM, Shoham S, Casadevall A, Sachais BS, Shaz B, Winters JL, et al. Deployment of convalescent plasma for the prevention and treatment of covid-19. J Clin Invest. 2020;130(6):2757-2765.
- Legros V, Denolly S, Vogrig M, Boson B, Siret E, Rigaill J, et al. A longitudinal study of sars-cov-2-infected patients reveals a high correlation between neutralizing antibodies and covid-19 severity. Cell Mol Immunol. 2021;18(2):318-327.
- Box GE, Hunter W, Hunter S. In: Statistics for experimenters: design, discovery and innovation (2nd edn), Wiley-Interscience, USA. 2005;672.
- Piyathilake CJ, Badiga S, Burkholder GA, Harada S, Raper JL. The accuracy of hpv genotyping in isolation and in combination with cd4 and hiv viral load for the identification of hiv-infected women at risk for developing cervical cancer. Cancer Med. 2021;10(5):1900-1909.
- Bland J, Kavanaugh A, Hong LK, Kadkol SS. Development and validation of viral load assays to quantitate sars-cov-2. J Virol Methods. 2021;291(1):114100.
- Romeo F, Uriarte EL, Delgado SG, Altamiranda EG, Pereyra S, Morán P, et al. Effect of bovine viral diarrhea virus on subsequent infectivity of bovine gammaherpesvirus 4 in endometrial cells in primary culture: an in vitro model of viral co-infection. J Virol Methods. 2021;291(1):114097.
- McNab F, Barber KM, Sher A, Wack A, O'Garra A. Type I interferons in infectious disease. Nat Rev Immunol. 2015;15(2):87-103.
- Buszko M, Park JH, Verthelyi D, Sen R, Young HA, Rosenberg AS. The dynamic changes in cytokine responses in covid-19: a snapshot of the current state of knowledge. Nat Immunol. 2020;21(10):1146-1151.
- Cardone M, Yano M, Rosenberg AS, Puig M. Lessons learned to date on covid-19 hyperinflammatory syndrome: considerations for interventions to mitigate sars-cov-2 viral infection and detrimental hyperinflammation. Front Immunol. 2020;11(1):1131.
- Vabret N, Britton GJ, Gruber C, Hegde S, Kim J, Kuksin M, et al. Immunology of covid-19: current state of the science. Immunity. 2020;52(6):910-941.
- Zhang Q, Bastard P, Liu Z, Le Pen J, Velez MM, Chen J, et al. Inborn errors of type I ifn immunity in patients with life-threatening COVID-19. Science. 2020;370(6515):eabd4570.
- Rusu D, Blaj M, Ristescu I, Patrascanu E, Gavril L, Lungu O, et al. Outcome predictive value of serum ferritin in icu patients with long icu stay. Medicina (Kaunas). 2020;57(1):1.
- Dahan S, Segal G, Katz I, Hellou T, Tietel M, Bryk G, et al. Ferritin as a marker of severity in covid-19 patients: a fatal correlation. Isr Med Assoc J. 2020;22(8):494-500.
- Mateus J, Grifoni A, Tarke A, Sidney J, Ramirez SI, Dan JM, et al. Selective and cross-reactive sars-cov-2 t cell epitopes in unexposed humans. Science. 2020;370(6512):89-94.
- Gentili M, Nachohen A. Surprising effects of antibodies in severe covid. Nature. 2021.
- Poeschla E. Neutralizing sars-cov-2. Elife. 2020;9.
- Qian Z, Travanty EA, Oko L, Edeen K, Berglund A, Wang J, et al. Innate immune response of human alveolar type II cells infected with severe acute respiratory syndrome-coronavirus. Am J Respir Cell Mol Biol. 2013;48(6):742-748.
- Kronbichler A, Kresse D, Yoon S, Lee KH, Effenberger M, Shin J, et al. Asymptomatic patients as a source of covid-19 infections: a systematic review and meta-analysis. Int J Infect Dis. 2020;98(1):180-186.
- Zhao J, Yuan Q, Wang H, Liu W, Liao X, Su Y, et al. Antibody responses to sars-cov-2 in patients of novel coronavirus disease 2019. Clin Infect Dis. 2020;71(16):2027-2034.
Citation: Chirmule N, Khare R, Nair P, Desai B, Nerurkar V, Gaur A (2021) Predicting the Severity of Disease Progression in COVID-19 at the Individual and Population Level: A Mathematical Model. J Clin Exp Pharmacol. 11:283.
Copyright: © 2021 Chirmule N, et al. This is an open-access article distributed under the terms of the Creative Commons Attribution License, which permits unrestricted use, distribution, and reproduction in any medium, provided the original author and source are credited.
