Indexed In
- Euro Pub
- Google Scholar
Useful Links
Share This Page
Journal Flyer

Open Access Journals
- Agri and Aquaculture
- Biochemistry
- Bioinformatics & Systems Biology
- Business & Management
- Chemistry
- Clinical Sciences
- Engineering
- Food & Nutrition
- General Science
- Genetics & Molecular Biology
- Immunology & Microbiology
- Medical Sciences
- Neuroscience & Psychology
- Nursing & Health Care
- Pharmaceutical Sciences
Research Article - (2024) Volume 8, Issue 4
Performance Evaluation of State-of-the-Art Texture Feature Extraction Techniques on Medical Imagery Tasks
Samuel Kusi-Duah*Received: 14-Feb-2023, Manuscript No. JCMS-23-19899; Editor assigned: 17-Aug-2023, Pre QC No. JCMS-23-19899 (PQ); Reviewed: 03-Mar-2023, QC No. JCMS-23-19899; Revised: 12-May-2023, Manuscript No. JCMS-23-19899 (R); Published: 19-May-2023
Abstract
Purpose: Interpreting medical images is certainly a complex task which requires extensive knowledge. According to Computer Aided Diagnosis (CAD) serves as a second opinion that will help radiologists in diagnosis and on the other hand content based image retrieval uses visual content to help users browse, search and retrieve similar medical images from a database based on the user’s interest. The competency of the CBMIR system depends on feature extraction methods. The textural features are very important to determine the content of a medical image. Textural features provide scenic depth, the spatial distribution of tonal variation, and surface orientation. Therefore, this study seeks to compare and evaluate some of the hand-crafted texture feature extraction techniques in CBMIR. This is to help those concerned in enhancing CBIR systems to make informed decisions concerning the selection of the best textural feature extraction techniques.
Approach: Since there is no clear indication of which of the various texture feature extraction techniques is best suited for a given performance metric when considering which of the techniques to choose for a particular study in CBMIR systems. The objective of this work, therefore, is to comparatively evaluate the performance of the following texture feature extraction techniques; Local Binary Pattern (LBP), Gabor filter, Gray-Level Co-occurrence Matrix (GLCM), Haralick descriptor, Features from Accelerated Segment Test (FAST) and Features from Accelerated Segment Test and Binary Robust Independent Elementary Features (FAST and BRIEF) using the metrics; precision, recall, F1-score, Mean Squared Error (MSE), accuracy and time. These techniques are coupled with specific similarity measure to obtain results.
Results: The results showed that LBP, Haralick descriptor, FAST, and GLCM had the best results in terms of (precision and accuracy), time, F1-score, and recall respectively. LBP had 82.05% and 88.23% scores for precision and accuracy respectively. The following scores represent the performance of the Haralick descriptor, FAST, and GLCM models respectively; 0.88s, 38.7%, and 44.82%. These test scores are obtained from datasets ranging from 1 k-10.5 k.
Conclusion: Aside from LBP outperforming the other 5 models mentioned, it still outperformed the following proposed models. Tamura texture feature and wavelet transform combined with Hausdorff distance in terms of (precision, accuracy, and recall) and (precision and recall) respectively and probably F1-score (since F1-score is the weighted average of precision and recall). It is believed that an ensemble of LBP, Haralick descriptors, and Support Vector Machine (SVM) can represent a robust system for both medical image retrieval and classification.
Keywords
Content based image retrieval; Medical image retrieval; Texture feature extraction; Evaluation metrics; Similarity measurement
Introduction
Technology has advanced in numerous ways and most computer scientists are eager to bridge the gap between the capabilities of mankind and machines [1]. This is to say that, these scientists want these machines to perceive and use the knowledge obtained in multitasking. This advancement has led to the development of self-driving cars, delivery drones, etc. and these are realized through a subfield of computer science known as Artificial Intelligence (AI). Computer science’s field of artificial intelligence offers a wide range of applications that have produced some truly remarkable 21st century technologies [2]. One of those areas this work focuses on is computer vision. The primary aim of Computer Vision (CV) is to make it possible for machines to perceive the world as humans do, including the information gained through performing tasks like viewing media recreation, image and video recognition, image analysis and classification, etc. some factors that have led to the evolution or rebirth of computer visioning includes [3].
• The need to share moments or events with distant family and friends led to the saturation of photos and videos all over the world using built-in cameras in technology such as smartphones.
• Recent enabling design of promising hardware with high computational power which is readily available for tasks such as computer visioning and image analysis.
• Availability of algorithms that take advantage of the hardware and software capabilities of recent computers [4].
Claims that thanks to the work of researchers in the field of computer vision, accuracy rates for object detection and classification have increased from 50% to 99% in less than ten years [5]. Due to the immense research done in the area of computer vision, sectors such as transportation, healthcare, manufacturing, construction, agriculture, retail, etc. have benefited a lot from the various tasks of computer vision [6]. That is from self-driving cars, medical imaging data processing, defect inspection or reading products barcode, predictive maintenance, crop, and yield monitoring, or plant disease detection to automatic replenishment of goods or items in realtime respectively [7].
However, in the healthcare sector, areas such as X-rays, dermatology, radiology, cardiology, High-Resolution Computed Tomography (HRCT), endoscopy, and Magnetic Resonance Imaging (MRI) heavily make use of medical digital images and by so doing managing and accessing these medical images from their repositories has become more complex [8]. Concerningly content-based or text-based, or even both methods have been put forth by various scholars to work on medical image retrieval systems. Based on a content based image retrieval system, its relevancy is judged by the kind of feature extraction technique used. Therefore, conducting this comparative analysis on some of the cutting edge texture feature extraction methods of Content Based Medical Image Retrieval (CBMIR) does suffice [9].
The paper is in eight sections:
• Introduces the content together with the background study which conclusively indicates the objectives of the research.
• Talks about the related works.
• Talks about the methodology carried out to achieve the said results in section 5.
• Provides the code and data source.
• Provides the results, analysis and discussion.
• Provides summary points of this study.
• Discloses any conflict of interests towards carrying out this research.
• Acknowledges the bodies that provided support to completing this research successfully together with the referencing materials and their source.
Background: A texture based image is built on visual patterns that have uniformity characteristics, not on the presence of a single color or intensity. The texture of tissues in medicine is meant to be uniform and constant. As a result, due to the accurate characterization of the texture properties that are seen in organs and other tissue anomalies, computer scientists frequently use texture features in the medical field. In that texture features, descriptors have been applied in various diagnoses such as brain tumor diagnosis and mass lesion detection in mammogram images. Thus texture based feature has been the best feature descriptor for easy discrimination amongst organ tissues in the CBIR system [10]. However, certain research on various CBMIR components undertaken by some computer scientists has indicated an improvement in the overall efficiency of the CBIR system. To enhance picture retrieval, some of these works concentrate on the feature extraction method and the combination of various feature descriptors. Some of these researchers used texture and shape features descriptors to represent the content of the images based on the idea that medical images, such as breast cancer and brain tumors except for ophthalmology, pathology and dermatology images that are typically in grayscale channels. Contrary to other feature descriptors like texture and shape, color features are used outside of the medical field since they are the most widely known feature to represent image content [11]. However, some of these works compared a few texture approaches on a limited dataset such as in and making it difficult for practitioners to make an informed choice on which of the various texture-based feature extraction approach to select at some point in time.
Therefore, this study aims to identify which cutting edge texture feature extraction approaches can ensure the stated level of invariance concerning CBIR in medicine [12].
The general objective is to comparatively evaluate the performance of the various texture feature extraction techniques for medical imagery retrieval.
• The following includes the specific objectives of this study.
• What state-of-the-art texture extraction method can be efficiently and effectively used for Content Based Medical Image Retrieval (CBIR).
• Evaluate the strength and weaknesses of the identified texture feature extraction techniques using the computational cost (time and space) as well as retrieval precision ad accuracies.
Related works
With respect to the increasing amount of medical imagery data has resulted in widespread dissemination of Picture Archiving and Communication Systems (PACS) in hospitals which requires a more efficient and effective retrieval methods for better management of such data [13]. There are currently two ways of retrieving medical images. These retrieval methods includes in text based image retrieval and content based image retrieval.
Text based medical image retrieval system: Refers to the technique that involves querying an image dataset with a text based search. This system can be traced back in the 1970’s. This system is prevalent in online web search.
Content based image retrieval: System makes use of image indexing based on their visual content i.e. (image features such as color, texture, shape etc.). With respect to medical images, texture features are useful because they reflect the details within an image structure. Initial contributions has it as medical images been included as a subdomain for trials in the content-based image retrieval systems.
The Table 1 below shows a summary report of some texture feature extraction techniques used in CBMIR.
| Proposed method | Results |
|---|---|
| A new gradient descriptor is created by creating a gradient vector from the co-occurrence matrix, whose indexes are values of |i-j| I and j are also co-occurrence matrix indexes), and whose content is the total number of occurrences in the elements with the same values of |i-j| in the co-occurrence matrix. | For queries looking for comparable photos up to 20% of the database, the retrieval accuracy for medical images was consistently over 90%. |
| A new and more effective feature selection approach in medical image retrieval system forming a hybrid technique. The "branch and bound algorithm", "artificial bee colony algorithm" and relevance feedback make up this hybrid technique. | The final retrieval result showed that while the vast majority of pertinent photos were located, the diversified density relevance feedback system failed to locate certain glaringly pertinent photographs. They proposed that more sophisticated algorithms may be used to increase relevancy. |
| A method for retrieving medical images that use the wavelet transform algorithm, tamura texture feature, and Hausdorff distance. | The proposed method outperforms a tamura feature texture and wavelet transform technique paired with Euclidean distance, according to the experiments. In the brain MRI trials, the average retrieval accuracy of the suggested strategy is greater than that of the other five approaches by up to 19.33%, 17.33%, 18%, 11.33%, and 6%. The average retrieval accuracy of the suggested strategy is greater than the other three ways for lung CT studies, coming in at more than 17.33%, 16%, 16.66%, 12% and 6.66%, respectively. |
Table 1: Summary report on some texture feature extraction techniques in CBMIR.
Materials and Methods
Experimental setup
System requirements for the various models implemented require a minimum system specification to be met for a successful study. The specifications are categorized into hardware and software specifications [14].
Hardware specification
The following includes the minimum hardware requirement for implementing the various learning models. This is to ensure the smooth execution of each model.
• RAM of 8GB and above to ensure the system doesn't crash whiles using a large volume of the dataset.
• GPU with 2GB and above to enhance the computational power (this requirement is optional).
• Storage capacity of at least 512GB HDD or 256GB SSD.
Software specification
The software requirements involve programs that support the successful implementation of the various models. The following includes the generic software requirements:
• OS: Various up to date operating systems such as windows 10, macOS, Ubuntu, etc. to provide an enabling environment for both the online and offline implementation.
• Python programming language preferably 3.7 and above.
Online software specification: Two known online software programs support the implementation of these models namely:
• Google colaboratory also known as google colab.
• Kaggle.
Offline software requirement: The offline requirements include either of the following known programs:
• Pycharm IDE.
• Jupyter notebook.
Similarity measurement
The objective of measuring the distance between two known objects is to obtain a summarized score between the two given objects in a problem domain [15]. Finding or measuring the distance between the query image and the target image in this scenario is the study's primary goal to get an appropriate result (s). The following includes commonly known supervised learning distance measurement methods:
• Euclidean distance.
• Hamming distance.
• Chi-square distance.
A summary of each model with the kind of similarity measurement is in the Table 2 below.
| Model | Similarity measurement |
|---|---|
| LBP | Euclidean distance measure |
| Gabor filter | Chi-squared |
| Gray-level co-occurrence matrix | Euclidean distance measure |
| Haralick descriptor | Euclidean distance measure |
| Fast | Euclidean distance measure |
| Fast and brief | Hamming distance measure |
Table 2: Models and their adapted similarity measure.
Threshold value
Predicting a class label has always been the main aim of classification predictive modeling. It, therefore, means that before such a model can map to a crisp class label, the machine algorithm has to sort to predict a probabilistic scoring of class membership. It is as important of predicting a particular class label as to identify the best threshold for mapping [16].
A threshold value of 0.5 can be used as a mapping scheme, according to, where all values equal to or greater than the threshold are mapped to one class and all other values are assigned to another class.
He further stated that this default value (0.5) can create a severe classification problem which can result in poor performance using an imbalanced dataset [17]. The researcher should either manually adjust the threshold value to an ideal number or sort using the Receiver Operating Characteristic (ROC) curve and the precision-recall curves, according to his suggestion. The former was carried out and utilized to establish the threshold value for every model. The threshold value for each of the implemented models may be found in the list below:
• Local binary pattern: 0.015.
• Gray-level co-occurrence matrix: Nine (9) added to the least computed distance value.
• Gabor filter: 0.050.
• Haralick texture descriptor: 0.050.
• FAST: 25 added to the least computed distance value.
• FAST-BRIEF: Values greater than or equal to 3.
Conceptual framework
The conceptual framework is important for the researcher to clearly present and explain ideas and consequently potential relationships pertaining to the study. One way of presenting such concepts is by a visual model that can assists readers by illustrating how the processes or constructs in the research work. This is known as a graphical conceptual framework. The diagram below represents the graphical conceptual framework of this study (Figure 1).
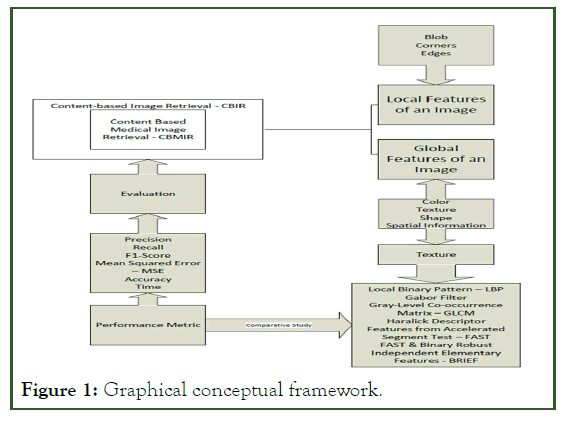
Figure 1: Graphical conceptual framework.
Code
The code for the six selected texture feature extraction techniques together with the dataset can be freely accessed and executed through Code Ocean via. The source code can also be found on GitHub via.
Data
Dataset validation: Data processing involves preprocessing. Data preprocessing refers to the technique of preparing (i.e. cleaning and organizing) the raw data to make it suitable for accomplishing a given task. Data preprocessing is a data mining technique that transforms raw data into an understandable and readable format for a given model. This process helps enhance the quality of data to promote the extraction of meaningful insights from the data. The following includes the steps taken in preprocessing the data for the various learning model:
• Acquisition of dataset.
• Uniformity of dataset (resizing the data to a specific dimension and converting the dataset to a grayscale channel if the dataset contains data of different color channels).
Dataset acquisition: The dataset used is in four (4) groups; a 1 k dataset, 5 k dataset, 10 k dataset and 10.5 k dataset. Each group consist of test data images i.e. test folder and a train folder representing our data repository/database. Both folders contains varying equal number of image types (abdomenCT, breastMRI, CXR, chestCT, hand and headCT) (Table 3). For each varying volume of dataset, a ratio of 30:70 is used in grouping the test data images (test folder) and train data images (train folder). The data below represents the metadata of both the dataset source and the dataset itself (Table 4 and Figure 2).
The dataset license is available to the public domain. Below represents the metadata of the dataset source:
@misc {Medical MNIST classification.
Author={apolanco3225}.
Title={Medical MNIST classification}.
Year={2017}.
Publisher={GitHub}.
Journal={GitHub repository}.
License: Public domain
| Name of dataset class | |
| Medical MNIST | AbdomenCT, BreastMRI, ChestCT, CXR, Hand, HeadCT. |
Table 3: Dataset metadata.
| Volume of dataset | Volume of test data | Volume of train data |
|---|---|---|
| 1 K | AbdomenCT=50 images | AbdomenCT=117 images |
| BreastMRI=50 images | BreastMRI=117 images | |
| ChestCT=50 images | ChestCT=117 images | |
| CXR=50 images | CXR=117 images | |
| Hand=50 images | Hand=117 images | |
| HeadCT=50 images | HeadCT=117 images | |
| Total=300 images | Total=702 | |
| 5 K | AbdomenCT=250 images | AbdomenCT=584 images |
| BreastMRI=250 images | BreastMRI=584 images | |
| ChestCT=250 images | ChestCT=584 images | |
| CXR=250 images | CXR=584 images | |
| Hand=250 images | Hand=584 images | |
| HeadCT=250 images | HeadCT=584 images | |
| Total=1500 | Total=3504 | |
| 10 K | AbdomenCT=500 images | AbdomenCT=1167 images |
| BreastMRI=500 images | BreastMRI=1167 images | |
| ChestCT=500 images | ChestCT=1167 images | |
| CXR=500 images | CXR=1167 images | |
| Hand=500 images | Hand=1167 images | |
| HeadCT=500 images | HeadCT=1167 images | |
| Total=3000 | Total=7002 | |
| 10.5 K | AbdomenCT=525 images | AbdomenCT=1225 images |
| BreastMRI=525 images | BreastMRI=1225 images | |
| ChestCT=525 images | ChestCT=1225 images | |
| CXR=525 images | CXR=1225 images | |
| Hand=525 images | Hand=1225 images | |
| HeadCT=525 images | HeadCT=1225 images | |
| Total=3150 | Total=7350 |
Table 4: Volume of dataset metadata
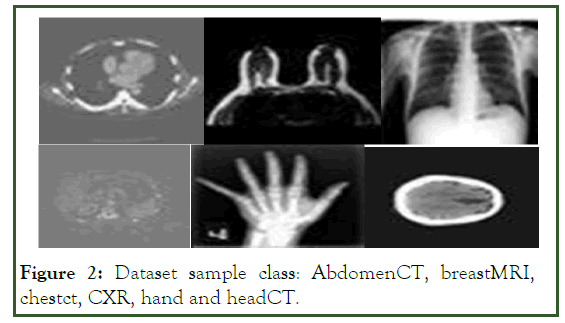
Figure 2: Dataset sample class: AbdomenCT, breastMRI, chestct, CXR, hand and headCT.
Dataset uniformity: Python libraries such as "PIL" and cv2 contain functions for resizing images to a preferred dimension. Notwithstanding, the cv2 library also supports the conversion of image color between channels such as RGB, grayscale, HSV, and Hue.
Results and Discussion
In order to have a conclusive resulting data for the varying dataset ranging from 1 k-10.5 k, we sort to find the average of each metric for the various selected techniques/models [18-20]. Below represents the mathematical formula used in deriving the data in Table 4:

The Table 5 below shows the summary of the results obtained from the experiment using a dataset ranging from 1 K-10.5 K.
| Models | Performance evaluation metrics | ||||
|---|---|---|---|---|---|
| Precision | Recall | F1-score | Accuracy | Time/s | |
| Local binary pattern | 0.8205 | 0.2448 | 0.3504 | 0.8823 | 10.87 |
| Gabor filter | 0.3666 | 0.0299 | 0.0492 | 0.8524 | 2.75 |
| Gray-level co-occurrence matrix | 0.5536 | 0.4482 | 0.2975 | 0.785 | 387.75 |
| Haralick | 0.6507 | 0.042 | 0.0877 | 0.8613 | 0.88 |
| FAST-BRIEF | 0.405 | 0.0796 | 0.1244 | 0.8532 | 9.83 |
| FAST | 0.5536 | 0.3836 | 0.387 | 0.8008 | 15.54 |
Table 5: Summary of overall results.
To significantly tell or evaluate the performance of each model, there should be a general basis for comparison. Therefore, finding the mean average for the aforementioned metrics can serve as the basis for comparison. Since there are four (4) categories of the dataset, which is 1 K, 5 K, 10 K, and 10.5 K we find the mean average for the models per the metrics.
The Table 6 below represents the mean average result score of each model per the unlisted evaluation metrics. That is to say, the mean of the average scores per metric for each model is calculated to provide the indicator basis for comparison. For easier interpretation, the percentage of the mean average scores is shown in the Table 7 below (Figure 3-7).
| Texture feature extraction techniques | |||||||
|---|---|---|---|---|---|---|---|
| Lbp | Gabor filter | GLCM | Haralick | FAST | FAST-BRIEF | ||
| Precision% | 82.05 | 36.66 | 55.36 | 65.07 | 55.36 | 40.5 | |
| Metrics | Recall% | 24.48 | 2.99 | 44.82 | 4.2 | 38.36 | 7.96 |
| F1-score% | 35.04 | 4.92 | 29.75 | 8.77 | 38.7 | 12.44 | |
| MSE% | 11.78 | 14.76 | 21.5 | 13.87 | 19.93 | 14.68 | |
| Accuracy% | 88.23 | 85.24 | 78.5 | 86.13 | 80.08 | 85.32 | |
| Time/s | 10.87 | 2.75 | 387.75 | 0.88 | 15.54 | 9.83 | |
Table 6: Percentiles of mean average scores.
| Performance evaluation metrics | |||
|---|---|---|---|
| Texture feature extraction models | Precision | Recall | Accuracy |
| LBP | 82.05% | 24.48% | 88.23% |
| New gradient descriptor from co-occurrence matrix | - | 20% | 90% |
| "Artificial bee colony algorithm", "branch and bound algorithm" and relevance feedback. | Good precision | Poor recall | - |
| An approach combining the wavelet transform technique, tamura texture feature, and hausdorff distance. | - | - | Average of 17.67% for experiments on brain and CT |
Table 7: Comparison between the summary reports of some existing texture feature extraction techniques used in CBMIR and LBP.
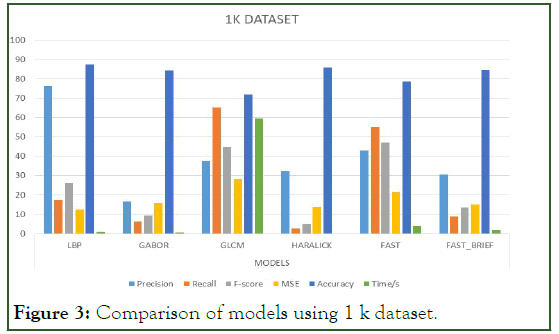
Figure 3: Comparison of models using 1 k dataset.
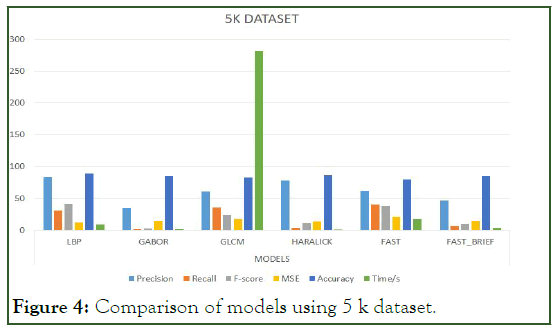
Figure 4: Comparison of models using 5 k dataset.
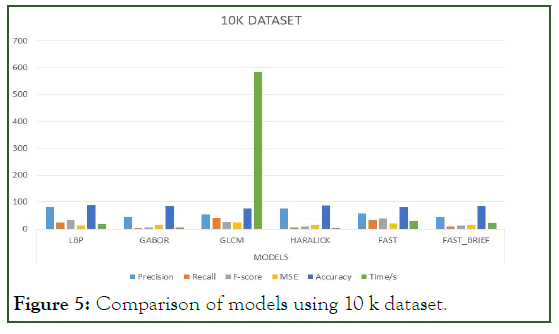
Figure 5: Comparison of models using 10 k dataset.
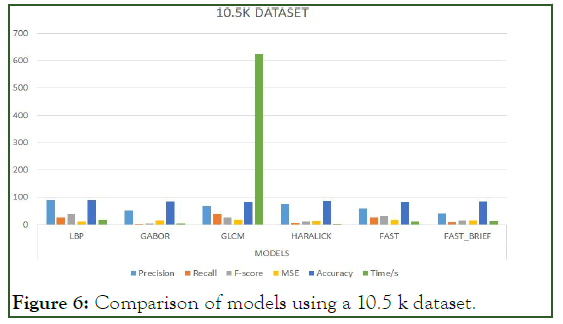
Figure 6: Comparison of models using a 10.5 k dataset.
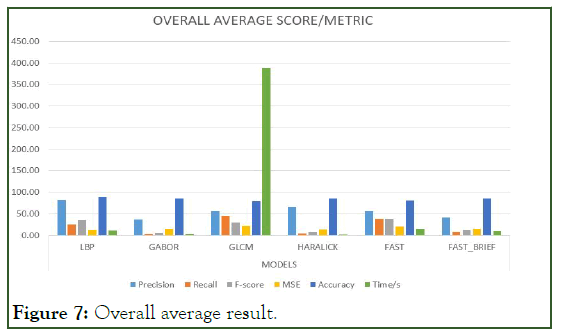
Figure 7: Overall average result.
Analysis
Interpretation of the results above.
Precision: It is noticed that the models did averagely well as the volume of the dataset increased. LBP had the best average precision throughout the various volumes of datasets hence having the best outstanding mean average precision score.
Recall: It is also noticed that some of the models increased proportionally to increasing volumes of dataset yet their recall values in question were below average which means that the number of relevant or similar images to be retrieved from the database are reduced. GLCM performed better in terms of recall. It was the best so far in terms of recall concerning the increasing volumes of the dataset.
F1-score: LBP had a well-balanced score in terms of precision and recall. That is F1-score is the weighted average for both precision and recall. In simpler terms, it is the weighted average for a given precision and recall value.
Mean squared error/accuracy: These two move hand in hand, meaning an increase in error decreases accuracy and vice versa. From the results above, it is observed that errors increased proportionally to increasing volumes of data. Generally, the models did well in minimizing the errors or otherwise did well in optimizing their accuracies. LBP did very well in optimizing accuracy by minimizing errors hence it had the best score in terms of accuracy.
Time: it is observed that time is proportional to the volume of the dataset, meaning as the dataset increases computational time also increases. Although computational time can be relative in terms of several factors such as coding behavior, device implementation specifications, etc. according to wall time also known as clock time or wall-clock time refers to the total time elapsed during measurement, which includes the difference between the time a program in execution finishes and its start time together with its waiting time for resources if required by the given program. Irrespective of the increasing volumes of the dataset haralick descriptor had the least and best mean average computational time.
Model strengths
• Best in terms of precision and accuracy.
• Best in terms of time.
• According to F-score, FAST is the best.
• Best according to recall.
Observably, LBP continues to lead in terms of precision and recall and is likely to lead in terms of F1-score as well because it is the weighted average of precision and recall. Lastly, it is the 2nd to the new gradient descriptor from co-occurrence matrix in terms of accuracy.
Conclusion
It can be concluded from this study that the local binary pattern is best suited for research that focuses on precision, F1-score, and apparently accuracy for content-based medical image retrieval systems.
Haralick texture descriptor is best suited for research that focuses more on computational time concerning medical imagery tasks.
Nonetheless, FAST performed better than FAST-BRIEF concerning the precision, recall, and F1-score.
In this study, the models were adapted for CBMIR systems. The resulting values in section 5 were obtained after running each model several times over a specific volume and class of dataset. Though the dataset was cleansed during the preparation stage, some images having “Not a Number” (NaN) value whiles extracting its features could not be neglected since it is part of the medical images, and as such the models did quite well when they encountered such challenge, especially the GLCM model. This is why it was able to recall the highest number of images though most were not relevant but had a recall of 44.82% over the range of 1 k-10.5 K volume of the dataset.
It should be noted that the results obtained for the basis of comparison represents the mean average scores over the dataset ranging from 1 K-10.5 K. The idea for using the mean average score was adapted from.
Summary
The study compares the performance of the six selected texture feature extraction techniques on the medical dataset.
Specifically, the performance metrics we are comparing are on the basis of precision, recall, F1-score (weighted average of both the precision and recall), mean squared error, accuracy, and time the dataset used is of raw medical image data, therefore there isn't much to do with dealing with outliers and the rest as if the dataset were in the form of an excel file but we rather catered for having a uniform dimension for the image data.
Each technique had its own way of converting the raw image data to its array of codes. There were a few cases where we encountered a NaN value for the most apparent dark image(s). This issue was raised in the concluding part.
More so, the experiment was conducted separately for each technique using the same conditions, other than that, the records taken for the various execution times won't have reflected their actual time. Therefore, there is no need to apply any correction techniques for this experiment.
For each technique, the experiment was carried out with an increasing volume of dataset i.e. from 1 k-10.5 k.
For each technique we took the overall average score (1 k-10.5 k dataset) for each performance metric. In the end, we compared the performance metrics of the techniques using the average scores in order to have a general or performance summary of the technique.
Disclosures
The authors declare no conflicts of interest, financial or otherwise for this research.
Acknowledgment
First of all, I will like to use this opportunity to thank the almighty god, the creator of the universe for giving me the strength and ability to accomplish this task. I will like to also express my profound gratitude to my supervisor-Dr. Obed Appiah and co-supervisor-Dr. Peter Appiahene (HoD computer science) for their immense contribution towards the completion of this study. I truly appreciate the time and guidelines they offered towards achieving a successful novel project. I say god bless them.
References
- Zin NA, Yusof R, Lashari SA, Mustapha A, Senan N, Ibrahim R. Content-based image retrieval in medical domain: A review. J Phys Conf Ser. 2018;1019(1):012044.
- Belattar K, Mostefai S, Draa A. Intelligent content-based dermoscopic image retrieval with relevance feedback for computer-aided melanoma diagnosis. J Inf Technol Res. 2017;10(1):85-108.
- Akgul CB, Rubin DL, Napel S, Beaulieu CF, Greenspan H, Acar B. Content based image retrieval in radiology: Current status and future directions. J Digit Imaging. 2011;24(2):208-222.
[Crossref] [Google Scholar] [PubMed]
- Bunte K, Biehl M, Jonkman MF, Petkov N. Learning effective color features for content based image retrieval in dermatology. Pattern Recognit. 2011;44(9):1892-1902.
- Shinde A, Rahulkar A, Patil C. Content based medical image retrieval based on new efficient local neighborhood wavelet feature descriptor. Biomed Eng Lett. 2019;9(3):387-394.
[Crossref] [Google Scholar] [PubMed]
- Ergen B, Baykara M. Texture based feature extraction methods for content based medical image retrieval systems. Biomed Mater Eng. 2014;24(6):3055-3062.
[Crossref] [Google Scholar] [PubMed]
- Nagarajan G, Minu RI, Muthukumar B, Vedanarayanan V, Sundarsingh SD. Hybrid genetic algorithm for medical image feature extraction and selection. Procedia Comput Sci. 2016;85:455-462.
- Xiaoming S, Ning Z, Haibin W, Xiaoyang Y, Xue W, Shuang Y. Medical image retrieval approach by texture features fusion based on Hausdorff distance. Math Probl Eng. 2018;2018:1-13.
- Kaur P, Singh RK. Content based image retrieval using machine learning and soft computing techniques. Int J Sci Techno Res. 2020;9(1):1-7.
- Wei CH, Li Y, Huang PJ. Mammogram retrieval through machine learning within BI-RADS standards. J Biomed Inform. 2011;44(4):607-614.
[Crossref] [Google Scholar] [PubMed]
- Da Silva SF, Ribeiro MX, Neto JD, Traina-Jr C, Traina AJ. Improving the ranking quality of medical image retrieval using a genetic feature selection method. Decis Support Syst. 2011;51(4):810-820.
- Zheng B. Computer-aided diagnosis in mammography using content-based image retrieval approaches: Current status and future perspectives. Algorithms. 2009;2(2):828-849.
[Crossref] [Google Scholar] [PubMed]
- de Oliveira JE, Machado AM, Chavez GC, Lopes AP, Deserno TM, de A Araujo A. MammoSys: A content-based image retrieval system using breast density patterns. Comput Methods Programs Biomed. 2010;99(3):289-297.
[Crossref] [Google Scholar] [PubMed]
- Chandy DA, Johnson JS, Selvan SE. Texture feature extraction using gray level statistical matrix for content-based mammogram retrieval. Multimed Tools Appl. 2014;72:2011-2024.
- Depeursinge A, Duc S, Eggel I, Muller H. Mobile medical visual information retrieval. IEEE Trans Inf Technol Biomed. 2012;16(1):53-61.
[Crossref] [Google Scholar] [PubMed]
- Talib A, Mahmuddin M, Husni H, George LE. A weighted dominant color descriptor for content-based image retrieval. J Vis Commun Image Represent. 2013;24(3):345-360.
- Huang ZC, Chan PP, Ng WW, Yeung DS. Content-based image retrieval using color moment and Gabor texture feature. Int J Mach Learn. 2010;11(2):719-724.
- Liu Y, Zhang D, Lu G, Ma WY. A survey of content-based image retrieval with high-level semantics. Pattern Recognit. 2007;40(1):262-282.
- Kelly PM, Cannon TM, Hush DR. Query by image example: The comparison algorithm for navigating digital image databases (CANDID) approach. Procee Storage Retri Image Video Databases. 1995:238-248.
- Orphanoudakis SC, Chronaki C, Kostomanolakis S. I2C: A system for the indexing, storage, and retrieval of medical images by content. Med Inform. 1994;19(2):109-122.
[Crossref] [Google Scholar] [PubMed]
Citation: Kusi-Duah S, Appiah O, Appiahene P (2023) Performance Evaluation of State-of-the-Art Texture Feature Extraction Techniques on Medical Imagery Tasks. J Clin Med Sci. 7:228.
Copyright: © 2023 Kusi-Duah S, et al. This is an open access article distributed under the terms of the Creative Commons Attribution License, which permits unrestricted use, distribution, and reproduction in any medium, provided the original author and source are credited.
