Indexed In
- Genamics JournalSeek
- JournalTOCs
- CiteFactor
- RefSeek
- Hamdard University
- EBSCO A-Z
- OCLC- WorldCat
- Publons
- Google Scholar
Useful Links
Share This Page
Journal Flyer

Open Access Journals
- Agri and Aquaculture
- Biochemistry
- Bioinformatics & Systems Biology
- Business & Management
- Chemistry
- Clinical Sciences
- Engineering
- Food & Nutrition
- General Science
- Genetics & Molecular Biology
- Immunology & Microbiology
- Medical Sciences
- Neuroscience & Psychology
- Nursing & Health Care
- Pharmaceutical Sciences
Research Article - (2023) Volume 12, Issue 3
Optimum Slat and Flap Configuration for Maximizing Lift on NACA-4412 Airfoil at Various Angle of Attack, Using XFOIL at a Reynolds Number of 1 Million
Parmananda Sharma*, Piyush Kumar and Raj Kumar SinghReceived: 30-Mar-2023, Manuscript No. JAME-23-20499; Editor assigned: 03-Apr-2023, Pre QC No. JAME-23-20499 (PQ); Reviewed: 17-Apr-2023, QC No. JAME-23-20499; Revised: 20-May-2023, Manuscript No. JAME-23-20499 (R); Published: 29-May-2023, DOI: 10.35248/2168-9873.23.12.485
Abstract
In this research paper, we have investigated the optimal configuration of slats and flaps for maximizing lift on the NACA-4412 airfoil at different angles of attack, at a Reynolds number of 1 million. We used XFOIL and python for the simulations and obtained lift, drag, and lift-to-drag ratio for different slat and flap configurations. The slat and flap configuration used was standard, and both the slat and flap angles were varied in the range of 5-15 degrees, resulting in a total of 121 configurations. Additionally, the angle of attack was varied in the range of -5 to 20 degrees with an interval of 0.5 degrees.
Through our study, we have identified the best slat and flap configuration for achieving maximum lift or maximum lift-to-drag ratio for the NACA-4412 airfoil. To validate our results, we used XFLR5 to compare the data generated from XFOIL.
This type of study and simulation is highly relevant for designing flaps and slats, as the lift and drag requirements vary during takeoff and landing of aircraft. By determining the optimal slat and flap configuration, we can improve the performance of aircraft and make them safer and more efficient.
Keywords
Flap; Lift; NACA-4412; RANS; Slat; XFOIL; XFLR5
Introduction
Airfoil is one of the most important parts in aerodynamics field which generates lift for aircraft to take off and land safely by creating pressure difference between upper and lower surface when fluid (air) flows around it. Lift and drag are the two parameters in airfoil that are crucial in design of aircrafts as per the requirement. Lift and drag force are proportional to surface area of wing, square of aircraft velocity, density of air. If the aircraft speed is too low specially during landing lift generated by airfoil alone is not sufficient. The only way we can produce more lift is by increasing is wing area and curvature. So, flaps and slats are used for this purpose.
Slats are installed at leading edge whereas flaps are installed at trailing edge. They are the parts of airfoil itself. Actuators are used to control the slats and flap angles so that proper configuration can be selected as per the requirement. Slats and flaps increase the lift by increasing the camber and thickness of airfoil which increases geometric surface area. The flaps also alter the pressure distribution on upper and lower surfaces creating more pressure difference between upper and lower surface and hence increase the lift [1]. With increase in lift, drag also increases. However, the advantage of the increase in lift is more than drag. Although, drags can be reduced by introducing vortex generators or optimizing flaps and slats shapes. Vortex generators are small wing like structures on surface of wings that create small vortices energizing and directing flow of air over the wings [2].
Materials and Methods
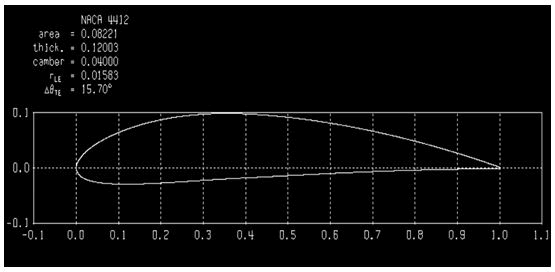
For this paper, NACA-4412 airfoil has been used for the simulation due to its high lift to drag ratio suited for low-speed applications [3]. Plain flaps and slats were used for the simulation. Plain flaps are hinged at back of aircrafts wings. As plain flaps and slats are extended, the airflow becomes stronger resulting in the wing having large wake and flow separation behind it [4]. The main limitation of plain flaps and slats are its limited lift improvement capacity as air loses energy and starts to separate from the wing. The main advantage of plain flaps is that it allows for the aircrafts to a steeper descent without increasing the airspeed [5]. However, there are more advanced flaps and slats used these days like slotted flaps, fowler flaps which overcome the limitation of plain flaps [6]. For the simplicity of simulation and limitations of XFOIL to provide option of advanced flaps, we have gone with plain flaps and slats (Figure 1).
Figure 1: NACA-4412.
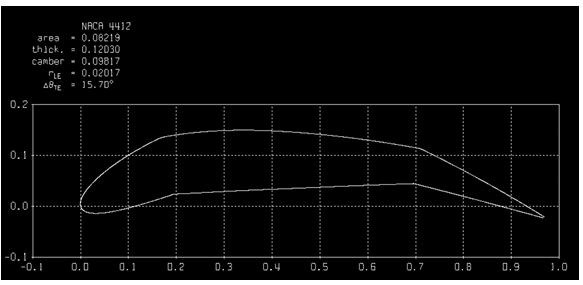
In Figure 2, both slat and flap configuration has been set to 15 degrees angle. Similarly, other flap and slat configuration was set as simulation was carried out.
Figure 2: NACA-4412 with plain slats and flaps.
Software used: XFOIL and XFLR5 was used in this simulation. XFOIL code combines a potential flow panel method and an integral boundary layer formulation for the analysis of flow around the airfoil. XFOIL was developed by Mark Drela at MIT to perform design and analysis of subsonic airfoils and its convergence is achieved through the iteration between outer and inner through flow solutions on the boundary layer displacement thickness [7]. In XFOIL, a panel refers to a surface element that is used to discretize the airfoil geometry into a finite set of control points. These panels are used to compute the pressure distribution and other aerodynamic characteristics of the airfoil [8]. It affects the accuracy of results with higher number of panels however with longer computational times. A basic command lines are used to design and perform the simulation. There are options to design flaps and slats with ease, set hinge location, angles. The version of XFOIL used was 6.99. XFLR5 is a user-friendly tool for design and analysis of airfoils and has graphical user interface. It can be used to design airfoils, wings, aircraft models unlike XFOIL which is only used in airfoil simulations. The program uses fully coupled viscous/ inviscid interaction method with high order panel to calculate lift, drag, and pitching moment and pressure coefficients of airfoil [9]. The version of XFLR5 used was 6.58. Both of this simulation software is widely used for research purpose in aircraft fields.
Slat and flap configuration: The simulation was performed for range of slats and flap angle. Slat angle and flap angle was in range (5-15) degrees resulting in 121 different configurations. The range of slat and flap angle was limited to (5-15) degrees in this simulation because of limited computational capacity of pc though angles could go further up for high performance aircrafts. The slat hinge x location was hinged at 20% chord length and flap hinged x location was hinged at 70% chord length. Similarly, instead of hinge y location, y/t location was set to 0.5.
Angle of Attack (AoA): The simulation was run at AoA ranging from 5 to 20 degrees with step size of 0.5 degrees.
Panel range and iterations, Reynolds number: For each configuration of slat and flap angles, simulation was performed for range of panels (100-350) with a step size of 50. This led to convergence of results. For each AoA, iteration was set to 3000. The reynold number was set to 1 million.
Scripting: Since, there was large number of simulations to be carried out i.e., 121 different combinations and for each combination, simulation was carried out for range of panels (100-350) resulting in 726 simulations making sure that we got converged data of lift and drag. Carrying out this number of simulations was not possible manually. Since, XFOIL is command based software, python was used to generate 726 different simulation scripts and these scripts were run by a different script which was again generated using python.
Data extraction: The lift, drag for each AoA was saved to text file for different configuration of slat and flap angles. The text files were combined and converted to excel file and data was sorted.
Optimum flap and slat angle: A python code was used to search though the excel file to find out the best flap and slat configuration that gave max CLand max CL / CD for each angle of attack.
Results and Discussion
The results of simulation carried out in XFOIL at 1 million reynolds number for NACA-4412 with and without flaps and slats are shown in table below.
| Â AoA | Slat angle | Flap angle | XFOIL max CL | XFLR5 max CL |
|---|---|---|---|---|
| -5 | 5 | 15 | 0.9868 | 0.97077 |
| -4.5 | 5 | 15 | 1.0473 | 1.0289 |
| -4 | 5 | 15 | 1.1029 | 1.08935 |
| -3.5 | 5 | 15 | 1.1563 | 1.14635 |
| -3 | 5 | 15 | 1.2153 | 1.19793 |
| -2.5 | 5 | 15 | 1.2631 | 1.25308 |
| -2 | 5 | 15 | 1.3118 | 1.30666 |
| -1.5 | 5 | 15 | 1.2749 | 1.27647 |
| -1 | 5 | 15 | 1.1988 | 1.21171 |
| -0.5 | 5 | 15 | 1.2004 | 1.21252 |
| 0 | 5 | 15 | 1.2228 | 1.23216 |
| 0.5 | 5 | 15 | 1.2583 | 1.26509 |
| 1 | 5 | 15 | 1.2922 | 1.29757 |
| 1.5 | 5 | 15 | 1.3266 | 1.32945 |
| 2 | 5 | 15 | 1.3618 | 1.36357 |
| 2.5 | 5 | 15 | 1.3969 | 1.39683 |
| 3 | 5 | 15 | 1.4318 | 1.43034 |
| 3.5 | 5 | 15 | 1.4675 | 1.46451 |
| 4 | 5 | 15 | 1.5045 | 1.50024 |
| 4.5 | 5 | 15 | 1.5419 | 1.53608 |
| 5 | 5 | 15 | 1.5781 | 1.5718 |
| 5.5 | 5 | 15 | 1.6153 | 1.6078 |
| 6 | 5 | 15 | 1.6521 | 1.64465 |
| 6.5 | 5 | 15 | 1.6894 | 1.68151 |
| 7 | 5 | 15 | 1.7263 | 1.71671 |
| 7.5 | 5 | 15 | 1.7613 | 1.75085 |
| 8 | 5 | 15 | 1.7952 | 1.78331 |
| 8.5 | 6 | 15 | 1.8266 | 1.81251 |
| 9 | 7 | 15 | 1.854 | 1.84005 |
| 9.5 | 8 | 15 | 1.8768 | 1.86562 |
| 10 | 8 | 15 | 1.9082 | 1.89949 |
| 10.5 | 9 | 15 | 1.934 | 1.92169 |
| 11 | 10 | 15 | 1.9586 | 1.9449 |
| 11.5 | 11 | 15 | 1.9764 | 1.96622 |
| 12 | 12 | 15 | 1.9912 | 1.98282 |
| 12.5 | 13 | 15 | 2.0091 | 1.99895 |
| 13 | 13 | 14 | 2.0261 | 2.01767 |
| 13.5 | 14 | 15 | 2.0563 | 2.049 |
| 14 | 15 | 15 | 2.0584 | 2.06086 |
| 14.5 | 15 | 12 | 2.0448 | 2.04514 |
| 15 | 15 | 9 | 2.0161 | 2.0129 |
| 15.5 | 15 | 6 | 1.9802 | 1.97414 |
| 16 | 15 | 12 | 1.9329 | 1.92343 |
| 16.5 | 15 | 12 | 1.9047 | 1.89469 |
| 17 | 15 | 9 | 1.8737 | 1.8665 |
| 17.5 | 15 | 7 | 1.8405 | 1.83283 |
| 18 | 15 | 6 | 1.8038 | 1.79735 |
| 18.5 | 15 | 5 | 1.7609 | 1.75476 |
| 19 | 6 | 15 | 1.7399 | 1.71872 |
| 19.5 | 6 | 15 | 1.7393 | 1.71875 |
| 20 | 6 | 15 | 1.7373 | 1.71876 |
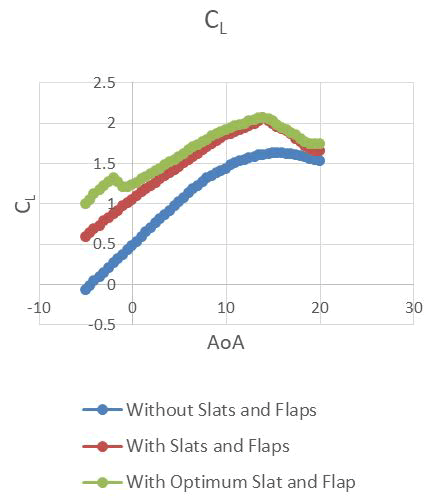
The above Table 1 shows the slat and flap configuration that gives maximum lift coefficient for each angle of attack. Among these, slat angle of 15 degree and flap angle of 15 degree at 14- degree AoA gives maximum lift coefficient i.e., 2.0584. Also, for each angle of attack from -5 to 8, the slat angle of 5 and flap angle of 15 degree gave the maximum lift coefficient. The lift data generated by XFOIL is similar to lift data generated by XFLR5 which validates the data. The lift in comparison to lift without flaps and slats is much higher which is desired in aircrafts for shorter takeoffs and safer landing. The Figure 3 shows the comparison of lift values against AoA without slats and flaps, with flaps (15 degrees) and slats (15 degrees) and with finally lift values corresponding to optimum slat and flap configurations as in Table 1.
Figure 3: CL vs. AoA.
| AoA | Slat angle | Flap angle | XFOIL max CL/CD | XFLR5 max CL/CD |
|---|---|---|---|---|
| -5 | 9 | 15 | 107.1396 | 101.9547 |
| -4.5 | 8 | 15 | 114.5107 | 107.4462 |
| -4 | 7 | 15 | 120.4425 | 113.1101 |
| -3.5 | 7 | 15 | 129.1723 | 123.3495 |
| -3 | 7 | 15 | 136.5517 | 134.4517 |
| -2.5 | 6 | 15 | 141.9864 | 133.4332 |
| -2 | 5 | 15 | 147.5591 | 138.7113 |
| -1.5 | 5 | 13 | 151.8463 | 137.3352 |
| -1 | 5 | 10 | 113.7528 | 113.1774 |
| -0.5 | 5 | 9 | 107.3134 | 107.3443 |
| 0 | 5 | 9 | 105.4315 | 105.6758 |
| 0.5 | 5 | 8 | 105.0102 | 104.8267 |
| 1 | 5 | 8 | 104.9509 | 105.0402 |
| 1.5 | 5 | 8 | 109.5187 | 109.2962 |
| 2 | 5 | 6 | 113.0712 | 112.9841 |
| 2.5 | 5 | 5 | 113.6638 | 113.6559 |
| 3 | 5 | 5 | 114.8075 | 114.1426 |
| 3.5 | 5 | 5 | 117.9487 | 115.8451 |
| 4 | 5 | 5 | 119.9899 | 119.2192 |
| 4.5 | 5 | 5 | 117.7077 | 116.7424 |
| 5 | 5 | 5 | 115.3575 | 114.3318 |
| 5.5 | 5 | 5 | 113.2846 | 112.4317 |
| 6 | 5 | 5 | 111.5164 | 110.9291 |
| 6.5 | 5 | 5 | 109.0124 | 108.66 |
| 7 | 5 | 5 | 106.7751 | 106.3402 |
| 7.5 | 5 | 5 | 104.732 | 104.0785 |
| 8 | 5 | 5 | 102.6295 | 102.4212 |
| 8.5 | 5 | 5 | 100.4103 | 99.91709 |
| 9 | 5 | 5 | 97.91463 | 97.09619 |
| 9.5 | 5 | 5 | 94.74625 | 94.25129 |
| 10 | 6 | 5 | 91.51366 | 92.19725 |
| 10.5 | 7 | 5 | 88.25142 | 88.83628 |
| 11 | 7 | 5 | 85.34804 | 84.02465 |
| 11.5 | 8 | 5 | 82.33845 | 82.75606 |
| 12 | 9 | 5 | 78.95916 | 79.69377 |
| 12.5 | 10 | 5 | 75.50083 | 76.32527 |
| 13 | 11 | 5 | 71.78002 | 72.77128 |
| 13.5 | 12 | 5 | 67.86623 | 69.03236 |
| 14 | 13 | 5 | 63.75635 | 65.20969 |
| 14.5 | 13 | 5 | 61.86309 | 58.84147 |
| 15 | 14 | 5 | 59.67097 | 58.593 |
| 15.5 | 15 | 5 | 55.1769 | 54.60872 |
| 16 | 15 | 5 | 45.60095 | 44.3247 |
| 16.5 | 15 | 5 | 37.50696 | 36.61155 |
| 17 | 15 | 5 | 31.88078 | 30.98045 |
| 17.5 | 15 | 5 | 27.23698 | 26.67977 |
| 18 | 15 | 5 | 23.151 | 22.74037 |
| 18.5 | 15 | 5 | 19.54167 | 19.16521 |
| 19 | 15 | 5 | 16.27146 | 16.02956 |
| 19.5 | 15 | 5 | 13.47458 | 13.28491 |
| 20 | 5 | 5 | 11.42227 | 11.23807 |
Table 2 presents the optimum slat and flap configuration for achieving maximum lift to drag ratio at each angle of attack. During ascent, aircraft must decelerate and generate lift at a negative angle of attack. Therefore, it is essential to select the appropriate slat and flap configuration to achieve the highest possible lift to drag ratio for better fuel economy and safe landing.
According to Table 2, the configuration of 5 degrees for slat angle and 13 degrees for flap angle at a -1.5 degree angle of attack yields the maximum lift to drag ratio of 151.8463445. The accuracy of the lift to drag ratio data obtained from XFOIL is confirmed by its similarity to the data generated in XFLR5 software.
For angles of attack ranging from 2.5 to 8.5 degrees, the optimum slat and flap angle configuration that provides maximum lift to drag ratio is at 5-degree each.
Figure 3 depicts the lift vs. angle of attack plot for a range of AoA from -5 to 20 with an increment of 0.5 degrees. The blue line represents the lift without flaps and slats. The lift coefficient initially increases from -5 degrees to 16 degrees and reaches its maximum value of 1.6279 at 16 degrees. After this, the lift coefficient starts decreasing, and drag increases due to flow separation. It can be observed that the lift coefficient is extremely low at negative AoA. During landing, when the AoA is negative, the speed of air hitting the wings is very low, and such a low value of lift is inadequate for a safe landing. Additionally, for a short takeoff run, a higher lift is required. Otherwise, the run must be longer to attain a higher speed to compensate for the low lift value, which is not cost-effective.
The red line represents the lift values with a slat angle of 15 degrees and a flap angle of 15 degrees. The lift has increased significantly with a value of 2.0584 at 14-degree AoA compared to the previous case without flaps and slats.
The green line indicates the lift values when the maximum lift coefficient is considered for different AoA with the optimum flap and slat configuration.
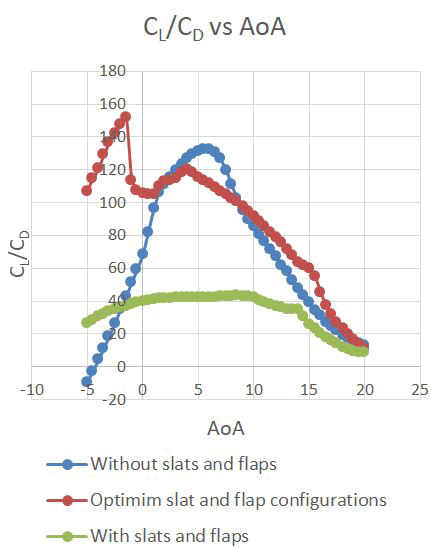
Figure 4: CL/CD vs. AoA.
Figure 4 displays the lift to drag ratio vs. angle of attack plot. The blue line corresponds to the lift to drag ratio without using flaps and slats. The lift to drag ratio increases from -5 to 7 degrees of AoA and reaches a maximum value of 126.3125, after which it decreases further due to a significant increase in drag.
The green line represents the lift to drag ratio obtained with a flap angle and a slat angle of 15 degrees each. The lift to drag ratio has decreased significantly as compared to the case without flaps and slats.
However, the red line represents the lift to drag ratio obtained when the optimum flap and slat configuration is used. The lift to drag ratio has increased by a large value, particularly for negative AoA, and reaches its maximum value of 151.846 at -1.5 degrees of AoA.
Conclusion
In this study, a CFD simulation of NACA-4412 was conducted using XFOIL to determine the optimum leading edge slat and trailing edge flap configurations that produce the maximum lift and maximum lift to drag ratio for each angle of attack ranging from -5 to 20 degrees with a 0.5-degree increment. Both the slat and flap configurations varied between 5 to 15 degrees. The findings revealed that different combinations of slat and flap configurations are necessary for different angles of attack to achieve maximum lift or lift to drag ratio. However, as the lift increased, so did the drag. Further investigations could be carried out to minimize drag and enhance lift and lift to drag ratio for a wider range of slat and flap configurations.
References
- Arra A, Anekar N, Nimbalkar S. Aerodynamic effects of Leading Edge (LE) slats and slotted Trailing Edge (TE) flaps on NACA-2412 airfoil in prospect of optimization. Mater Today: Proc. 2021;44:587-595.
- Lee JJ, Kim DY, Shin SI. Aerodynamic characteristics of a three-dimensional wing with vortex generators at low Reynolds numbers. J Mech Sci Techn. 2019;33(11):5599-5608.
- Mehdi H, Gaurav S, Sharma M. Numerical investigation of fluid flow and aerodynamic performance on a 2D NACA-4412 airfoil. Int J Res Engine Innov. 2016;1(1):5.
- Sarmast SH, Haghighat R. Experimental investigation of NACA 2412 airfoil with three types of flaps. J Appl Fluid Mech. 2016;9(5):2315-2324.
- Wang KW, Kandil OA, Han J. Computational study of the effects of wing flaps on the aerodynamic performance of a light sport aircraft. J Aircraft. 2009;46(3):961-971.
- Shrestha RK, Kim SY. Performance evaluation of an aircraft with slat/flap configurations using computational fluid dynamics. Int J Aeronaut Space Sci. 2013;14(1):25-35.
- Drela M. XFOIL: An analysis and design system for low Reynolds number airfoils. Low Reynolds Number Aerodyn. 1989;54:1-12.
- Azimi AM, Sadeghi M. The effects of number of panels and angle of attack range on the performance of a 4-digit NACA airfoil. Modares Mechanical Engineering. 2012;12(7):23-30.
- Guzelbey IH, Eraslan Y, Dogru MH. Numerical investigation of different airfoils at low Reynolds number in terms of aerodynamic performance of sailplanes by using XFLR5. Karadeniz Fen Bilimleri Dergisi. 2018;8(1):47-65.
Citation: Sharma P, Kumar P, Singh RK (2023) Optimum Slat and Flap Configuration for Maximizing Lift on NACA-4412 Airfoil at Various Angle of Attack, Using XFOIL at a Reynolds Number of 1 Million. J Appl Mech Eng. 12:485.
Copyright: © 2023 Sharma P, et al. This is an open access article distributed under the terms of the Creative Commons Attribution License, which permits unrestricted use, distribution, and reproduction in any medium, provided the original author and source are credited.
