Indexed In
- Open J Gate
- Genamics JournalSeek
- Smithers Rapra
- RefSeek
- Directory of Research Journal Indexing (DRJI)
- Hamdard University
- EBSCO A-Z
- OCLC- WorldCat
- Scholarsteer
- Publons
- Geneva Foundation for Medical Education and Research
- Google Scholar
Useful Links
Share This Page
Journal Flyer
Open Access Journals
- Agri and Aquaculture
- Biochemistry
- Bioinformatics & Systems Biology
- Business & Management
- Chemistry
- Clinical Sciences
- Engineering
- Food & Nutrition
- General Science
- Genetics & Molecular Biology
- Immunology & Microbiology
- Medical Sciences
- Neuroscience & Psychology
- Nursing & Health Care
- Pharmaceutical Sciences
Research Article - (2023) Volume 13, Issue 2
Optimal Adsorption Conditions for Tartrazine using Activated Carbon Prepared from Groundnut Shells (Arachis hypoheae): A Comparison between Functionalized and Non-functionalized Carbon Adsorbents
Betga Alex Worldlight*, Ntang Albert Nigho, Daouda Kouotou, Mayeukeu Harding Wilfried, Kuisseu Michelle and Juluis Ndi NsamiReceived: 13-Apr-2023, Manuscript No. ACE-23-21030; Editor assigned: 17-Apr-2023, Pre QC No. ACE-23-21030 (PQ); Reviewed: 02-May-2023, QC No. ACE-23-21030; Revised: 09-May-2023, Manuscript No. ACE-23-21030 (R); Published: 17-May-2023, DOI: 10.35248/2090-4568.23.13.276
Abstract
The removal of tartrazine from aqueous solution by activated carbon prepared from groundnut shells chemically activated with phosphoric acid, Activated Carbon (AC) and Functionalized Activated Carbon (FAC) has been investigated using kinetics models. Batch isotherm data were analysed with the pseudo-first order, pseudo-second order model as well as the intra-particle diffusion model. For structural elucidation, the materials were characterized using Fourier Transform Infrared (FTIR) and Scanning Electron Microscope (SEM). These analyses revealed that the activated carbons (AC and FAC) were predominantly mesoporous with AC more mesoporous than FAC, both having several oxygen-containing functional groups dispersed on their surface. The reaction was systematically investigated under various experimental conditions such as contact time, adsorbent dose and pH. For the two adsorbents, the quantity adsorbed of 11.57 mg/g and 11.45 mg/g respectively for AC and FAC at contact times of 5 min were obtained. The adsorption data were tested with the Langmuir, Freundlich models. Langmuir model was found to best describe the adsorption of tartrate ions with maximum monolayer adsorption capacities of 17.72 mg/g and 11.01 mg/g for AC and FAC, respectively. Results analysis indicated clearly that the pseudo-second order kinetic rate model best fitted the experimental data and therefore was the adsorption controlling mechanism or both adsorbents. The results show that these AC is a better absorbent than FAC for tartrate ions elimination.
Keywords
Activated carbon; Groundnut shells; Tartrazine; Functionalization
Introduction
Even though we live in modern days, access to clean water remains one of the major’s problem face by many community in the less developed countries. Most of the population relies in non-portable water which causes diseases to human. Majority of the water are populated by industries which releases dyes into the water [1]. Unlike other pollutants, dye pollutants especially those with the benzene ring even at low concentration is visible which reduces light penetration in to water, hence causes negative effect on photosynthesis to water plants. They are non-degradable [2]. Many techniques have been used in the treatment of theses water which include oxidation, precipitation, coagulation, ions exchange, filtration and adsorption [3-6]. But most of these techniques are extensive and less effective, hence need to choose less extensive and more effective technique such as adsorption in the treatment of these waters [4]. Thus adsorption with porous surface has frequently being used for the treatment water emitted by industries and household [7]. Many adsorbents have been used in the elimination of dyes in water such as zeolites, ceramics, clays and activated carbon [8]. Activated carbon has soon to be the one of the best adsorbent for water treatment [9]. Activated carbon can be prepared from a large number of materials. These materials are usually high carbon content and volatile and low in inorganic content [9]. Most of the materials used to produce activated carbon are coal, and wood which aren’t more available in great quantity. That is why researcher have turn to look for alternative which are agricultural waste products like coco nut shells, palm oil shells and groundnut shells which are rich in lignocellulose [10]. Activated Carbon can be prepared basically by two methods; physical and chemical activation [10]. Although some research have been done in the production of activated carbon using groundnut shells, yet little work have been done in the functionalization of this activated carbon using acid. That is why the main objective of our work is to see the removal capacity of tartrazine using Activated Carbon (AC) and Functionalized Activated Carbon (FAC) on prepared from groundnut shell.
Materials and Methods
Preparation of absorbents
The procedure for the preparation of the Activated Carbon (AC) was follows; the raw material constituted by groundnut shells were collected in East region of Cameroon, more exactly in the department of Lom and Djerem; these groundnut shells are classified in the group of lignocellulose compounds. These shells contain essentially organic, mineral substances and water, thus constitute a real source of agricultural waste, possessing interesting physico-chemical characteristics for the production of activated charcoals. The groundnut shells collected were abundantly washed in the tape water to eliminate the impurities, rinsed in distilled water and then dried in air during two weeks. Once dried, they were crushed until the obtaining of fragments having a size between 1.25 mm and 2.5 mm. These fragments were impregnated with phosphoric acid (H3PO4) with ratio of 1:1, 1:2 and 2:1 (mass of activating agent/mass of raw material).
After impregnation, these fragments of groundnut shells were dried in the oven room at 110˚C during 24 hours. The carbonization of material was made at temperature of 400°C, 500°C and 600°C during 1 hour and cool down until the room temperature.
After cooling, the activated carbon was washed with distilled water until neutral pH was obtained, then crushed in a mortar by means of a pestle, until the obtaining of the powder.
Functionalization of activated carbon
20 g of the activated carbon was added to 25 mL nitric acid (2 M) and the mixture was stirred under reflux for 9 hrs at 65°C at 150 rpm. After agitation, the functionalize activated carbon was washed with distilled water so to have a neutral pH of 7.
Characterization of activated carbon and functionalized activated carbon
Samples of activated carbon and functionalized activated Carbon were characterised using various techniques: Infrared spectroscopy (IR) to probe the surface functional group, Scanning Electron Microscopy (SEM) to investigate the surface morphology, the iodine number was determined to evaluate the micro porosity, and Boehm’s to functional groups.
Preparation of adsorbate
The tartrazine stock solution (300 ppm) was prepared by dissolving 0.156 g of tartrazine powder with distilled water in a 500 mL volumetric flask. The solution was stirred for 24 hours to obtain the homogeneity. From this solution, dilute solutions of 1, 3, 5, 7, 9, 11, 13 and 15 mg/L were prepared. 0.1 M hydrochloric acid and 0.1 M sodium hydroxide were also prepared for pH adjustments, by dilution of initial hydrochloric acid of 37% and 1 g of sodium hydroxide in conical flasks.
Batch adsorption experiments
Batch adsorption isotherm study was carried out through several experimental runs. For each run, 20 ml of tartrazine dye of known initial concentration was added to a known mass of adsorbent and agitated for a predetermined time. After agitation, the solution was filtered using which wattman N°4 filtered paper and the concentration of the supernatant fluid measured using a TECHMEL-TECHMEL S-23A UV-visible spectrophotometer at the wave length of 420 nm. Similar measurements were carried out with varying adsorbent doses, solution pH and initial concentrations of tartrazine. The quantity adsorbed (Qe) adsorbed per unit mass of adsorbent, and the percentage removal (%R) were calculated using the following equations (Equation 1).

Where, Co and Ce are the initial and equilibrium concentrations (mg/L) of the adsorbate, V (L) the volume of the adsorbate solution agitated and m the mass of the adsorbent used.
The percentage adsorbed is calculated using the (Equation 2):

Results and Discussion
Effect of chemical impregnation ratio (r), resident time, and activation temperature on carbonization optimization
Statistical results obtained based on the percentage yield and iodine number was used to perform a multiple comparison. The results of impregnation ratio (R), activation temperature and activation time on iodine number obtained by H3PO4 activation at different temperatures ranging from 400°C-600 °C is shown in Table 1.
| Parameters | N° Activated Carbon | T°C | Volume of H3PO4(mL) | Mass of biomass (g) | Final mass after carbonization (g) | %R | IN (mg/g) | BM (mg/g) |
|---|---|---|---|---|---|---|---|---|
| Temperature | 1 | 400 | 6.9 | 10 | 4.5 | 45 | 458.006 | 89.765 |
| 2 | 500 | 6.9 | 10 | 4.5 | 45 | 440.345 | 89.723 | |
| 3 | 600 | 6.9 | 10 | 4.6 | 46 | 413.023 | 25.098 | |
| Ratio | 4 | 1:1 | 6.9 | 10 | 4.3 | 43 | 510.33 | 89.098 |
| 5 | 1:2 | 13.8 | 10 | 4.4 | 44 | 533.001 | 89.98 | |
| 6 | 2:1 | 6.9 | 10 | 4.4 | 44 | 489.003 | 45.98 | |
| Time | 7 | 1H | 6.9 | 10 | 4.3 | 43 | 430.098 | 89.56 |
| 8 | 1H | 6.9 | 10 | 4.2 | 42 | 420.435 | 40.87 | |
| 9 | 1H | 6.9 | 10 | 4.2 | 42 | 411.008 | 56.098 |
Table 1: The optimization production of activated carbon from groundnut shells with H3PO4 as activating agent.
In the temperature range studied, from 400°C to 600°C, the iodine number capacity increase with the increase of temperature and reach a maximum value at 500°C then decreases as the temperature further increases. This implies that at high temperature above 500°C result in the development and creation of large pores in the skeleton of activated carbon structure which is likely to be large enough to contain iodine molecules (radius of 0.177 nm), leading to adsorption and desorption processes with decrease in iodine number. Optimum temperature was then obtained at 500°C and activation time at 60 minutes with the impregnation ratio (R) of 1:1.
The Figure 1 above shows the variation of masses with change in temperature and we can notice three main phenomenon which are:

Figure 1: DSC and TGA curve of groundnut shells. Note:  DSC
DSC
Firstly, at 9.67% observed between 20°C to 120°C and this due to the fact that the material undergoes an endothermic process by the loss of water molecules. Secondarily, at 45.35% observed between 200°C and 340°C, characterized by an exothermic reaction due to the degradation of hemicellulose and cellulose. Thirdly, at 25.26% observed between 340ºC and 535ºC characterizing an exothermic process of the degradation of lignin [11].
On the characterization of adsorbent
Infrared spectroscopy analysis of AC and FAC: The FT-IR spectroscopy analysis allows identifying functional groups present on the adsorbents surface. Figures 2 and 3 below shows the FT-IR spectra of AC and FAC before adsorption.
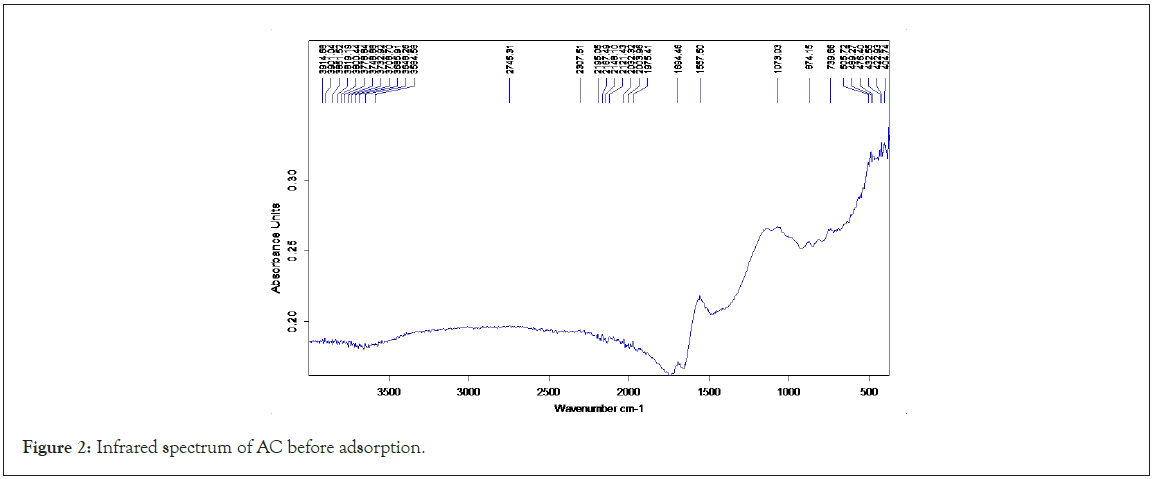
Figure 2: Infrared spectrum of AC before adsorption.

Figure 3: Infrared spectrum of FAC before adsorption.
The most characteristics changed are observed with two peaks, 1702 and 1519 cm-1. The band centered at 1720 cm-1 is ascribed to the stretching vibrations of carboxyl groups on the edge of layer planes or to conjugated carbonyl groups (C=O in carboxylic acid and lactones groups). The weak bans appearing at 1196 cm-1 is ascribe to the formation of or to an increase in the already available oxygen functionalities (highly conjugated C=O stretching, C-O stretching in carboxylic groups and carboxylate moieties). These results indicate that HNO3 treatment gave rise to a greater increase in C=O bonds in carboxylic acid and lactone groups. Shoulder bands at 892 cm-1 may be related to out-of-plate bending modes. The same results were obtained from Ternero-Hidalgo, et al. [12] the formation of more acid or carbonyls groups at 1702 cm-1 which is absence in AC can be explained by the following reactions:

Textural properties of AC and FAC
Scanning electron microscope: Figures 4 and 5 shows the SEM photographs of AC and FAC shells with 10000X magnification.

Figure 4: Scanning electron microscope of AC.
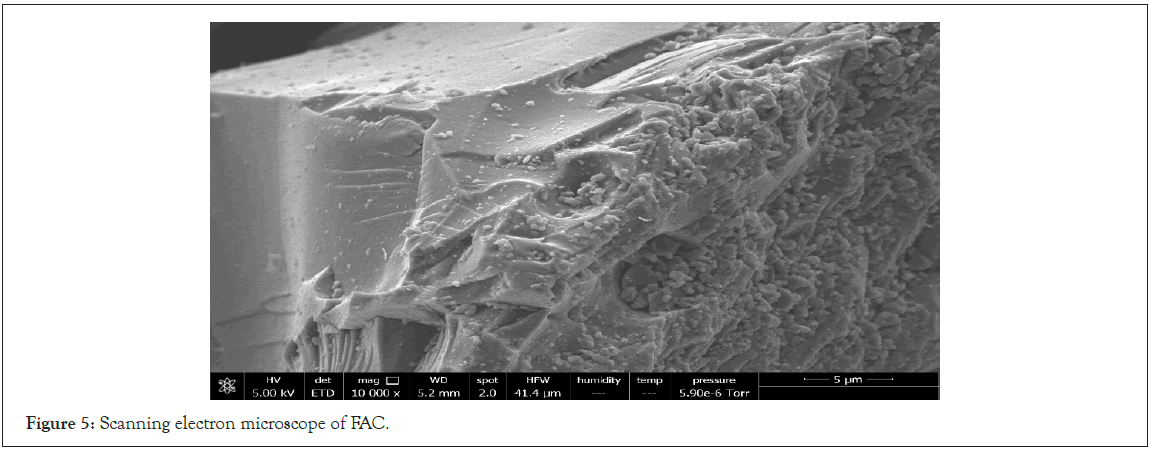
Figure 5: Scanning electron microscope of FAC.
From the Figures 4 and 5 above, we can see that there are more pores available in the AC compare to the FAC. This can be explained by the fact that, during the functionalization, the nitric acid destroyed the pores and also blocked the available pores consequently leading few pores available in FAC.
Textural properties of the AC and FAC
From the Table 2 above, we can see that the Brunauer-Emmtt- Teller (BET) surface of the AC is greater than that of FAC which is concordance with the SEM showing the blockage of the pores by the nitric acid, same is the iodine number of AC is greater than FAC. Hence we can conclude that the nitric acid destroyed the pores when the AC was functionalize with it. This explanation was soon by Ternero-Hidalgo, et al. [12].
| Analysis | AC | FAC |
|---|---|---|
| BET specific surface area (m2/g) | 1383.9237 | 1138.1313 |
| Pore adsorption cumulative surface area (m2/g) | 1.82 | 1.62 |
| Pore desorption cumulative surface area (m2/g) | 2.45 | 4.32 |
| Total pore volume(cm3/g) | 1.82 | 1.17 |
| Average pore diameter (Å) | 116.35 | 115.63 |
| Iodine Number (mg/g) | 536 | 410 |
Table 2: Textural properties of the AC and FAC.
Boehm titration
The Table 3 below gives the different functional groups and their quantities present in AC and FAC
| Functional groups | Carboxylic group (mol/g) | Lactone groups (mol/g) | Phenolic groups (mol/g) | Acidic groups (mol/g) | Alkaline groups (mol/g) | Total groups (mol/g) |
|---|---|---|---|---|---|---|
| AC | 0.01 | 0.13 | 0.02 | 0.11 | 0.04 | 0.3 |
| FAC | 0.02 | 0.16 | 0.03 | 0.45 | 0.01 | 0.67 |
Table 3: Boehm’s results of functional groups.
From the Table 3 above we can see that the FAC have more carboxylic and acidic functional groups than AC indicating the used of nitric acid that has acidified the medium or the surface of the activated carbon.
Adsorption
All adsorption experiments were carried out at pH 2 because at pH greater than or less than 2, the adsorbed quantities were near to zero. The same results was obtained by Dantio during the Adsorption characteristics for the removal of a toxic dye, tartrazine from aqueous solutions by a low cost agricultural by product. They found that tartrazine was better adsorbed under acid medium.
Determination of the zero-charge point Phzpc
We note that the pHzpc value is 5.20 for CA and 4 for CAF. It’s also known that above the pHzpc the carbon surface is negatively charged and below the pHzpc the surface is positively charged. At pH<pHzpc. These two carbons would be effective in removing negatively charged entities. Conversely, the values of pH>pHzpc, would lead to the production of negatively charged entities on the surface of materials which will not be favorable to the elimination (because of electrostatic repulsions) of anionic pollutant (Figure 6).
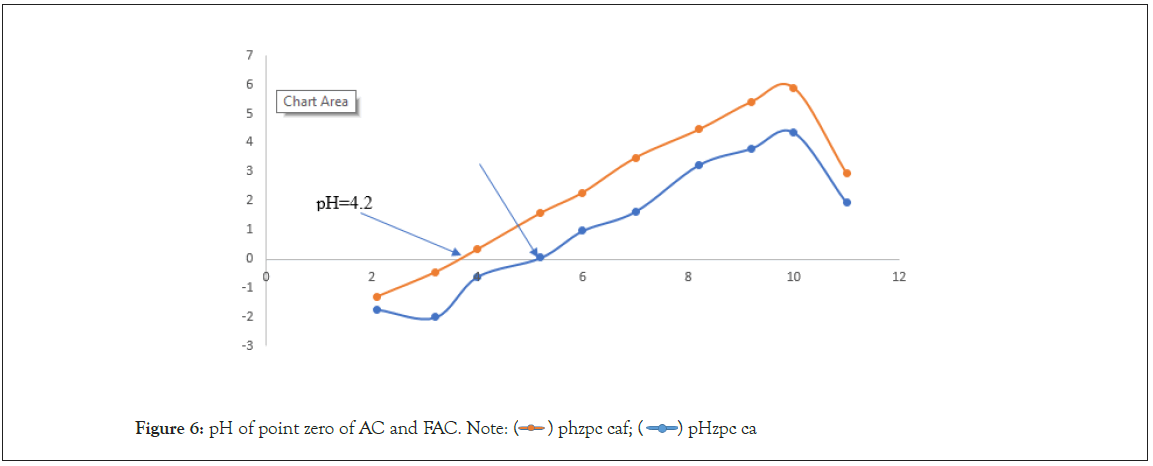
Figure 6: pH of point zero of AC and FAC. Note:  pHzpc ca
Influence of pH
At pH 2, CA and CAF reached the highest Tartrazine adsorption of 11.22 mg/g and 11.59 mg/g respectively (Figure 7). At this pH tartrazine is negatively charged due to the presence of the two sulphonate groups [13]. On the other hand, CA and CAF are positively charge because pH<pHzpc. This therefore result in an electrostatics attraction between the positively charged adsorbent and the negatively charged adsorbent. Thereafter, zero values of the quantity adsorbed are observed when the pH is increased. This is explained by the fact that by increasing the pH, the functional groups of the tartrazine molecules are charged even more negatively while on the surface of the material, there is an increase in HO ions making our materials negatively charged. All this results in a progressive increase in the electrostatic repulsion between the adsorbate, resulting in a decrease in the quality adsorbed. The same result was obtained by [14].
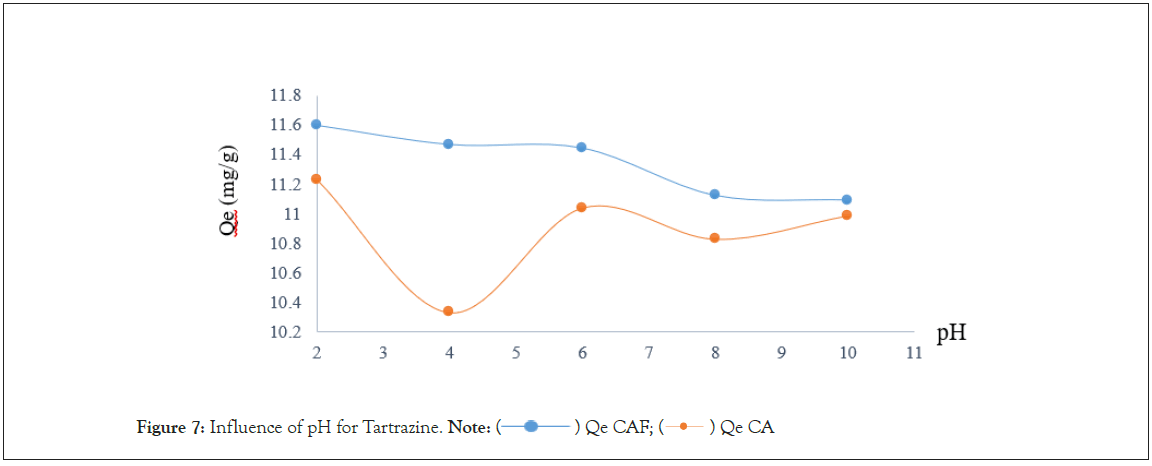
Figure 7: Influence of pH for Tartrazine. Note:  Qe CA
Qe CA
Influence of contact time
The agitation time was evaluated as one of the most important factors affecting the adsorption efficiency. With adsorbent mass of 0.05 g and a pH of 2 under agitation, the agitation time was varied between 5 and 60 minutes. The solutions were removed under their different agitation time and filtered. The filtrates were analyzed using UV-spectrophotometer. The results obtained are grouped in Table of appendices and the relationship of the quantity of metals removed by adsorbents with contact time was plotted and presented in Figure 8.

Figure 8: Influence of contact time on tartrazine adsorption. Note:  Qe CAF
It emerges from this figure that the adsorption of tartrazine in aqueous solution take place in two phases:
(1) The first rapid phase from 0 to 5 minutes for both CA and CAF. It makes possible to reach the maximum quantities of 11.576 mg/g for CA and 11.52 mg/g for CAF. This can be explained by the availability of all adsorption sites on the surface of the adsorbent’s materials. But once the tartrate ions are attached to the surface of the adsorbent, they obstruct the pores preventing the ions remaining in solution from entering them and thus slow the rate adsorption.
(2) The second slow phase is from 10 to 30 minutes CAF and from 10 to 40 minutes for CA. this is due to the progressive saturation of the active site of the two materials. However, it should be noted that the equilibrium is reached at 10 minutes for both CA and CAF. This means they is no significant change in terms of residual concentration value except in CAF that we can notice desorption at 35 minutes. From a thermodynamic view this would be due to the equality between the quantities of tartrate ions fixed when the pores are free and that released when they are saturated, or more precisely, to an adsorption-desorption phenomenon [15].
Influence of adsorbent dose
The study of the effect of adsorbent dosage for the removal of Ta dye was done by varying the mass of the adsorbents, that is, the CA and CAF from 0.01 g to 0.06 g and quantities adsorbed for each adsorbent respectively is represented in Figure 9 below.
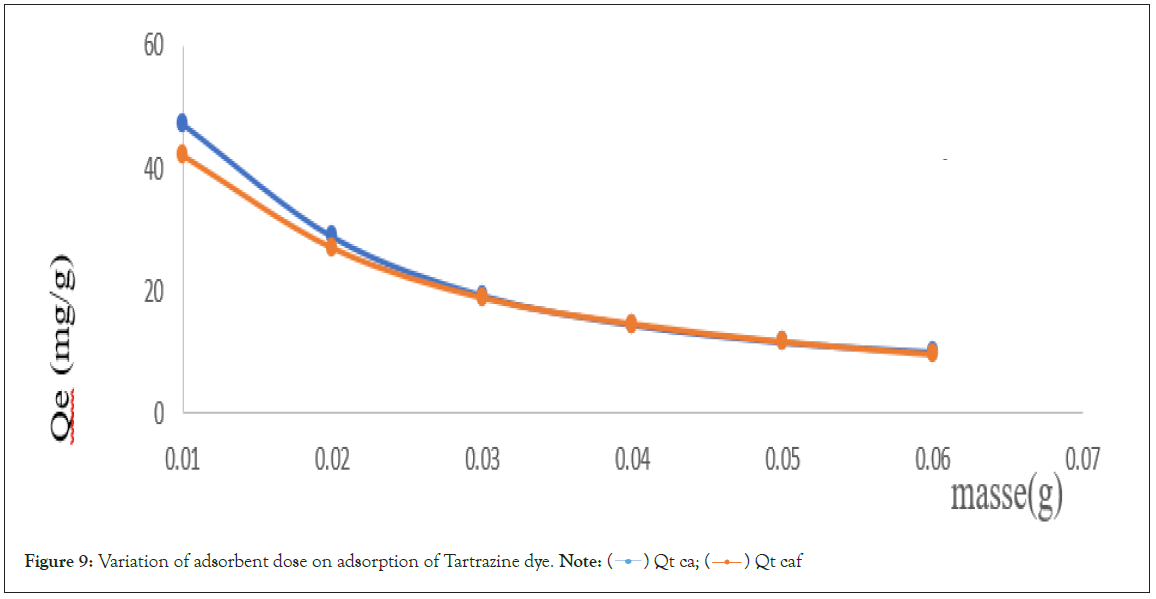
Figure 9: Variation of adsorbent dose on adsorption of Tartrazine dye. Note:  Qt caf
From experiment, we can say that the total active sites of adsorbents decreased with the increased dosage of adsorbents. Again, among the two adsorbents, CA has the highest adsorption capacity toward Tartrazine, regardless of its dosage. The maximum adsorption of Tartrazine with 0.01 g was 47.301 mg/g and 42.01 mg/g with CA and CAF respectively. For CA and CAF, the quantity removed decreased rapidly from 0.01 g to 0.06 g, up to a point where both adsorbents have almost the same adsorption capacity at 0.04 g. This observation is likely due to the overlapping and overcrowding of aggregated particles at a higher dosage, resulting in limited availability of the surface area and exposed active binding sites [16].
Adsorption isotherm
Influence of initial dye concentration: The concentration of IC was varied between 10 ppm to 60 ppm for a pH of 2, adsorbent dose of 0.01 g and a contact time of 10 minutes for CA and CAF. The analytical result obtained was plotted as shown below in Figure 10.

Figure 10: Influence of initial dye concentration with the quantity adsorbed. Note:  Qe ca
Qe ca
There is an increase in the amounts adsorbed when the initial concentrations of tartrate ions range from 10 mg/L to 60 mg/L for CA. The quantity adsorbed goes from 17.72 mg/g to 92.96 mg/g. This increase in the amount adsorbed with the initial concentration is due to the fact that increasing the concentration of tartrazine increases collision between the tartrazine molecules and the adsorption site For CAF there is an increase in the initial concentration from 10 to 50 mg/L. The quantity adsorbed go from 11.01 mg/g to 47.83 mg/g. There is a decrease in the adsorbed quantity from 50 mg/L to 60 mg/L. The quantity adsorbed is from 47.83 mg/g to 32.54 mg/g. This is because at very high concentration, there is accumulation of tartrazine molecules on the surface of the CAF and this result on a reduction in the diffusion path of the tartrate ions towards the adsorption sites [17] (Figures 11 and 12) (Equations 3-5).

Figure 11: F.T.I.R of AC before and after adsorption. Note:  (after ads.)

Figure 12: F.T.I.R of FAC before and after adsorption. Note:  CA (after ads.)
Langmuir isotherm
Influence of initial dye concentration: The concentration of IC

Freundlich isotherm

Dubinin-Kaganer-Radushkevich isotherm

Where Qe is the amount adsorbed at equilibrium (mg/g), KF is the Freundlich constant, 1/n is the heterogeneity factor which is related to the capacity and intensity of the adsorption, and Ce is the equilibrium concentration (mg/L). ε=RTln, (1+1/Ce) is the Dubinin-Kaganer-Radushkevich constant, Qm=theoretical isotherm saturation capacity (mg/g), β is the Dubinin-Kaganer- Radushkevich isotherm constant (mol/kJ).
The adsorption isotherms for ACK and ACP obtained under optimal conditions are shown in Table 4.
| Isotherm | Parameters | CA | CAF |
|---|---|---|---|
| Langmuir model | R2 | 0.901 | 0.94 |
| Qm(mg/g) | 151.515 | 56.818 | |
| KL(L/mg) | 3374.502 | 182.226 | |
| RL | 9.8 × 10⁻⁶ | 1.83 × 10⁻⁵ | |
| Freundlich model | R2 | 0.7125 | 0.7483 |
| KF(L/mg)(L/mg)-1/n | 25.549 | 6.10495 | |
| 1/n | 0.5019 | 0.5141 | |
| Tempkin model | R2 | 0.8136 | 0.6145 |
| KF(L/mg) | 1.27 | 0.979 | |
| bT | 99.96 | -557.14 | |
| D-K-R model | R2 | 0.7735 | 0.836 |
| K(ml2J1) | 4 × 10⁻⁷ | 9 × 10⁻⁸ | |
| Qm(mg/g) | 5.0562 | 6.3623 | |
| E(kJ/mol) | 2.4 | 1.1 |
Table 4: Equilibrium isotherm with the values of differents parameters and constants.
The adsorption isotherm of tartrate ions on CAF is of type IV which reflects the adsorption on mesoporous adsorbents. The presences of two stages may result from the formation of monolayers and then of multilayers between the adsorbate and the surface of the solid [18]. Here the interactions between the molecules and the surface of the material are stronger than those of the molecules between them, the adsorption sites of the second layer only start to be occupied when the first layer is fully saturated. The adsorption isotherm of the tartrate ions on the CA is also the same type, but the level is less pronounced [19,20].
The linear transformations of some isothermal models are represented by the Figures 13-16.

Figure 13: Linear transformation of Langmuir isotherm for CA and CAF. Note:  FAC
FAC

Figure 14: Linear transformation of Freundlich isotherm for CA and CAF. Note:  FAC
FAC

Figure 15: Linear transformation of tempkin model for CA and CAF. Note:  FAC
FAC

Figure 16: Linear transformation of D-R-K model for CA and CAF. Note:  FAC
FAC
This result show that the correlation coefficients for the Langmuir equation close to unity for equation close to unity allow us to note that the modeling of the results is also in agreement with this model according to Prahas, et al. [21]. Langmuir model indicating the homogeneous nature of the considered adsorbent, i.e. there is equal adsorption activation energy for the dye molecules. The data also demonstrate the formation of monolayer coverage of dye molecules at the outer surface of the adsorbent studied. Obtained from the Langmuir model, the maximum monolayer capacities for the adsorption of tartrazine.
Kinetic model
The linear equations of the following kinetic models were used to study the adsorption reaction mechanism (Equations 6-9):
Pseudo first-order model
The linear equations of the following kinetic models were used to 
quations of the

Intra-particle model

Elovich model

Where Qe and Qt are the adsorption capacity at equilibrium and at time t and k1 is the rate constant of pseudo-first order sorption (L.min-1), kid is the intra-particle diffusion constant, C=constant which gives an idea about the thickness of the boundary, α: speed of adsorption (mg.g-1.min-1) and β: desorption constant (g.mg-1). Table 5 shows the comparison of the different kinetic models.
| Kinetics model | Parameters | CA | CAF |
|---|---|---|---|
| Pseudo first-order model | qe (mg/g) | 950 | 1370 |
| K1 (min-1) | 0.0036 | 0.0031 | |
| R2 | 0.1314 | 0.0167 | |
| Pseudo second-order model | qe (mg/g) | 11.4 | 11.49 |
| K2 (g.min-1.mg-1) | 4.04 × 10³ | 8.6 × 10³ | |
| R2 | 0.9922 | 0.9998 | |
| Intraparticle diffusion | Kid (g.min-1.mg-1) | 0.9464 | 0.9115 |
| c | 5.915 | 5.8626 | |
| R2 | 0.4419 | 0.4202 | |
| Mass transfer model | Ko | 0.0103 | 0.0218 |
| D | 1.997 | 11.35 | |
| R2 | 0.2102 | 0.3128 | |
| Elovich model | α (mg/g/min) | 20.52 | 4.67 |
| β (g/mg) | 33.898 | 8.375 | |
| R2 | 0.0737 | 0.0394 |
Table 5: The comparison of the different kinetic models.
It emerges from the above table that only linear coefficient of the pseudo second order model is very close to unity for the two adsorbents. This indicates that chemisorption is the limiting step on the adsorption of tartrate ions on AC and FAC. Moreover, the theoretical and experimental quantities being quite close, further confirm this assertion which was already obtained with the IR spectra after adsorption. However, the adsorption rate of AC is lower than FAC. This could be due on the one hand to a slightly faster binding (t=5 mins) of the tartrate ions on the active sites of the AC and the slower anion exchange (t=10 mins) of the FAC and also, to convection forces which are greater with AC than with FAC [21].
Conclusion
The present study whose aim was the adsorption of tartrazine from activated carbon and functionalized activated carbon based Arachis hypogeaeseed shells uptake from aqueous solution has been carried and elucidated with success. In the process, it was noticed that the FAC had a smaller specific surface area of the composite compared to AC. The observation of the surface morphology of the prepared material by AFM end SEM show that the smooth and honeycomb like surface of AC change to rough and compact particles of FAC. The FTIR of AC/CH presented the features of both AC and CH confirming the obtention of composite material. The highest adsorption took place at pH 2 and after just 10 min. So we can suggest that adsorption technology using activated carbon at large scale could be effective and less expensive for removal of Tartrazine from wastewater.
Acknowledgements
The authors of this work sincerely wish to thank the members of the Adsorption and Surface “Research Unit” of the Applied Physical and Analytical Chemistry Laboratory of the University of Yaoundé I.
Author Contribution
All authors contributed to the study conception and design. Betga Alex Worldlight contributed to the conceptualization, methodology, investigation, and writing of original draft. Ntang Albert Nigho, Kouotou Daouda, Maueykeu Harding and Kuisseu Michelle on validation, writing and review of the manuscript. Juluis Ndi Nsami edited the final version of the manuscript and the supervisor of this project.
Conflicts of Interest
The authors declare no conflicts of interest regarding the publication of this paper.
References
- Kouotou D, Manga HN, Baçaoui A, Yaacoubi A, Mbadcam JK. Optimization of activated carbons prepared by and steam activation of oil palm shells. J Chem. 2013.
- Odogu AN, Daouda K, Desiré BB, Nsami NJ, Mbadcam KJ. Removal of indigo carmine dye (ic) by batch adsorption method onto dried cola nut shells and its active carbon from aqueous medium. Int J Eng Sci Res Tech. 2016; 5:874-887.
- Lékéné RB, Nsami JN, Rauf A, Kouotou D, Belibi PD, Bhanger MI, et al. Optimization conditions of the preparation of activated carbon based Egusi (Cucumeropsis mannii Naudin) seed shells for nitrate ions removal from wastewater. J Anal Chem. 2018; 9(10):439.
- Worldlight BA, Nigho NA, Wilfried MH, Michelle K, Daouda K, Nsami NJ. Functionalization of Activated Carbon prepared from groundnut shells (Arachis hypogeae) by the treatment nitric acid: Application in the removal of tartrazine.
- Zing ZB, Belibi BD, Ankoro NO, Kouotou D, Ndi NJ, Mbadcam KJ. Batch adsorption of ammonium ions from synthetic wastewater using local Cameroonian clay and ZnCl2 activated carbon. Int J Eng Sci. 2016; 3:75-85.
- Wei J, Sun W, Pan W, Yu X, Sun G, Jiang H. Comparing the effects of different oxygen-containing functional groups on sulfonamides adsorption by carbon nanotubes: Experiments and theoretical calculation. J Chem Eng. 2017; 312:167-179.
- Kemp K, Griffiths J, Campbell S, Lovell K. An exploration of the follow-up up needs of patients with inflammatory bowel disease. J. Crohn's Colitis. 2013; 7(9):e386-395.
- Ketcha JM, Dina DJ, Ngomo HM, Ndi NJ. Preparation and characterization of activated carbons obtained from maize cobs by zinc chloride activation. J. Am. Chem. Soc. 2012; 2(4):136-160.
- Chowdhury ZZ, Zain SM, Khan RA, Islam MS. Preparation and characterizations of activated carbon from kenaf fiber for equilibrium adsorption studies of copper from wastewater. Korean J Chem Eng. 2012; 29:1187-1195.
- Malesic-Eleftheriadou N, Liakos EV, Evgenidou E, Kyzas GZ, Bikiaris DN, Lambropoulou DA. Low-cost agricultural wastes (orange peels) for the synthesis and characterization of activated carbon biosorbents in the removal of pharmaceuticals in multi-component mixtures from aqueous matrices. J Mol Liq. 2022; 368:120795.
- Quaranta N, Caligaris M, PELOZO G, Cesari A, Cristobal AA. Use of wastes from the peanut industry in the manufacture of building materials. Sustain Cities Soc. 2018:179.
- Ternero-Hidalgo JJ, Rosas JM, Palomo J, Valero-Romero MJ, Rodríguez-Mirasol J, Cordero T. Functionalization of activated carbons by HNO3 treatment: Influence of phosphorus surface groups. Carbon. 2016; 101:409-419.
- Monser L, Adhoum N. Tartrazine modified activated carbon for the removal of Pb (II), Cd (II) and Cr (III). J Hazard Mater. 2009; 161(1):263-269.
[Crossref] [Google Scholar] [PubMed]
- Otavo-Loaiza RA, Sanabria-González NR, Giraldo-Gómez GI. Tartrazine removal from aqueous solution by HDTMA-Br-modified Colombian bentonite. Sci World J.2019.
[Crossref] [Google Scholar] [PubMed]
- Victoire AA, Nsami NJ, Manga NH, Daouda K, Yanou N, Rachel NJ, et.al. The Performance of Activated Carbon Based Cola Nuts Shells for the Removal of Co (II) and Ni (II) Ions from Aqueous Solution.
- Mbadcam JK, Ngomo HM, Tcheka C, Rahman AN, Djoyo HS, Kouotou D. Batch equilibrium adsorption of cyanides from aqueous solution onto copper-and nickel-impregnated powder activated carbon and clay. J Environ Prot. 2009; 3:53-57.
- Anagho SG, Ketcha JM, Tchuifon TD, Ndi JN. Kinetic and equilibrium studies of the adsorption of mercury (II) ions from aqueous solution using kaolinite and metakaolinite clays from Southern Cameroon. Int J Res Chem Environ. 2013; 3(2):1-1.
- Hasbullah TT, Selaman OS, Rosli NA. Removal of methylene blue from aqueous solutions using chemical activated carbonprepared from jackfruit (Artocarpus heterophyllus) peel waste. Int J Civ Eng. 2014; 5(1):34-38.
- Kučić D, Markić M, Briški F. Ammonium adsorption on natural zeolite (clinoptilolite): Adsorption isotherms and kinetics modeling. Holistic Approach Environ. 2012; 2(4):145-158.
- Halim AA, Latif MT, Ithnin A. Ammonia removal from aqueous solution using organic acid modified activated carbon. World Appl Sci J. 2013; 24(1):1-6.
- Prahas D, Kartika Y, Indraswati N, Ismadji S. The use of activated carbon prepared from jackfruit (Artocarpus heterophyllus) peel waste for methylene blue removal. J Environ Prot Sci. 2008; 2:1-0.
Citation: Worldlight BA, Nigho NA, kouotou D, Wilfried MH, Michelle K, Nsami JN (2023). Optimal Adsorption Conditions for Tartrazine using Activated Carbon prepared from groundnut shells (Arachis hypoheae): A Comparison between Functionalized and Non-functionalized Carbon Adsorbents. Adv Chem Eng. 13:276.
Copyright: © 2023 Worldlight BA. This is an open-access article distributed under the terms of the Creative Commons Attribution License, which permits unrestricted use, distribution, and reproduction in any medium, provided the original author and source are credited.
