

Indexed In
- Academic Journals Database
- Genamics JournalSeek
- Academic Keys
- JournalTOCs
- China National Knowledge Infrastructure (CNKI)
- Scimago
- Access to Global Online Research in Agriculture (AGORA)
- Electronic Journals Library
- RefSeek
- Directory of Research Journal Indexing (DRJI)
- Hamdard University
- EBSCO A-Z
- OCLC- WorldCat
- SWB online catalog
- Virtual Library of Biology (vifabio)
- Publons
- MIAR
- University Grants Commission
- Geneva Foundation for Medical Education and Research
- Euro Pub
- Google Scholar
Useful Links
Share This Page
Journal Flyer
Open Access Journals
- Agri and Aquaculture
- Biochemistry
- Bioinformatics & Systems Biology
- Business & Management
- Chemistry
- Clinical Sciences
- Engineering
- Food & Nutrition
- General Science
- Genetics & Molecular Biology
- Immunology & Microbiology
- Medical Sciences
- Neuroscience & Psychology
- Nursing & Health Care
- Pharmaceutical Sciences
Research - (2022) Volume 14, Issue 3
Modeling and Optimization of 1-Kestose Production by Schedonorus arundinaceus 1-SST
Duniesky Martínez1, Roberto J. Cabrera2, Iván Rodríguez2, Carmen Menéndez3, Alina Sobrino1, Lázaro Hernández3 and Enrique R. Pérez1*2Departamento de Ingeniería Química. Facultad de Química- Farmacia. Universidad Central “Marta Abreu” de Las Villas. Carretera a Camajuaní Km. 5 y 1/2. Santa Clara. Villa Clara., Cuba
3Grupo Tecnología de Enzimas, Dirección de Investigaciones Agropecuarias, Centro de Ingeniería Genética y Biotecnología (CIGB), Ave 31 entre 158 y 190, Apartado Postal 6162, Habana, 10600, Cuba
Received: 01-Feb-2022, Manuscript No. JMBT-22-15279; Editor assigned: 03-Feb-2022, Pre QC No. JMBT-22-15279 (PQ); Reviewed: 17-Feb-2022, QC No. JMBT-22-15279; Revised: 24-Feb-2022, Manuscript No. JMBT-22-15279 (R); Published: 04-Mar-2022, DOI: 10.35248/2157-7471.22.14.489
Abstract
In current commercial mixtures of inulin-type fructooligosaccharides (FOS) synthesized from sucrose by fungal fructosyltransferases, 1-kestose has superior bifidus-stimulating effect than nystose and frutosyl-nystose. In this study, a recombinant sucrose:sucrose 1-fructosyltransferase (1-SST, EC 2.4.1.99) from the plant Schedonorus arundinaceus (Sa) was the enzyme of choice to maximize the batch production of 1-kestose in a jacketed agitated vessel. Mathematical models were developed to predict the optimal conditions for the sucrose conversion reaction and the subsequent enzyme inactivation to prevent 1-kestose hydrolysis. After programed heat inactivation of Sa1-SSTrec in optimized batch experiments with different enzyme and sucrose concentrations, 1-kestose represented more than 90% of total FOS content (53%-58%, w/w) in the reaction mixture. The mathematical models described herein are suitable tools for the cost-effective production of 1-kestose in scaled batch reactions.
Keywords
Thermal conductivity; Kinetic modeling; Fructooligosaccharides
Introduction
Prebiotics confer health benefits associated with a selective enhancement of beneficial bacteria in the human gut microbiota, such as Bifidobacteria and Lactobacilli [1,2].
Some of the most commonly investigated oligosaccharides for prebiotic activity are fructooligosaccharides (FOS). Generally, they are a mix of fructose-based oligomers mainly composed of 1-kestose (GF2), nystose (GF3) and frutosyl-nystose (GF4). Some studies demonstrated that 1-kestose exerts a strong growth activity on Bifidobacterium and Faecalibacterium prausnitzii [3-7]. The strong bifidogenic activity of 1-kestose, was associated with several beneficial effects in the host, increased level of cecal butyrate and decreased level of serum insulin [3], but also 1-kestose-rich diet has a potential to enhance antioxidative activity [8] and might lead to an improvement in atopic dermatitis symptoms in infants [4], also an increase in muscle mass associated with the prebiotic effects of 1-kestose in super-elderly patients with sarcopenia has been observed [9]. It has been reported the superiority of 1-kestose to mixed FOS in the selective stimulating activity on beneficial microbiota [10,11]. These findings suggest the potential of 1-kestose to be a prebiotic for improving the health of the host.
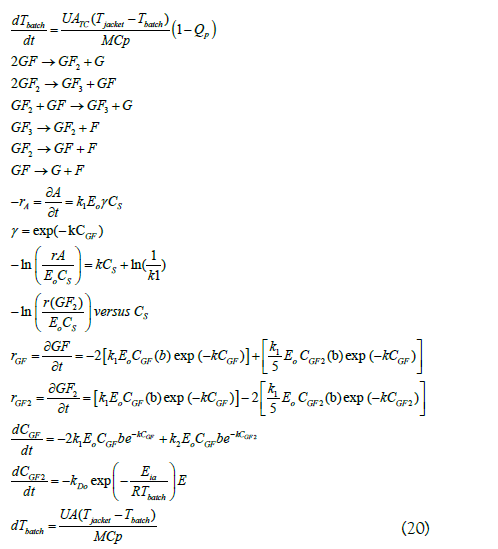
FOS is in novo synthesized from sucrose by β-D-fructosyltransferases, EC 2.4.1.99). The transfructosylation of sucrose takes place via the cleavage of the β-2,1-glycosidic bond and the transfer of the fructosyl moiety onto any acceptor other than water, such as sucrose or a fructooligosaccharide. This synthesis is a complex process in which occurs a consecutive set of reactions, GFn+GFn → GFn−1+GFn+1, both in parallel and in series, because short chain FOS are also potential substrates of fructosyltransferases [12- 14].
Sa1-SSTrec is a recombinant fructosyltransferase from tall fescue (Schedonorus arundinaceus) constitutively expressed in Pichia pastoris. The free Sa1-SSTrec or the immobilized recombinant P. pastoris reaction with sucrose, at the optimal time, lack of intrinsic sucrose hydrolysis and yield 1-kestose and nystose with their sum representing 55%-60% (w/w) of total sugars. However as the reaction proceeds the fructosyl moiety of sucrose is transferred to 1-kestose and the nystose concentration increases, also the use of 1-kestose as fructosyl donor regenerates sucrose and a small quantity of fructose appears reflecting the beginning of 1-kestose hydrolysis [15,16]. As consequence, if the reaction is not stopped at the proper time there is a reduction in 1-kestose yield. Efficiency of 1-kestose production can be improved by enzyme inhibition at a time that avoid its conversion to GF3 but let reach the higher GF2 concentration.
Key factors for the enzyme stability are temperature and the total concentration of saccharides in a reaction mixture. Model the rate of enzyme inactivation in function of the temperature may allow a maximum 1-kestose synthesis. Different mechanisms have been proposed to describe enzyme inactivation by increasing temperature. The two-state model postulates an active enzyme form that irreversibly transforms into a denatured form upon heating [17,18]. The Equilibrium Model introduces an inactive intermediate state which is in rapid equilibrium with the active state of the enzyme. This inactive intermediate simultaneously denatures irreversibly, albeit at a slower rate [19-22]. The Transient model is based on a microscopic approach. Similar to Equilibrium model, the Transient model postulates that each enzyme molecule can exist in one of three states: Active, and two reversibly inactive states. Transitions between these states are driven by thermodynamic factors [23]. Also, enzyme inactivation has been described by a very simple onestage mechanism in which it is assumed that the enzyme suffers a highly cooperative conformational transition from a native active structure to an unfolded completely inactive form [24]. To select a model, it should adequately fit the experimental data but is better to use the simplest one so as to deal with a reasonable number of inactivation parameters.
However the enzyme thermal inactivation also depends of the temperature in the system. Agitated vessels are used very commonly in the industrial production; it is very well known that agitating improves the heat transfer. The overall heat transfer coefficient in the jacketed agitated vessel should be determined, to know the variation of the temperature in the reaction system. So, if a maximum of GF2 is desired, mathematical models of 1-kestose synthesis, enzyme inactivation and the temperature change in the reactor are need.
The aim of this work is to apply a general model for an isothermally jacketed agitated vessel to predict the Sa1-SSTrec reaction progress and stop it, by heating the system, to maximize the synthesis of 1-kestose from sucrose. The integration of different models is of great interest for defining strategies that allow the optimization and industrial scale-up of these bioprocesses.
Materials and Methods
Enzyme and reagents
The enzyme sucrose-sucrose 1-fructosyltransferase (Sa1-SSTrec) from Schedonorus arundinaceus was obtained as described Hernández et al. [15]. Class I refined sugar was used in the experiments. The rest of the reagents used were supplied by the commercial company AppliChem (Germany).
Carbohydrate analysis
Quantitative sugar analysis was performed by HPLC using an Aminex HPX-42C column (0.78 × 30 cm, BIORAD) equipped with a refractive index detector. The column temperature was kept at 85°C. Water was used as a mobile phase at a flow rate of 0.5 mL/ min. Samples were appropriately diluted before injection. Fructose,glucose, sucrose, nystose and 1-kestose (20 mg/mL) were used as standards.
Enzyme assays
One unit of Sa1-SSTrec is defined as the amount of enzyme required to release 1 μmol of glucose per min in the initial rate of the reaction with 1.46 M (500 g/l) sucrose in 0.1 M sodium acetate buffer (pH 5.5) at 30°C. Glucose released from the substrate was quantified by the Dinitrosalicylic Acid (DNSA) colorimetric method [25].
Time-course FOS production from sucrose
Product profile was determined in time-course reactions using 6000 U/L of Sa1-SSTrec at 600 g/L of sucrose. Samples (0.5 mL) were withdrawn at time intervals, incubated in boiling water for 5 min to stop the reaction, and analyzed by HPLC. The effect of sucrose concentration on FOS production was examined in 10 min reactions using 6000 U/L of Sa1-SSTrec at different initial sucrose concentrations. Glucose released from the substrate was quantified by the Dinitrosalicylic Acid (DNSA) assay. To validate the application of the integrated models, 1-kestose formation kinetics was carried out at a sucrose concentration of 600 and 800 g/L with 6000 and 4000 U/L of Sa1-SSTrec, respectively, the enzyme was inactivated heating with water at 71.5°C. All reaction mixtures were prepared in 0.1 M sodium acetate buffer (pH 5.5). Batch reactions were conducted in a 0.1-L jacketed reactor with stirring at 100 rpm and 45°C.
Effect of temperature on enzymatic inactivation
To evaluate the effect of temperature on enzymatic inactivation, experiments were carried out at temperatures between 45 and 70°C under reactive conditions. All reaction mixtures were prepared in 0.1 M sodium acetate buffer (pH 5.5). Batch reactions were conducted in a 0.1-L jacketed reactor with stirring at 100 rpm. To 80 mL of sucrose 800 g/L enzyme was added at 6000 U/L and samples were taken at regular intervals depending on the incubation temperature. The samples (100 µL) were chilled on ice and enzymatic activity was performed after the appropriate dilution. For blanks, samples were deactivated at 100°C for 5 minutes and enzymatic activity was performed. In both cases, enzyme assay was performed as described above.
The model proposed by Illanes (2008) was used to describe the behavior of enzymatic deactivation [24].
The integral of the equation explains a decreasing exponential profile of enzyme activity as a function of time:

Resulting:

Where Eo is the initial enzyme concentration (U/L); E is the residual enzyme concentration (U/L); kD is the first-order inactivation rate constant (min-1); kDo is the inactivation constant (min-1); Eia is the energy of activation of the process of enzyme inactivation (kJ/mol); R is the universal gas constant (kJ/mol K) and T is the temperature (K).
Calculation of the overall heat transfer coefficient
The overall heat transfer coefficient (U) was theoretically determined assuming that the heat flux is one-dimensional flow of heat across the radial direction and that the jacket heating medium is an isothermal liquid [26,27].
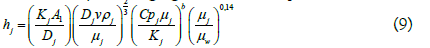
For the calculation of the individual heat transfer coefficients (h) both in the jacket and in the reaction mixture, the equations that relate it to the dimensionless numbers Nusselt (Nu), Reynolds (Re) and Prandlt (Pr) were taken into account.
Below are the corresponding equations for calculating the heat transfer coefficient for the jacket, where water is used as the heating medium.
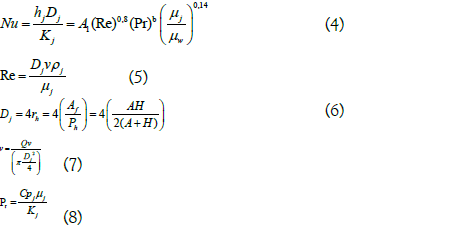
The heat transfer coefficient of the jacket heating medium was calculated by rearranging the terms in equation (4):
The corresponding equations for calculating the heat transfer coefficient for the reaction mixture are shown below.
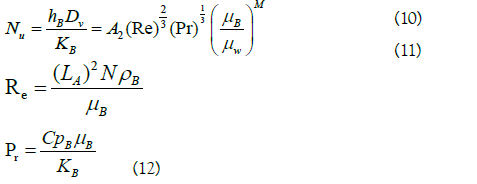
The heat transfer coefficient for the reaction mixture was calculated by rearranging the terms in equation (10):
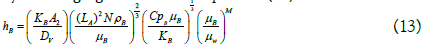
Subscripts J and B correspond to the terms referring to the jacket and the reaction mixture, respectively. h is the heat transfer coefficient of the liquid (W/m2•K); DJ is the equivalent diameter of the cross flow in the jacket (m); rh is the wet radius (m); Af is the flow area (m2); Ph is the wet perimeter (m); A is the width of the jacket (m); H is the height of the jacket (m); Qv is the volumetric flow (m3/s); k is the thermal conductivity of the liquid at the average temperature (W/m•K); v is the velocity of the heating medium in the jacket (m/s); μ is the viscosity of the liquid at the average temperature (Pa•s); μw is the viscosity of the jacket heating medium at the wall temperature (Pa•s); Cp is the heat capacity of the liquid at the average temperature (J/kg•K); ρ is the density of the liquid at the average temperature (kg/m3); Dv is the diameter of the glass (m); LA is the diameter of the stirrer (m); N is the stirring speed (rps). A1=0.0243, b=0.4, A2=0.36 and M=0.21 are recommended constants for heating.
To determine the physical and thermodynamic properties of the sugar solution, the following empirical equations described by Echeverri Ocampo, 2005[28]:
Viscosity
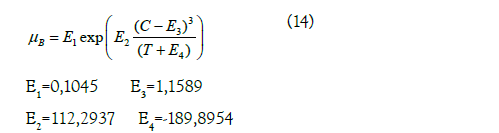
Where: μB is the viscosity (cP); C is the mass fraction of sucrose in solution. E1, E2, E3 and E4 are constants.
Density

Where: ρB is the density (kg/m3); C is the mass fraction of sucrose in the solution and T is the temperature (ºK).

Where: Cp is the specific heat (J/kg K); Cpwater is the water specific heat (J/kg K).
Thermal conductivity

Where: kB is the thermal conductivity (W/cmºC); kwater is the thermal conductivity of water at the temperature in question (W/ cmºC); α=556 is a constant and p is expressed in grams of sucrose for every 100 g of solution.
Finally, the global heat transfer coefficient can be determined using the following equation:
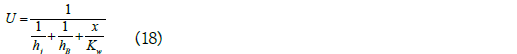
Where: U is the overall coefficient of heat transfer (W/m2 ºC); x is the wall thickness of lot (ft); kw is the thermal conductivity of the heat exchange plate (W/h m ºC).
The actual values used in the calculation of U for 80 mL of reaction are shown in Table 1.
| Water (Propierties were determined at 47°C) |
Sugar solution (Propierties were determined at 45°C) |
|||||
|---|---|---|---|---|---|---|
| Symbol | Units | Value | Symbol | Units | Value | |
| A | m | 0.0328 | LA | M | 0.105 | |
| H | m | 0.1476 | N | Rps | 6000 | |
| Qv | m3/s | 1.2713 | C | - | 0.65 | |
| ρJ | kg/m3 | 61.781(30) | Bx | - | 65.00 | |
| μJ | Pa•s | 1.396(30) | Kwater | W/m•K | 0.368(30) | |
| μw | Pa•s | 1.396(30) | P | - | 0.65 | |
| CpJ | J/kg•K | 0.998(30) | ||||
| kJ | W/m•K | 0.369(30) | ||||
| Bioreactor data (Material: Glass) | ||||||
| Symbol | Units | Value | ||||
| kw | W/m•K | 0.6066(27) | ||||
| Dv | M | 0.1480 | ||||
| X | M | 0.0033 | ||||
| ATC | m2 | 0.01 | ||||
Table 1: Physical and thermodynamic properties of the heat exchange elements [27,30].
The overall heat transfer coefficient (U) was substituted into a non-steady state equation (18), which takes into account the time required to change the batch temperature and uses a temperature difference that varies with time. Furthermore, the equation considers isothermal flow in the jacket [27].

For the heat transfer was also considered a heat loss (Qp) up to 2%.
Where: M is the mass of the liquid (kg), Cp is the specific heat (J/kg ºC); ATC is the heat transfer area (m2); U is the overall coefficient of heat transfer (W/m2 ºC); Tjacket is the temperature of the heating medium in the jacket (ºC); Tbatch is the temperature of the reaction mixture (ºC) at any time “t” (s); Qp is the heat loss equal to 2%.
To evaluate the model of heat transfer in the stirred batch reactor, various experiments were carried out varying the temperature of the heating medium (water) 56.5°C; 66.5°C and 76.5°C. The sucrose solution (65ºBx) 0.1 M sodium acetate buffer (pH 5.5) was added to a 0.1-L jacketed reactor with stirring at 100 rpm. In each experiment, temperature data over time (Δt=1 minute) were taken and compared with the theoretical results calculated according to equation (20).
Models simulation for maximum 1-kestose production
A stand-alone Matlab® [version 7.1.0.246 (R14)] application, enabling the facile derivation of the Models parameters, progress curves (1-kestose synthesis, enzyme deactivation and heat transfer) could be displayed. This application is suitable for computers running Microsoft® Windows XP, and is for non-commercial research purposes only.
Results and Discussion
Mathematical model for optimal 1-kestose synthesis by Sa1- SSTrec
Figure1 shows the typical product profile of the reaction with Sa1- SSTrec under the condition of 45°C, 100 rpm, pH 5.5 sodium acetate buffer 0.1 M, sucrose 600 g/L and 6000 U/L. Sucrose was converted to FOS (GF2 and GF3) and glucose. Sucrose concentration decreased from 600 g/L to 102.2 g/L reaching a plateau after 3 h. GF2 reached a maximum of 319.5 g/L after 2.5 h, then decreased to 237.4 g/L in contrast, GF3 increased gradually, GF4 formation was not observed. Thus, FOS composition increased to 55–60% of total carbohydrate. Glucose concentration also increased gradually but fructose concentration was negligible because hydrolysis reactions of sucrose and FOS did not occur until the maximum FOS was obtained. After 3 h fructose was observed because of sucrose hydrolysis.

Figure 1: Product profile for the Sa1-SSTrec reaction. The reaction was at 45ºC, 100 rpm, pH 5.5 sodium acetate buffer 0.1 M, sucrose 600 g/L and 6000 U/L. Note: (Δ) Sucrose, (□) 1-kestose, (◊) nystose, (x) Glucose, (*) Fructose, (●) total FOS.
Six reactions based on the possible mechanism of action of fructosyltransferases have been proposed to describe the mechanism of FOS production, using enzymes that produce GF4 as longest chain FOS (Figure 2) [13,31,32].
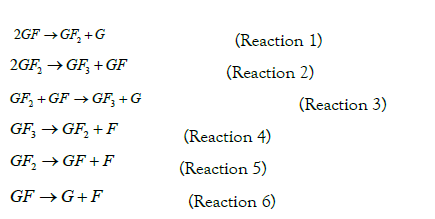
Reaction mechanism for FOS production from sucrose by using fructosyltransferase. Nomenclature: GF sucrose, GF2 1-kestose, GF3 nystose, GF4 frutosyl-nystose, G glucose.
Based on experimental data with Sa1-SSTrec, 1-kestose is the main fructooligosaccharide, corresponding to reaction 1 and in the last hours of the kinetics appears also nystose as described by reaction 2. Based on the experimental results, it was further assumed that the hydrolysis of sucrose (reaction 6) as well as the transfructosylations of reactions 3 and 4 does not occur and that the formation of fructose by hydrolysis of 1-kestose in the maximum FOS production range is negligible (reaction 5).
Figure 2 shows that with increasing initial sucrose concentration from 0.294 to 1460 mM, the initial transfructosylation rates progressively increases. From 1460 mM the reaction rate remains approximately constant. These results show an unusual behavior to those reported for most of the fungus fructosyltransferases, since the maximum rate is reached at high concentrations of sucrose and from that point does not decrease [12,33]. Therefore, neither the Michaelis-Menten nor the substrate inhibition mechanisms are correct interpretations for the enzyme-substrate interaction.

Figure 2: Initial transfructosylation rates as a function of substrate concentration. The reactions were developed at 45ºC, 100 rpm pH 5.5 in sodium acetate buffer 0.1 M and 6000 U/L, for 10 min. The symbol (♦) represents the media ± the standard deviation of three experiments and the line is the simulation result.
For Aureobasidium pullulans fructosyltransferase this behavior was attributed to the non-ideal thermodynamic effect characteristic of high sucrose concentrations [34]. As a simplified representation of this theory, equation (21) expressing transfructosylation as a linear function of sucrose activity was suggested [34,35].
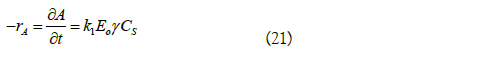
Where: rA is the rate of appearance of the product (mmol/L min); k1 is the rate constant (L/U min); CS is the substrate concentration (mmol/L); Eo is the initial enzyme concentration (U/L); γ is a dimensionless coefficient of substrate activity calculated from the following equation:
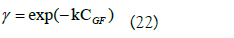
To determine the constants of the model, k and k1, equation (22) was substituted in (21) and it was linearized obtaining the following equality:
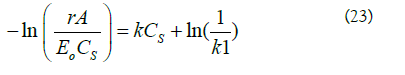
A plot of  gives a straight line, where k is the slope and
 is the intercept. The estimated values for the constants k and k1 were 0.0004 mM-1 and 2.34084 × 10⁻⁶ L/U min,respectively (Figure 3). When experimental data were compared with the theoretical model prediction (Eq. 21), using the calculated constants, an adjustment of R2=0.97 was obtained (Figure 2).

Figure 3: Estimated values for the constants k and k1. Linearized model according to Equation (23), where k is the slope and ln (1/k1 ) is the intercept.
Because the mechanism of action of Sa1-SSTrec is described by a group of parallel-series reactions, the model Eq. 21 only describes the behavior for reaction 1, so it is necessary to find the k and k1 values corresponding to reaction 2, using 1-kestose as substrate. Fructosyltransferases have shown, with 1-kestose as substrate, a reaction rate between 1.77 and 5.72 fold lower than in the presence of sucrose, as has been reported for Rhodotorula sp enzymes and Aereobasidium pullulans, respectively. Other fructosyltransferases have shown intermediate values [14,33,36,37]. Based on these reports and processing the experimental data obtained, the values of k and k1 of reaction 2 were found by trial and error. k1 for reaction 2 is fivefold smaller than the k1 calculated for reaction 1 and k of reaction 2 is the same of that of reaction 1, because if all the substances in the reaction are sugars, there should not be appreciable difference in the activity.
Thus, the equations rate for sucrose and 1-kestose were defined as follows:
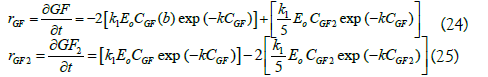
When simulating with the previous models using Matlab software, it was observed that these do not fit correctly because the exponential mathematically does not offer a flexible and/or sensitive line to the change in the initial sucrose concentration, so it was decided to add a coefficient “b” to correct the observed problem.
Predicting a linear behavior, the coefficient “b” was adjusted (by trial and error) for the initial sucrose concentrations of 800 and 600 g/L, obtaining the linear equation that is observed in Figure 4.

Figure 4: Lineal behave of “b” coefficient at different initial sucrose concentration.
Finally, the corrected equations have the following form:
The model corrected with the coefficient “b” was verified by performing kinetics at 600, 700 and 800 g/L of initial sucrose with 6000 U/L and it was also verified with 600 g/L and 3000 U/L. Figure 5 shows that the predicted data are similar to the experimental data, with correlation coefficient higher than 95%, which indicates that the proposed equations, corrected with the coefficient “b”, adequately describe the 1-kestose synthesis by Sa1- SSTrec reaction.

Figure 5: Model validation. Model predictions (lines) and experimental data (symbols). Kinetics were carry out at 45ºC, 100 rpm, pH 5,5 sodium acetate buffer 0.1 M, 6000 U/L at initial sucrose concentration of 600 g/L (□), 700 g/L (○) and 800 g/L (Δ), and 3000 U/L at 600 g/L (◊).
These results also confirm that it was correct to assume that the transfructosylation rate decrease was caused by the non-ideal thermodynamic effect of the high sucrose concentration.
Mathematical modeling of Sa1-SSTrec enzyme inactivation under reactive conditions
Sa1-SSTrec was subjected to temperature between 55 and 70°C to observe the thermal stability in presence of sucrose 800 g/L, enzyme was added at 6000 U/L and samples were taken at regular intervals depending on the incubation temperature.
The inactivation parameter kD (min-1) were determined from the slopes of enzyme inactivation profiles at different temperatures assuming simple first-order kinetics (Figure 6), so that a set of data of kD versus temperature were generated. The linear trend equations showed adjustments higher than 90%. The kD values obtained were -0.0972, -0.2029, -0.7124 and -1.5106 for the temperatures of 55, 60, 65 and 70°C, respectively.

Figure 6: Sa1-SSTrec inactivation profiles at different temperatures according to simple first-order kinetics. Data presented are average values of n=3 independent experiments at 55ºC (x), 60ºC (Δ), 65ºC (◊), 70ºC (□).
–Eia/R and ln(kDo) values were estimated from the slope and intercept of a ln(kD) versus 1/T plot, respectively (Figure 7). The linear trend equation shows a fit of 98.8%. The values obtained for the model constants turned out to be: activation energy of the enzymatic inactivation process Eia=178.2 kJ/mol and the deactivation constant kDo=1.64 × 1027 min-1. Eia is the activation energy of the enzyme inactivation process and its magnitude reflects the minimum energy required for the enzyme inactivation process. This means that more energy is required for promoting enzyme inactivation than for product formation from the enzyme–substrate complex, so both opposing phenomena respond differently to temperature change [24]. The inactivation kinetic model according to equation (2) fitted the curves obtained from experimental data with adjustments of 88, 100, 87, and 94% for temperatures of 55,60, 65, and 70°C, respectively (Figure 8).

Figure 7: Lineal behavior of calculated kD at different temperatures.

Figure 8: Enzyme residual activity at different temperatures. Symbols are average values of n=3 independent experiments at 55ºC (+), 60ºC (Δ), 65ºC (◊) y 70ºC (□). Lines represent the theoretical values for each temperature.
The experimental results carried out at 45 and 50°C, showed that in 5 h of incubation there was no appreciable loss of enzyme activity, however at 55°C in ten minutes more than 60% of the enzyme activity had been lost. Other studies have shown that operational times can abruptly change around the optimum temperature with the variation of 1°C which can result in changes of the operating half-life time in 100 days [38]. The applied model only adjusts to temperatures above 55°C, temperature from which an appreciable enzymatic inactivation begins to occur within the reaction time necessary to obtain the maximum production of 1-kestose.
Mathematical modeling of heat exchange in the jacketed bioreactor
Because enzyme bioreactors are primarily jacketed vessels, the temperature difference during the heating or cooling process is not constant. Therefore, to study the behavior of enzymatic deactivation as a function of temperature, it is first necessary to know the heat transfer in the working system. To determine the overall heat transfer coefficient (UT) in a jacketed agitated vessel system it was assumed that the heat flux is one-dimensional flow of heat across the radial direction and that the jacket heating medium is an isothermal liquid [26,27].
According to the values shown in Table 1, a U value equal to 125.67 W/m2ºC was obtained. This theoretically determined overall heat transfer coefficient was substituted in equation 20, deduced from the non-steady state equation that describes the variation in temperature in the bioreactor.
The previous model was experimentally verified by varying the temperature of the heating medium (water) 56.5°C, 66.5°C and 76.5°C (Tjacket) and measuring the behavior of Tbatch in the bioreactor as a function of time (Δt=60 s). They were compared with the theoretical results calculated according to equation 20 and, as can be seen in Figure 9, there is an adjustment greater than 98% for all the temperatures tested.

Figure 9: Comparison of the experimental and calculated values of the heat transfer in the working system. Water was used as isothermic heating medium at 56.5ºC (Δ), 66.5ºC (□) and 76.5ºC (○). Lines represent the theoretical values at each temperature.
Matlab programming
The application of the models described above, integrated into a general model and with the help of the Matlab® program, it is possible to simulate and optimize 1-kestose batch production in a stirred tank reactor (Table 2).
| Step | Equations |
|---|---|
| Synthesis Kinetic model | 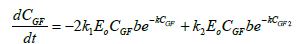 |
| Enzyme thermal deactivation model | 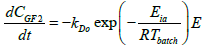 |
| Heat transfer model for a jacketed agitated vessel | 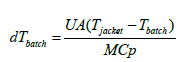 |
Table 2: Equations of ode45 function.
The model proposed in was incorporated into MATLAB® using the ode45 function that is used to solve the ordinary differential equations from initial conditions.
Mathematical models for maximum 1-kestose synthesis from sucrose in an isothermally jacketed agitated vessel.
This function works with a 4th order Runge-Kutta algorithm, being widely used [39]. Previously, all the constants that affect the work system were incorporated into the program. The previous function was nested with the fminsearch function that was used to optimize the 1-kestose concentration by varying the start time of the thermal inactivation process. In this way, the optimal start time of the thermal inactivation process and the maximum 1-kestose concentration that could be reached. The results obtained were graphed using the plot and error bar commands.
The program calculates the time to start the heat inactivation and how long should be the inactivation process to optimize 1-kestose concentration.
In general, the program operates from a “supposed” thermal inactivation start time (td_sup) from which the differential equations corresponding to the kinetic model are solved (by the Runge-Kutta method) initial operating conditions for an iteration time from 0 to td_sup. Then, the differential equations of the models are evaluated again: 1-kestose synthesis kinetic, enzyme thermal inactivation and heat transfer, taking as initial conditions the final concentrations obtained from the previous step beside the initial conditions of thermal inactivation, that is, the initial enzymatic concentration (Eo) and batch temperature (Tbatch). From the results obtained, it is evaluated whether the final concentration obtained is maximum, if not, the value of td_sup is automatically changed until the objective function is optimized and the maximum concentration of 1-kestose is reached. Finally, the program output the values of the optimal time to start thermal inactivation (td_opt) and time of inactivation (Table 3). The reduction of enzyme activity and the temperature profile (Figure 10) and the kinetic profile of 1-kestose concentration with and without inactivation are also displayed (Figure 11)

Figure 10: Variation profile of temperature and enzyme activity during inactivation. A: Sucrose 600 g/L 6000 U/L of Sa1-SSTrec B: Sucrose 800 g/L 4000 U/L of Sa1-SSTrec. Symbols represent the theroretical (-) and experimental (■) variation of the temperature and the theoretical enzyme activity (--). As heating media was used water at 71.5ºC.

Figure 11: Experimental validation of the results obtained from the simulation of the 1-kestose production. A: Sucrose 600 g/L 6000 U/L of Sa1-SSTrec B: Sucrose 800 g/L 4000 U/L of Sa1-SSTrec. Discontinuous lines (--) represent a theoretical kinetic without deactivation; the continuous line (-) represents a theoritical kinetic with thermal inactivation ± standard deviation of 5% and (▲) represents the average values of n=3 independent experiments.
| Output data of simulation | Reaction 1a | Reaction 2b |
|---|---|---|
| Time to start inactivation (min) | 108.2 | 302.9 |
| Time of inactivation (min) | 13 | 13 |
| Maximum 1-kestose expected (g/L) | 306 ± 15c | 407 ± 20c |
Note: aSucrose 600 g/L 6000 U/L of Sa1-SSTrec.
bSucrose 800 g/L 4000 U/L of Sa1-SSTrec.
cA 5% error was assumed, taking into account the standard deviations of the experimental data.
Table 3: Program output values.
Experimental validation of the general model bioreactor in an isothermally jacketed agitated vessel
To validate the application of the integrated models, 1-kestose formation kinetics was simulated at a sucrose concentration of 600 g/L with 6000 U/L of Sa1-SSTrec and 800 g/L with 4000 U/L. The reactions were carry out in a 0.1-L jacketed reactor with stirring at 100 rpm, in both experiments the enzyme was inactivated with water at 71.5°C. The simulation output data are showed in Table 2.
In addition, the program provides the profiles of temperature and concentration of active enzyme as a function of time, during the inactivation period. As can be seen in Figure 11, the proposed models adequately describe the temperature variation in the bioreactor and the loss of enzyme activity as a function of time is also simulated.
The experimental results based on the indications obtained from the simulator allowed reaching a 1-kestose concentration of 323 ± 2 g/L and 423 ± 5 g/L, for 600 g/L and 800 g/L of sucrose, respectively. This value was kept constant without experiencing a decrease observed in the kinetics without deactivation (Figure 11), indicating that the estimated inactivation time and conditions were sufficient to stop the reaction and reach a maximum of 1-kestose within the expected ranges of the simulation. In both cases 1-kestose represented between 53%-54% (w/w) of total sugars. During the Sa1-SSTrec reaction, at the time of maximum yield of 1-kestose, the percentage ratio 1-kestose: nystose reached 90:10. However, without inactivation as the reaction proceeds this ratio can change to around 80:20. After Sa1-SSTrec heat inactivation the 1-kestose percentage remained above 90% of total FOS, which was around 10% higher than that of the batch reaction without inactivation process, both for 600 and 800 g/L of sucrose (Table 4).
| Carbohydrate composition (% w/w)a | |||||||||
|---|---|---|---|---|---|---|---|---|---|
| Without inactivation | With inactivation at 71.5°C | ||||||||
| Reaction time (h) | GF2 | GF3 | FOS yield | Ratio GF2:GF3 | GF2 | GF3 | FOS yield | Ratio GF2:GF3 | |
| 0.5 | 18.7 | 0.0 | 18.7 | 100:0 | 19.1 | 0.0 | 19.1 | 100:0 | |
| 1.0 | 33.3 | 0.0 | 33.3 | 100:0 | 34.8 | 0.0 | 34.8 | 100:0 | |
| 1.5 | 46.0 | 1.0 | 47.0 | 98:2 | 47.3 | 0.3 | 47.3 | 99:1 | |
| 2.0 | 50.9 | 2.3 | 53.2 | 96:4 | 53.5 | 0.6 | 53.5 | 99:1 | |
| 2.5 | 53.0 | 4.2 | 57.2 | 93:7 | 53.9 | 2.2 | 56.1 | 96:4 | |
| 3.0 | 53.3 | 6.4 | 59.7 | 89:11 | 54.0 | 2.3 | 56.3 | 96:4 | |
| 3.5 | 51.8 | 8.8 | 60.6 | 85:15 | 53.4 | 2.5 | 55.9 | 95:5 | |
| 4.0 | 49.7 | 11.3 | 61.0 | 81:19 | 54.1 | 2.2 | 56.3 | 96:4 | |
| Carbohydrate composition (% w/w)b | |||||||||
| Without inactivation | With inactivation at 71.5°C | ||||||||
| Reaction time (h) | GF2 | GF3 | FOS yield | Ratio GF2:GF3 | GF2 | GF3 | FOS yield | Ratio GF2:GF3 | |
| 1 | 12.9 | 0.0 | 12.9 | 98:2 | 13.9 | 0.0 | 13.9 | 100:0 | |
| 2 | 26.7 | 0.4 | 27.2 | 97:3 | 29.4 | 0.0 | 29.4 | 100:0 | |
| 3 | 37.8 | 1.3 | 39.1 | 95:5 | 40.0 | 0.0 | 40.0 | 100:0 | |
| 4 | 46.1 | 2.5 | 48.5 | 93:7 | 48.3 | 3.2 | 51.5 | 94:6 | |
| 5 | 51.6 | 3.9 | 55.5 | 91:9 | 52.0 | 4.7 | 56.6 | 92:8 | |
| 6 | 53.1 | 5.3 | 58.5 | 87:13 | 53.1 | 5.3 | 58.5 | 91:9 | |
| 7 | 52.3 | 7.5 | 59.8 | 84:16 | 53.6 | 5.3 | 58.9 | 91:9 | |
| 8 | 51.6 | 9.7 | 61.3 | 84:16 | 53.0 | 4.8 | 57.8 | 92:8 | |
Note: aReaction with 600 g/L of sucrose and 6000 U/L of Sa1-SSTrec.
bReaction with 800 g/L of sucrose and 4000 U/L of Sa1-SSTrec.
Table 4: Effect of Sa1-SSTrec inactivation on FOS production.
Conclusion
Three mathematical models were used to describe the work system: A simplified model expressing transfructosylation as a linear function of sucrose; the enzyme inactivation based on a first-order kinetic model described by the first rate inactivation constant, and the model that use the overall heat transfer coefficient on a nonsteady state equation that describes the variation in temperature in the bioreactor. The integration of the models in the Matlab program, has been demonstrated the best predicted-experimental data adjustment for 1-kesose synthesis. They provide the inactivation time need to start thermal inactivation of Sa1-SSTrec in an isothermally jacketed agitated vessel to gives satisfactory results for the maximum 1-kestose concentration. Therefore, these models are suitable tools for process design and optimization in 1-kestose batch production at different initial sucrose and enzyme concentrations.
REFERENCES
- Roberfroid MB. Inulin-type fructans: Functional food ingredients. J Nutr. 2004;137(11).
[Google Scholar], [Crossref], [Pubmed].
- Ose R, Hirano K, Maeno S, Nakagawa J, Salminen S, Tochio T, et al. The ability of human intestinal anaerobes to metabolize different oligosaccharides: Novel means for microbiota modulation? Anaerobe. 2018;51:110-119.
[Google Scholar], [Crossref], [Pubmed].
- Tochio T, Kitaura Y, Nakamura S, Sugawa C, Takahashi M, Endo A, et al. An alteration in the cecal microbiota composition by feeding of 1-kestose results in a marked increase in the cecal butyrate content in rats. PLoS One. 2016;11(11).
[Google Scholar], [Crossref], [Pubmed].
- Koga Y, Tokunaga S, Nagano J, Sato F, Konishi K, Tochio T, et al. Age-associated effect of kestose on Faecalibacterium prausnitzii and symptoms in the atopic dermatitis infants. Pediatr Res. 2016;80(6):844-851.
[Google Scholar], [Crossref], [Pubmed].
- Watanabe A, Kadota Y, Yokoyama H, Tsuruda S, Kamio R, Tochio T, et al. Experimental determination of the threshold dose for Bifidogenic activity of dietary 1-kestose in rats. Foods. 2019;9(1):4.
[Google Scholar], [Crossref], [Pubmed].
- Endo A, Hirano K, Ose R, Maeno S, Tochio T. Impact of kestose supplementation on the healthy adult microbiota in in vitro fecal batch cultures. Anaerobe. 2020;61:102076.
[Google Scholar], [Crossref], [Pubmed].
- Watanabe A, Tochio T, Kadota Y, Takahashi M, Kitaura Y, Ishikawa H, et al. Supplementation of 1-kestose modulates the gut microbiota composition to ameliorate glucose metabolism in obesity-prone hosts. Nutrients. 2021;13(9):2983.
[Google Scholar], [Crossref], [Pubmed].
- Tochio T, Ueno Y, Kitaura Y, Shinohara M, Kadota Y, Minoda K, et al. Feeding of 1-kestose induces glutathione-S-transferase expression in mouse liver. Foods. 2019;8(2):69.
[Google Scholar], [Crossref], [Pubmed].
- Tominaga K, Tsuchiya A, Nakano O, Kuroki Y, Oka K, Minemura A, et al. Increase in muscle mass associated with the prebiotic effects of 1-kestose in super-elderly patients with sarcopenia. Biosci Microbiota Food Health. 2021;40(3):150-155.
[Google Scholar], [Crossref], [Pubmed].
- Suzuki N, Aiba Y, Takeda H, Fukumori Y, Koga Y. Superiority of 1-kestose, the smallest fructo-oligosaccharide, to a synthetic mixture of fructo-oligosaccharides in the selective stimulating activity on bifidobacteria. Biosci Microflora. 2006;25(3):109-116.
[Google Scholar], [Crossref].
- Tochio T, Kadota Y, Tanaka T, Koga Y. 1-kestose, the smallest Fructooligosaccharide component, which efficiently stimulates faecalibacterium prausnitzii as well as bifidobacteria in humans. Foods. 2018;7(9):140.
[Google Scholar], [Crossref], [Pubmed].
- Alvarado-Huallanco MB, Maugeri-Filho F. Kinetics and modeling of Fructo-oligosaccharide synthesis by immobilized fructosyltransferase from Rhodotorula sp.. J Chem Technol Biotechnol. 2010;85(12):1654-1662.
[Google Scholar], [Crossref].
- Guio F, Rugeles LD, Rojas SE, Palomino MP, Camargo MC, Sánchez OF. Kinetic modeling of fructooligosaccharide production using Aspergillus oryzae N74. Appl Biochem Biotechnol. 2012;167(1):142-163.
[Google Scholar], [Crossref], [Pubmed].
- Vega R, Zuniga-Hansen ME. A new mechanism and kinetic model for the enzymatic synthesis of short-chain fructooligosaccharides from sucrose. Biochem Eng J. 2014;82:158-165.
[Google Scholar], [Crossref].
- Hernández L, Menéndez C, Pérez ER, Martínez D, Alfonso D, Trujillo LE, et al. Fructooligosaccharides production by Schedonorus arundinaceus sucrose:sucrose 1-fructosyltransferase constitutively expressed to high levels in Pichia pastoris. J Biotechnol. 2018;266:59-71.
[Google Scholar], [Crossref], [Pubmed].
- Pérez ER, Martínez D, Menéndez C, Alfonso D, Rodríguez I, Trujillo LE, et al. Fructooligosaccharides production by immobilized Pichia pastoris cells expressing Schedonorus arundinaceus sucrose:sucrose 1-fructosyltransferase. J Ind Microbiol Biotechnol. 2021;48(5-6).
[Google Scholar], [Crossref], [Pubmed].
- Copeland RA. Enzymes: A practical introduction to structure, mechanism, and data analysis. New Delhi, India. Wiley. 2008.
- Garrett R, Grisham CM. Biochemistry. Boston: Cengage Learning; 2017.
- Daniel RM, Danson MJ, Eisenthal R, Lee CK, Peterson ME. New parameters controlling the effect of temperature on enzyme activity. Biochem Soc Trans. 2007;35(6):1543-1546.
[Google Scholar], [Crossref], [Pubmed].
- Daniel RM, Danson MJ, Eisenthal R, Lee CK, Peterson ME. The effect of temperature on enzyme activity: New insights and their implications. Extremophiles. 2007;12(1):51-59.
[Google Scholar], [Crossref], [Pubmed].
- Daniel RM, Danson MJ, Eisenthal R. The temperature optima of enzymes: A new perspective on an old phenomenon. Trends Biochem Sci. 2001;26(4):223-225.
[Google Scholar], [Crossref], [Pubmed].
- Daniel RM, Peterson ME, Danson MJ, Price NC, Kelly SM, Monk CR, et al. The molecular basis of the effect of temperature on enzyme activity. Biochem J. 2009;425(2):353-360.
[Google Scholar], [Crossref], [Pubmed].
- Chen NG, Gregory K, Sun Y, Golovlev V. Transient model of thermal deactivation of enzymes. Biochim Biophys Acta. 2011;1814(10):1318-1324.
[Google Scholar], [Crossref], [Pubmed].
- Illanes Andrés. Enzyme biocatalysis: Principles and applications. Springer; 2011:145-148
- Miller GL. Use of dinitrosalicylic acid reagent for determination of reducing sugar. J Anal Chem. 1959;31(3):426-428.
[Google Scholar], [Crossref].
- Pietranski JF. Over-all heat transfer coefficients in agitated vessels. 2012.
- Kern DQ. Procesos de Transferencia de Calor. México: Compañía Editorial Continental. 2006:816-820.
- Echeverri V. Control de los Evaporadores de los Laboratorios de Procesos Productivos de la Universidad Nacional de Colombia Sede Manizales. 2005.
- Hugot E. Manual Para Ingenieros Azucareros. 1964.
- Maloney, JO. Conversion Factors and Mathematical Symbols In Perry's chemical engineers Handbook 7th Edition, United States, New York, McGraw-Hill. 2008.
- Alvarado-Huallanco MB, Maugeri-Filho F. Dynamic modeling, simulation and in silico optimization of fructooligosaccharides by immobilized fructosyltransferase in continuous basket reactor. JCST. 2012;1(2):27-33.
- Nishizawa K, Nakajima M, Nabetani H. Kinetic study on transfructosylation by β-fructofuranosidase from Aspergillus niger ATCC 20611 and availability of a membrane reactor for Fructooligosaccharide production. J Food Sci Technol Res. 2001;7(1):39-44.
[Google Scholar], [Crossref].
- Duan KJ, Chen JS, Sheu DC. Kinetic Studies and mathematical model for enzymatic production of fructooligosaccharides from sucrose. Enzyme Microb Technol. 1994;16(4):334-339.
[Google Scholar], [Crossref].
- Antošová M, Illeová V, Vandáková M, Družkovská A, Polakovič M. Chromatographic separation and kinetic properties of fructosyltransferase from Aureobasidium pullulans. J Biotechnol. 2008;135(1):58-63.
[Google Scholar], [Crossref], [Pubmed].
- Shearwin KE, Winzor DJ. Substrate as a source of thermodynamic nonideality in enzyme kinetic studies: Invertase-catalyzed hydrolysis of sucrose. Arch Biochem Biophys. 1988;260(2):532-539.
[Google Scholar], [Crossref], [Pubmed].
- Alvarado-Huallanco MB, Maugeri FF. Kinetic Studies and modelling of the production of Fructooligosaccharides by fructosyltransferase from Rhodotorula sp. Catal Sci Technol. 2011;1(6):1043.
[Google Scholar], [Crossref].
- Jung KH, Yun JW, Kang KR, Lim JY, Lee JH. Mathematical model for enzymatic production of fructo-oligosaccharides from sucrose. Enzyme Microb Technol. 1989;11(8):491-494.
[Google Scholar], [Crossref].
- Onderková Z, Bryjak J, Vaňková K, Polakovič M. Kinetics of thermal inactivation of free Aureobasidium pullulans fructosyltransferase. Enzyme Microb Technol. 2010;47(4):134-9.
[Google Scholar], [Crossref].
- Guckenheimer J. Numerical Analysis of Dynamical Systems. Handbook of Dynamical Systems. Elsevier Sci. 2002;2:345.
[Crossref].
Citation: MartÃnez D, Cabrera RJ, RodrÃguez I, Menéndez C, Sobrino A, Hernández L, et al. (2022) Modeling and Optimization of 1-Kestose Production by Schedonorus arundinaceus 1-SST. J Microb Biochem Technol. 14:489.
Copyright: © 2022 MartÃnez D, et al. This is an open-access article distributed under the terms of the Creative Commons Attribution License, which permits unrestricted use, distribution, and reproduction in any medium, provided the original author and source are credited.