Indexed In
- Open J Gate
- Genamics JournalSeek
- Academic Keys
- JournalTOCs
- ResearchBible
- China National Knowledge Infrastructure (CNKI)
- Scimago
- Ulrich's Periodicals Directory
- Electronic Journals Library
- RefSeek
- Hamdard University
- EBSCO A-Z
- OCLC- WorldCat
- SWB online catalog
- Virtual Library of Biology (vifabio)
- Publons
- MIAR
- Scientific Indexing Services (SIS)
- Euro Pub
- Google Scholar
Useful Links
Share This Page
Journal Flyer

Open Access Journals
- Agri and Aquaculture
- Biochemistry
- Bioinformatics & Systems Biology
- Business & Management
- Chemistry
- Clinical Sciences
- Engineering
- Food & Nutrition
- General Science
- Genetics & Molecular Biology
- Immunology & Microbiology
- Medical Sciences
- Neuroscience & Psychology
- Nursing & Health Care
- Pharmaceutical Sciences
Research Article - (2023) Volume 14, Issue 6
Mechanical properties of NdPrFeB based magnetoactive bisphenol-free Boron-silicate Polymers
Alexander Bartsch*, Daniela Beham, Jakob Gebhardt, Ingo Ehrlich, Thomas Schratzenstaller and Gareth J MonkmanReceived: 01-Nov-2023, Manuscript No. jnmnt-23-23821; Editor assigned: 06-Nov-2023, Pre QC No. jnmnt-23-23821(PQ); Reviewed: 20-Nov-2023, QC No. jnmnt-23-23821(QC); Revised: 23-Nov-2023, Manuscript No. jnmnt-23-23821(R); Published: 30-Nov-2023, DOI: 10.35248/2157-7439.23.14.705
Abstract
Following a ban on many materials containing bisphenol-A, new bisphenol-free Boron silicates have been found as substitutes. The purpose of this study is to describe the mechanical properties of these bisphenol-free magnetoactive borosilicate polymers containing hard magnetic particles. Samples of 0%, 33% and 66% by wt. were loaded for compression using a universal testing machine. The maximum forces occurring for different travel speeds were compared before and after post-magnetization treatments. The post-magnetization included 2 stages. In addition, the change in mechanical properties within 24 hours after the post-magnetization process was investigated. Furthermore, the influence of speed and particle content were investigated. In general, there is a correlation between the required compressive force and, the level of post-magnetization stress, the increase in travel speed and particle content in the boron silicate. Comparison of the non-post-magnetized and post-magnetized samples using two-tailed t-tests shows that the p-values for all weight fraction changes in NdPrFeB particles and travel speeds are less than 0.001. Also, a comparison between tests in which the traverse speed was varied also showed significant changes in the resulting compression forces. The same is valid for changes in the weight ratio of the NdPrFeB particles in the samples. For post-magnetized samples, no significant difference can be observed in the first 24 hours following magnetization. In summary, the material presents viscoelastic, plastic force-displacement behavior, which can be well recognized by its bi-linear curve shape. The investigation shows that borosilicate polymers based on NdPrFeB can have their mechanical behavior modified and controlled by post-magnetization processes. This opens new possibilities for many future applications.INTRODUCTION
The majority of smart materials are either elastic solids or viscous fluids activated by thermal, optical, electric or magnetic stimuli. Polymeric variants such as magnetoactive polymers (MAP) or electroactive polymers (EAP) are viscoelastic, and tend to relax to their original mechanical geometry on removal of the activation energy. However, certain new variations are in viscoelastic-plastic gell form. These include Magnetoactive Boron-silicate polymers (MBP). MBP differ from MAP in that the magnetic particles are free to move in the viscoelastic-plastic medium and are not restrained by an elastic matrix. Consequently electrical effects such as interfacial magneto-capacitance are considerably stronger in MBP than in MAP [1]. Furthermore, 3D shape memory phenomena effects are more pronounced [2], particularly where hard magnetic particles are included [3]. From a mechanical point of view, MBP demonstrates a shape memory effect which can be made to maintain a specific geometry for many hours when subjected to a homogeneous magnetic field [4]. New research has shown that with the inclusion of hard magnetic fillers, the shape memory effect can be maintained almost indefinitely and without an external magnetic field [3].
Boron-silicate polymer chemistry
The base material comprises Boron-silicate polymers which were a coincidental result of experiments intended to achieve artificial rubbers as a substitute for natural latex products during the second world war. The resulting compound was a highly compliant but simultaneously rheopectic (shear hardening) mass, which, having failed to achieve its intended objective, was later marketed for entertainment purposes under such names as “silly putty” or “bouncing putty”. Conventional Boron-silicate compounds contain small amounts of bisphenol-A, a compound used in the manufacture of many plastic products. For some time Bisphenol-A has been under suspicion of being toxic and withdrawn from domestic use. Consequently, these products must be substituted by Bisphenol free versions [5]. The Boron-Silicone-oxide compounds used for this work contain no Bisphenol-A and contain only 50 mg/kg Boron (up to 1200 mg/kg is permitted) [6].
Bisphenol compounds consist of two phenol rings each connected with a methylene group (R1= CH2) in the para position as in bisphenol-F as shown in Figure 1. By varying the residue, bisphenol-A (R2= C(CH3)2) or bisphenol-S (R3= SO2) are obtained. With an annual production quantity of 410000 tonne (2020), bisphenol-A is the most common product of this substance class [7-9].

Figure 1:Bisphenol structure showing: a) Bisphenol-F (Formaldeyd), b) Bisphenol-A (Aceton), c) Bisphenol-S.
Basic mechanical properties of mbp
Fei Guo and his research team have extensively characterized commercially available MBP (possibly containing Bisphenol-A) with various wt% CIP content [10]. Creep, relaxation, storage modulus have been investigated for a range of magnetic field strengths up to 156 kA/m and temperatures between 10°C and 60°C. For shape memory purposes, the creep characteristics are of most interest. Using such soft magnetic MBP, it is possible to produce a good shape memory effect with long-term imprint retention as long as the material is maintained in a homogeneous magnetic field [2]. Where post magnetized hard magnetic materials are used, imprint retention is indefinite and without the need for an external magnetic field [3]. In the case of soft magnetic content, resetting can be achieved physically or by applying an inhomogeneous magnetic field over a period of time whereas for hard magnetic content physical force is needed to overcome the permanent magnetic field.
The much longer shape memory lifetime achievable without the need for an external magnetic field should the soft magnetic CIP be replaced with hard magnetic (NdPrFeB) particles (Magnequench MQP-15-7). These may be pre or post-magnetized, though the former makes mixing more difficult. When doped with hard magnetic MBP this effect remains for several weeks, depending on the mixing ratio. A similar but lower resolution, effect can be observed with hydrophobic sand [11 ].
Fabrication of mbp-samples
Blends of BPA-free boron silicate polymer (Liquid Glass, Xiamen JinRan Trading Co., Ltd., Xiamen, China) with NdPrFeB particles (MQP-15-7-20065-070, Magnequench GmbH, Tuebingen, Germany) were prepared. The NdPrFeB particles have an average diameter of 250 μm with a standard deviation of 46 μm. The two components were mixed using a rolling mill. At least 20 passes were required until an acceptable degree of distribution homogeneity was achieved. This was experimentally verified on 5 wt% samples by X-ray tomography imaging using a μ-CT system (GE Phoenix v|tome|xs 240/180, General Electric, Boston, USA) at 65 kV, 195 μA, voxel size 3 μm. Opacity prevents X-ray analysis with higher fractions of NdPrFeB. Figure 2 shows the particle distributions after 2, 10 and 20 passes through the rolling mill. The homogeneity of the distribution increases with each pass (Figure 2).
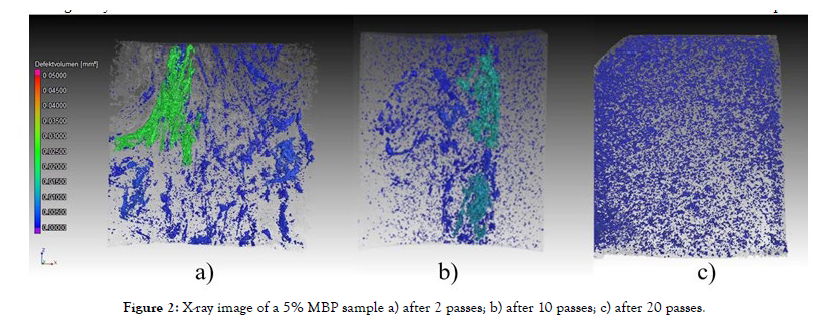
Figure 2:X-ray image of a 5% MBP sample a) after 2 passes; b) after 10 passes; c) after 20 passes.
Three sample mixtures were prepared for the subsequent experiments: pure boron silicate with 0 wt% NdPrFeB (BS0), boron silicate with 33 wt% NdPrFeB (BS33), and boron silicate with 66 wt% NdPrFeB (BS66). The final mixtures were moulded into cylinders with a height of 30 mm and a diameter of 15 mm. The described process is illustrated in Figure 3. For this purpose, the material was incorporated into additively manufactured shell elements. The material was then carefully pressed into the shell mold using a 15-mm punch. During this process, the height of the cylinder was visually checked using markings on the inside of the outer shell. A 0.08 mm thin PVC film was inserted between the shell elements and the test material. This film had proved its worth in preliminary tests, as it reliably prevented the magnetoactive bisphenol-free borosilicate polymer from adhering to the outer shells and could itself be easily removed from the cylindrical specimen. In addition, the film ensures a smooth surface of the cylindrical shell. For transport to the universal testing machine, the two outer shells were additionally secured against displacement with a rubber band. The specimens, including the outer shells, were then positioned in the testing machine. The diameters of the test geometries could be specified with an accuracy of ±0.5 mm for the specimens that had not been remagnetized. For the postmagnetized specimens, this value could be improved to an accuracy of ±0.3 mm. The height of the specimens was also accurate to ±0.5 mm (Figure 3).
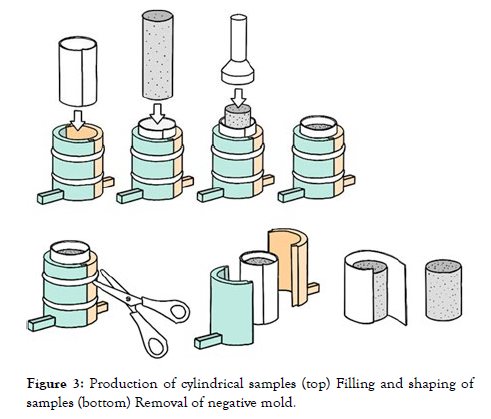
Figure 3:Production of cylindrical samples (top) Filling and shaping of samples (bottom) Removal of negative mold.
In order to determine a possible change in the mechanical properties of the samples due to a post-magnetization process, compression tests were performed on a universal testing machine (Zwick/ Roell Z250, ZwickRoell GmbH & Co. KG, Ulm, Germany). Magnetization was performed using a magnetizer (M-Pulse 2k2s, M-Pulse GmbH, Kierspe, Germany). The experiments were first performed without post-magnetization, then with light post-magnetization (800 Vat 4.8 kA) and finally with strong post-magnetization (1600 V at 9.4 kA). After each magnetization, the measurement was performed within 30 minutes. In addition, the tests were performed again 24 hours after (strong) re-magnetization. In addition, measurements were performed with borosilicate polymer samples without particle admixture for comparison.
EXPERIMENTAL SECTION
Before the first experiment, after the first experiment and after completion of the experimental group, the magnetic flux density was measured with a flux meter (LakeShore 455 DSP). For optimum comparability, the measuring hour was rotated around the center of the sample in 10 36° steps. The values measured in this way are arithmetically averaged. An experimental group consists of a total of 9 experiments, because the velocity was varied with the values 2.5 mm/s, 5 mm/s and 10 mm/s respectively and for each velocity 3 experiments were performed. Table 1 gives an overview of all the experiments performed. The temperature of the samples was maintained constant at 25°C. To illustrate the homogeneity of the magnetization of the sample, images are generated with a magnetic field camera (Table 1).
| Pos. | Sample designation | Magnet- iztion state |
Velocity | Pos. | Sample designation | Magnet- iztion state |
Velocity | Pos. | Sample designation | Magnet- iztion state |
Velocity |
|---|---|---|---|---|---|---|---|---|---|---|---|
| 1 | 2,5NMag33# | NMag1 | 2,5 mm/s | 1 | 2,5NMag66# | NMag1 | 2,5 mm/s | 1 | 2,5SP# | NMag1 | 2,5 mm/s |
| 2 | 5NMag33# | NMag | 5 mm/s | 2 | 5NMag66# | NMag | 5 mm/s | 2 | 5SP# | NMag | 5 mm/s |
| 3 | 10NMag33# | NMag | 10 mm/s | 3 | 10NMag66# | NMag | 10 mm/s | 3 | 10SP# | NMag | 10 mm/s |
| 4 | 2,5LMag33# | LMag2 | 2,5 mm/s | 4 | 2,5LMag66# | LMag2 | 2,5 mm/s | ||||
| 5 | 5LMag33# | LMag | 5 mm/s | 5 | 5LMag66# | LMag | 5 mm/s | ||||
| 6 | 10LMag33# | LMag | 10 mm/s | 6 | 10LMag66# | LMag | 10 mm/s | ||||
| 7 | 2,5SMag33# | SMag3 | 2,5 mm/s | 7 | 2,5SMag66# | SMag3 | 2,5 mm/s | ||||
| 8 | 5SMag33# | SMag | 5 mm/s | 8 | 5SMag66# | SMag | 5 mm/s | ||||
| 9 | 10SMag33# | SMag | 10 mm/s | 9 | 10SMag66# | SMag | 10 mm/s | ||||
| 10 | 2,524Mag33# | 24Mag4 | 2,5 mm/s | 10 | 2,524Mag66# | 24Mag4 | 2,5 mm/s | ||||
| 11 | 524Mag33# | 24Mag | 5 mm/s | 11 | 524Mag66# | 24Mag | 5 mm/s | ||||
| 12 | 1024Mag33# | 24Mag | 10 mm/s | 12 | 1024Mag66# | 24Mag | 10 mm/s | ||||
Table: 1 Overview of all compression tests; tests employing boron silicate with 33 wt.% NdPrFeB (left); tests employing boron silicate with 66 wt.% NdPrFeB (middle); Tests with 0 wt.% NdPrFeB (pure boron silicate) (right)
In the universal testing machine, the sample is placed centrally on a round test plate (diameter=100 mm). Above this, at a distance of 35 mm, is a second test plate (diameter=100 mm). The elastic bands, outer shells and foil, shown in Figure 2 are now quickly but carefully removed prior to commencement of the tests. The distance be-tween the two test plates is reduced from 35 mm to 20 mm at the desired speed. The plates then remain at a dis-tance of 20 mm for a few seconds before they move back to the starting position at 5 mm/s. Throughout this pro-cess, a number of data are recorded. These include the test time [s], the distance between the test plates [mm], the sample width using the video extensometer [mm] and the applied force [N] acting in the direction of travel of the crosshead. From these data, curves are generated to provide information concerning the mechanical behavior of the material.
The maximum force required to push the samples from a height of 30 mm to a height of 20 mm are compared. Undirected t-tests are used to evaluate the results for statistical significance. Here, the influence of post-magnetization as well as the velocity and the proportion of particles in the sample are examined separately.
RESULTS
The force-displacement curves show good reproducibility. The individual curves can be clearly assigned visually to the respective groups. The expected viscoelastic, plastic force-displacement behavior can be easily recognized from its bilinear curve shape. The elastic portion of the material characteristics can be recognized as a steeper rise from the beginning of the force-displacement curve. The curve reaches the maximum force value shortly before reaching the maximum compression displacement and then drops sharply until the maximum displacement is reached.
In general, there is a correlation between the required compression force and, the level of post-magnetization stress, the increase in feed rate and the particle content in the boron silicate.
Influence of post-magnetization on mechanical behavior
Figure 4 shows the influence of post-magnetization on the forcedisplacement curve using the 66 wt.% NdPrFeB sample as an example. In each case, the samples with the same hue represent the same travel speeds (green=10 mm/s; brown=5 mm/s; blue=2.5 mm/s), only the dark measurement curves were generated before the slight post-magnetization (800 V at 4.8 kA). Overall, the statistical comparisons via the undirected/two-sided t-tests show p-values for all 3 traversing speeds that are all smaller than 0.001. Thus, a highly significant result can be assumed (detailed values are shown in Table 2). If the sample is magnetized with a higher charging voltage (1600 V at 9.4 kA), the maximum force values increase somewhat further compared to the lightly magnetized sample. Accordingly, the respective p values related to the nonmagnetized samples are also in the highly significant range. The results regarding the correlation between the post-magnetization and the increase in maximum compression force are similar for the 33 wt.% NdPrFeB samples, although the significance level of the calculated T-tests is some-what lower than for the samples with 66 wt.% NdPrFeB content (Figure 4).
| Mean | Variance | Obser- vations | Hypothesi- zed Mean Difference | df | t Stat | P(T<=t) two- tail | t Critical two- tail | Sig. Level | |
|---|---|---|---|---|---|---|---|---|---|
| 2,5LMag66 | 4,43689434 | 0,00271706 | 3 | 0 | 2 | 55,0107173 | 0,00033029 | 4,30265273 | *** |
| 2,5NMag66 | 2,694414 | 2,06E-05 | 3 | ||||||
| 5LMag66 | 6,37584941 | 0,00020393 | 3 | 0 | 2 | 89,9554044 | 0,00012356 | 4,30265273 | *** |
| 5NMag66 | 4,18851615 | 0,00179308 | 3 | ||||||
| 10LMag66 | 8,73541439 | 0,00081908 | 3 | 0 | 2 | 38,1635117 | 0,00068589 | 4,30265273 | *** |
| 10NMag66 | 6,31653953 | 0,00659863 | 3 | ||||||
| 2,5NMag66 | 2,694414 | 2,06E-05 | 3 | 0 | 2 | 127,668643 | 6,13467E-05 | 4,30265273 | *** |
| 2,5SMag66 | 4,59683734 | 0,00064387 | 3 | ||||||
| 5NMag66 | 4,18851615 | 0,00179308 | 3 | 0 | 2 | 48,7006741 | 0,000421362 | 4,30265273 | *** |
| 5SMag66 | 6,62909971 | 0,00553626 | 3 | ||||||
| 10NMag66 | 6,31653953 | 0,00659863 | 3 | 0 | 2 | 70,4120635 | 0,000201639 | 4,30265273 | *** |
| 10SMag66 | 9,22633345 | 0,02328232 | 3 | ||||||
| 2,5LMag33 | 1,97648819 | 0,00077461 | 3 | 0 | 2 | 42,5195357 | 0,000552666 | 4,30265273 | *** |
| 2,5NMag33 | 1,59397659 | 0,00044338 | 3 | ||||||
| 5LMag33 | 3,10455148 | 0,00283294 | 3 | 0 | 2 | 7,25967157 | 0,018450806 | 4,30265273 | * |
| 5NMag33 | 2,68951013 | 0,00484150 | 3 | ||||||
| 10LMag33 | 4,78489320 | 0,00053692 | 3 | 0 | 2 | 15,3734551 | 0,004204471 | 4,30265273 | ** |
| 10NMag33 | 4,25511643 | 0,00134078 | 3 | ||||||
| 2,5NMag33 | 1,59397659 | 0,00044338 | 3 | 0 | 2 | 15,6174869 | 0,004074899 | 4,30265273 | ** |
| 2,5SMag33 | 2,04702875 | 0,00146452 | 3 | ||||||
| 5NMag33 | 2,68951013 | 0,00484150 | 3 | 0 | 2 | 10,6916338 | 0,008634917 | 4,30265273 | ** |
| 5SMag33 | 3,27461383 | 0,00203799 | 3 | ||||||
| 10NMag33 | 4,25511643 | 0,00134078 | 3 | 0 | 2 | 13,7874168 | 0,005219437 | 4,30265273 | ** |
| 10SMag33 | 4,96631789 | 0,00279199 | 3 |
Table 2: Test results and statistical evaluation of the post-magnetization
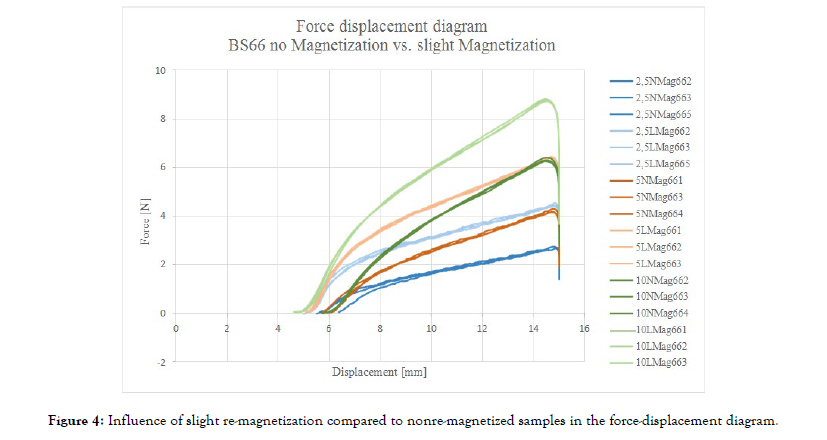
Figure 4:Influence of slight re-magnetization compared to nonre-magnetized samples in the force-displacement diagram.
In the direct comparison of the lightly and heavily remagnetized samples, the statistical test does not give a clear picture. Although all mean values of the maximum force values are higher for both the 33 % and 66 % NdPrFeB samples than for the lightly magnetized samples, the hypothesis H0 that there is no difference between the two groups cannot be rejected for 3 of the 6 groups, since the p-values are above the significance level of 0.05. The results of the statistical test are not conclusive (Table 2).
In the direct comparison of lightly and strongly magnetized samples, the statistical test does not provide a clear picture. Although all mean values of the measured maximum force values are higher for both the 33 % and 66 % NdPrFeB samples than for the lightly magnetized samples, the hypothesis H0, that there is no difference between the two groups, cannot be rejected for 3 of the 6 groups, since the p-values are above the significance level of 0.05. This situation is shown graphically in Figure 5. A detailed table with all statistical data was omitted for this block of results.
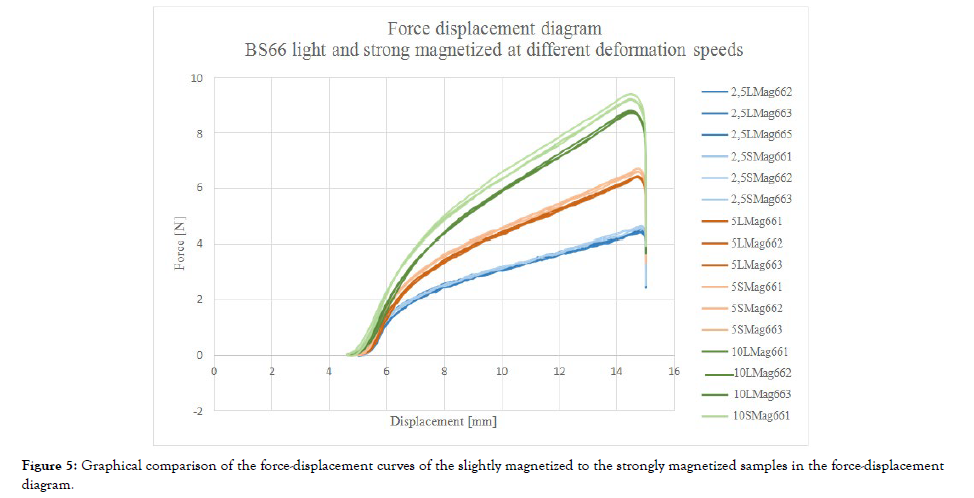
Figure 5: Graphical comparison of the force-displacement curves of the slightly magnetized to the strongly magnetized samples in the force-displacement diagram.
The comparison of the absolute force values after 24 hours again shows a clearer picture. For both material mix-tures (33 % and 66 % particle content), no significance of the measurement results can be detected. 5 of 6 mean values of the necessary absolute forces are minimally lower after 24 hours than directly after magnetization. 5 of 6 mean values lie in a range of less than 0.1 Newton deviation from the comparison mean value. Accordingly, the deviations in the corresponding force-displacement diagram for the 33 % NdPrFeB samples are very small (Figure 6).
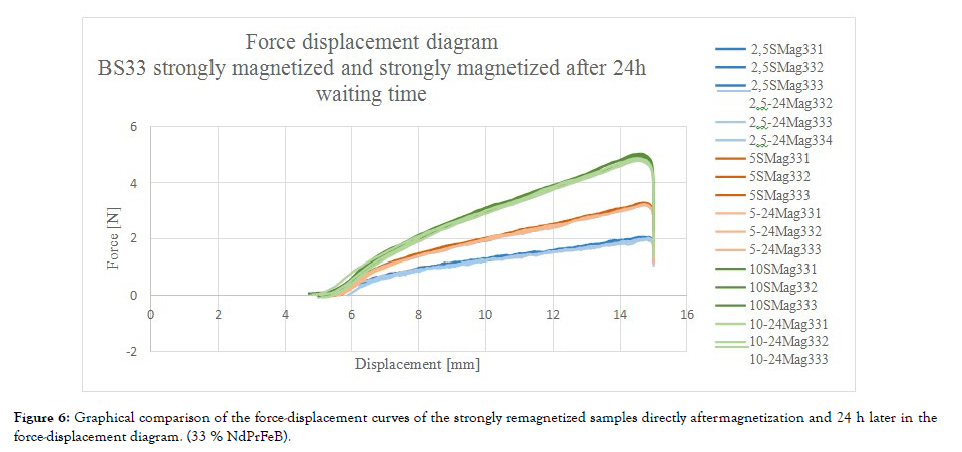
Figure 6:Graphical comparison of the force-displacement curves of the strongly remagnetized samples directly after magnetization and 24 h later in the force-displacement diagram. (33 % NdPrFeB).
The measured flux density is very low (in the μT range) without post-magnetization. After post-magnetization, the value increases significantly, but then decreases both in time and due to the deformation of the sample (Table 3).
| Composition (weight percentage) | Post magnetization voltage [V] | Magnetic flux density before post- magnetization [mT] |
Magnetic flux density directly after post- magnetization [mT] |
Magnetic flux density after one compression [mT] |
Magnetic flux density after nine compressions [mT] |
Magnetic flux density after nine compressions [mT] + 24 h |
Magnetic flux density after eighteen compressions [mT] + 24 h |
|---|---|---|---|---|---|---|---|
| LMag 33% Gw | 800 | 3,4 *10-3 | 2,9 | 1,7 | 0,7 | - | - |
| SMag 33% Gw | 1600 | - | 11,0 | 2,1 | 1,0 | 0,8 | 0,4 |
| LMag 66% Gw | 800 | 0,1 | 12,0 | 3,6 | 2,8 | - | - |
| SMag 66% Gw | 1600 | - | 18,0 | 4 | 1,7 | 1,4 | 1,5 |
Table 3: Results of the flux density measurements.
Influence of the particle content on the mechanical behavior
The results clearly show the change in mechanical properties caused by the addition of NdPrFeB particles. Already the addition of 33% NdPrFeB particles without post-magnetization leads to a significant increase of the compression force at all investigated travel speeds. If the mixing ratio is increased to 66%, the significance level rises to p-values of less than 0.001 for all speeds investigated. Compared to the pure borosilicate, the compression force for the 66% NdPrFeB sample increases on average by more than 100% at slow travel speeds (2.5 mm/s). For the 33% sample, it is only 19%. At higher traversing speeds, this multiplication factor decreases from pure borosilicate to the 66% mixture (at 5 mm/s it is still 85% and at 10 mm/s 75% more traversing force than with the pure borosilicate). With the 33% mixture, the multiplication factor remains approximately the same over the entire velocity range (5 mm/s=19%; 10 mm/s 18%). The corresponding force curves are shown in Figures 7 and 8 and the detailed data presented in Table 4.
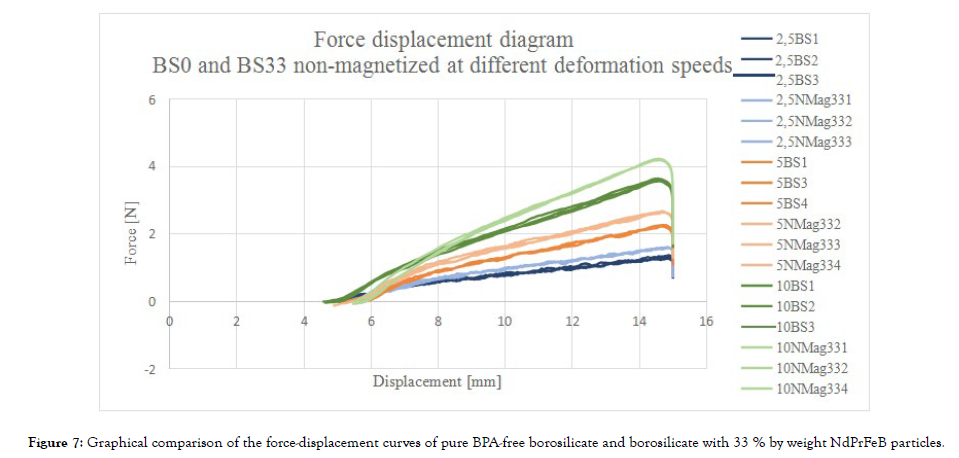
Figure 7:Graphical comparison of the force-displacement curves of pure BPA-free borosilicate and borosilicate with 33 % by weight NdPrFeB particles.
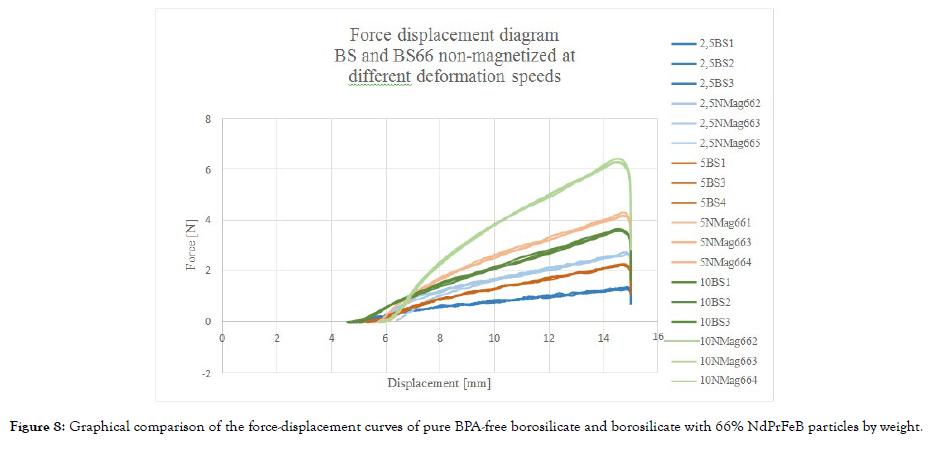
Figure 8: Graphical comparison of the force-displacement curves of pure BPA-free borosilicate and borosilicate with 66% NdPrFeB particles by weight.
| Mean | Variance | Obser- vations | Hypothesi- zed Mean Difference |
df | t Stat | P(T<=t) two- tail | t Critical two- tail | ||
|---|---|---|---|---|---|---|---|---|---|
| 2,5NMag33 | 1,59397659 | 0,00044338 | 3 | 0 | 2 | 7,47256888 | 0,017441388 | 4,30265273 | * |
| 2,5BS | 1,32902944 | 0,00171825 | 3 | ||||||
| 5NMag33 | 2,68951013 | 0,00484150 | 3 | 0 | 2 | 17,1090750 | 0,003398822 | 4,30265273 | ** |
| 5BS | 2,25900453 | 0,00081104 | 3 | ||||||
| 10NMag33 | 4,25511643 | 0,00134078 | 3 | 0 | 2 | 47,6773359 | 0,000439632 | 4,30265273 | *** |
| 10BS | 3,60141680 | 0,00017528 | 3 | ||||||
| 2,5NMag66 | 2,694414 | 2,06E-05 | 3 | 0 | 2 | 52,0646114 | 0,000368701 | 4,30265273 | *** |
| 2,5BS | 1,32902944 | 0,00171825 | 3 | ||||||
| 5NMag66 | 4,18851615 | 0,00179308 | 3 | 0 | 2 | 229,728032 | 1,89478E-05 | 4,30265273 | *** |
| 5BS | 2,25900453 | 0,00081104 | 3 | ||||||
| 10NMag66 | 6,31653953 | 0,00659863 | 3 | 0 | 2 | 56,0419285 | 0,000318249 | 4,30265273 | *** |
| 10BS | 3,60141680 | 0,00017528 | 3 |
Table 4:Extract of the test results and the statistical evaluation on the influence of the sample composition
When comparing from the 33% sample to the 66% sample, it should be noticed that the sample with higher NdFePrB content has higher compression forces. The compression force is 68% higher without post-magnetization at 2.5 mm/s. This multiplier decreases to 48% up to 10 mm/s. This picture is reinforced by the strong post-magnetization of both samples. Thus, at 2.5 mm/s, the average compression force of the 66% sample is 125% more than the 33% sample. Up to the speed of 10 mm/s, this value decreases to 85%. When comparing the two samples, p-values of less than 0.001 are calculated for all tests. The comparative force-displacement curves for this situation are shown in Figures 9 and 10.
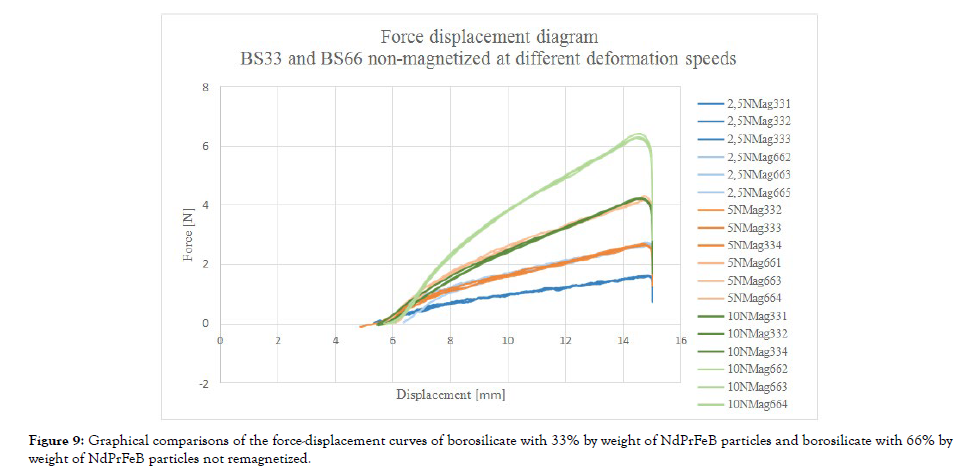
Figure 9:Graphical comparisons of the force-displacement curves of borosilicate with 33% by weight of NdPrFeB particles and borosilicate with 66% by weight of NdPrFeB particles not remagnetized.
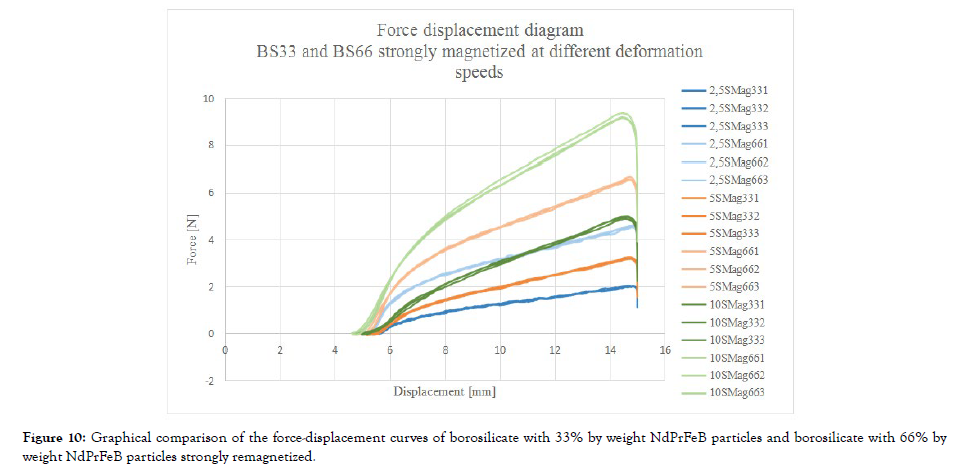
Figure 10:Graphical comparison of the force-displacement curves of borosilicate with 33% by weight NdPrFeB particles and borosilicate with 66% by weight NdPrFeB particles strongly remagnetized.
Influence of the traversing speed on the mechanical behavior The tests showed that the required deformation force is strongly dependent on the compression speed. For both pure borosilicate (Figure 11) and 66 wt% blends (Figure 12), all measurements show statistically significant differences in the change of compression speed and the resulting compression force, Pure borosilicate shows a higher sensitivity to the change of compression speed with respect to the deformation force than borosilicate with NdPrFeB particles.
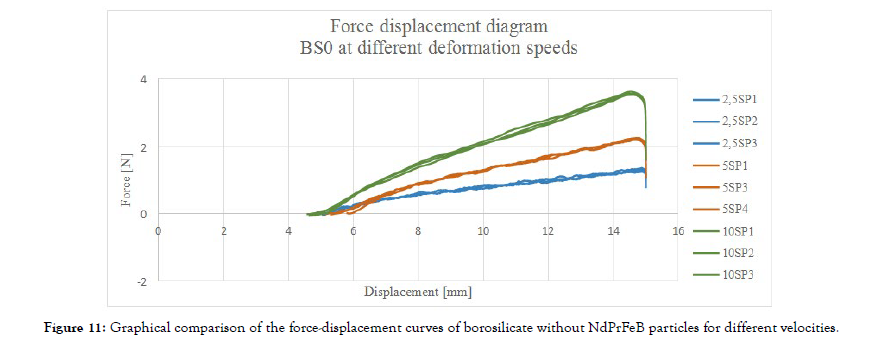
Figure 11:Graphical comparison of the force-displacement curves of borosilicate without NdPrFeB particles for different velocities.
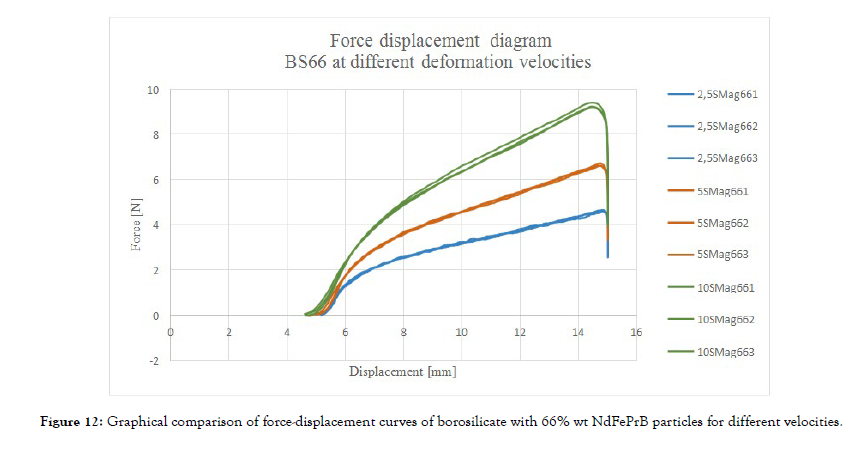
Figure 12:Graphical comparison of force-displacement curves of borosilicate with 66% wt NdFePrB particles for different velocities.
Increasing the travel speed from 2.5 mm/s to 10 mm/s resulted in a 171% increase in compressive force for the pure borosilicate, whereas the value for the 66% blend increased by only 100% for the same change in initial size. Furthermore, for all 3 calculations (2.5 mm/s vs. 5 mm/s; 5 mm/s vs. 10 mm/s; 2.5 mm/s vs. 10 mm/s), the p-value for the pure borosilicate was less than 0.001 whereas the p-value for the 66% blend reached this level of significance for the same relative or absolute change in only 2 of 3 tests. Detailed values are shown in Table 5.
| Mean | Variance | Obser- vations | Hypothesi- zed Mean Difference |
df | t Stat | P(T<=t) two- tail | t Critical two- tail | Sig. Level | |
|---|---|---|---|---|---|---|---|---|---|
| 5BS | 2,25900453 | 0,00081104 | 3 | 0 | 2 | 115,153423 | 7,54045E-05 | 4,30265273 | *** |
| 2,5BS | 1,32902944 | 0,00171825 | 3 | ||||||
| 10BS | 3,60141680 | 0,00017528 | 3 | 0 | 2 | 67,5718687 | 0,00021894 | 4,30265273 | *** |
| 5BS | 2,25900453 | 0,00081104 | 3 | ||||||
| 10BS | 3,60141680 | 0,00017528 | 3 | 0 | 2 | 81,3861343 | 0,000150939 | 4,30265273 | *** |
| 2,5BS | 1,32902944 | 0,00171825 | 3 | ||||||
| 5SMag66 | 6,62909971 | 0,00553626 | 3 | 0 | 2 | 35,4481703 | 0,00079486 | 4,30265273 | *** |
| 2,5SMag66 | 4,59683734 | 0,00064387 | 3 | ||||||
| 10SMag66 | 9,22633345 | 0,02328232 | 3 | 0 | 2 | 26,8391541 | 0,001385349 | 4,30265273 | ** |
| 5SMag66 | 6,62909971 | 0,00553626 | 3 | ||||||
| 10SMag66 | 9,22633345 | 0,02328232 | 3 | 0 | 2 | 53,5348100 | 0,000348739 | 4,30265273 | *** |
| 2,5SMag66 | 4,59683734 | 0,00064387 | 3 |
Table 5: Extract of the test results and the statistical evaluation on the influence of the velocity.
Homogeneity and magnetic field structure after postmagnetization
The magnetic field camera shows a good homogenization of the samples. Local differences can be explained by small particle clouds. All in all, however, the good homogeneity of the particle distribution is maintained even during post-magnetization. An image of the post-magnetized samples taken with a magnetic field camera (Metesy MagCam) is shown in Figure 13.
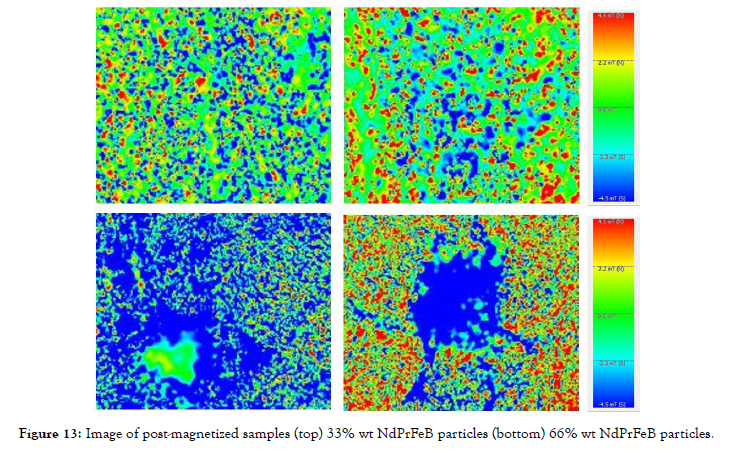
Figure 13:Image of post-magnetized samples (top) 33% wt NdPrFeB particles (bottom) 66% wt NdPrFeB particles.
DISCUSSION
Overall, the t-tests indicate statistically significant changes in stiffness due to post-magnetization. This is true for both the 66% and 33% mixtures. Specifically, both the changes between zero and light post-magnetization and between light and heavy postmagnetization are statistically significant. In the second case, the effect is weaker, but the phenomenon is still noteworthy since only 3 tests were performed with identical parameters. The behavior is in line with expectations, as the hard magnetic properties of NdPrFeB have already been described in the literature. It can be assumed that post-magnetization causes the NdPrFeB particles to form magnetic grid structures, which leads to an increase in the force required for compression. The small relative increase of the maximum force with a doubling of the post-magnetization suggests that the saturation deficit itself decreases exponentially. However, this is a relatively small sample that should be interpreted with care. The deformation-induced decrease in flux density could be related to the fact that the particles aligned in the magnetizer become physically reorientated during deformation. Interestingly, the force-displacement curves remain nearly congruent in the 2nd and 3rd experiments. This means that the externally measurable flux density decreases, but the mechanical properties do not change. Even after 24 hours, there is only a minimal reduction in the maximum deformation forces, which is not statistically significant. That the measurement data obtained 24 hours after magnetization indicate no significant difference in mechanical properties is to be expected over a short period of time (days). This is because the magnetization of the hard magnetic particles is almost unlimited in time [3]. The data on the changes in the force-strain curve due to the addition of NdPrFeB particles can be explained in terms of the fact that there is friction between the particles, which increases as the weight fraction increases. A relative increase in the required compression force due to post-magnetization for samples with higher particle content in relation to the increase in compression force for samples with low particle content is probably due to the fact that the magnetic effects increase with increasing particle content. The influence of the compression speed on the mechanical system response or the required compression force fits well with known properties of borosilicates and can be explained by the inherent rheopexy of the material. The fact that this decreases with samples containing particles also fits well into the known picture. The influence of the base material on the system response decreases, since the material already becomes stiffer due to particulate addition, independent of post-magnetization.
CONCLUSIONS
In summary, the material exhibits viscoelastic-plastic forcedisplacement behavior, which is readily apparent from its bi-linear curve shape. The study shows that the mechanical behaviour of borosilicate polymers based on NdPrFeB can be modified and controlled by the post-magnetization processes. The following findings are particularly relevant:
- Post-magnetization increases the strength of the material.
- Post-magnetization appears to lead to saturation and cannot be increased proportionally.
- The property changes due to post-magnetization persist over time.
This opens up new possibilities for many future applications, however, further investigation is needed to support and extend the findings from this study.
ACKNOWLEDGEMENT
The authors thank the German Research Foundation (DFG) for the grant (MO 2196/11-1) "Magneto-rheopectic boron-organosilica (MrBos)", which made this research possible.
REFERENCES
- Monkman G J, Striegl B, Prem N, Sindersberger D. Electrical properties of magnetoactive Boron-organo-silicon-oxide polymers. Macromolecular Chemistry and Physics. 2020; 221(15): 1900342.
- Prem N, Sindersberger D, Striegl B, Böhm V, Monkman G J. Shape memory effects using magnetoactive Bororgano- silicon oxide polymers. Macromolecular Chemistry and Physics. 2o2o; 221: 2000149.
- Monkman G J, Schirmer M, Putz C , Sattler R . Bor-basierte magnetoaktive Polymere - das neue intelligente Material - Actuator'22 Konferenz. Mannheim. 2022; 29(30).
- Schrimer M, Putz C, Monkman G J, Ed Mcconnell, L. Boron: Advances in Research and Applications. Nova Science Publications. 2021; 117(179):16.
- Koltzenburg S, Maskos M, Nuyken O, Mülhaupt R. Polymere: Synthese, Eigenschaften und Anwendungen. Springer. 2013.
- Bund für Umwelt und Naturschutz Deutschland eV, Vereinsregister: Berlin VR 21148Nz.
- Tieke B. Makromolekulare Chemie: Eine Einführung. Wiley-VCH, 3. 2014; 16.
- Gassman N R. Bisphenol A: Ein multimodaler endokriner Disruptor. Königliche Gesellschaft für Chemie. 2022.
- Fei Guo, Du C, Yu G, Li R. The Static and Dynamic Mechanical Properties of Magnetorheological Silly Putty. Advances in Materials Science and Engineering. 2016.
- Kinetischer Sand. Status der Marke Anmeldungsnummer 1198085 Eintragungsdatum. 2014.
Indexed at, Google Scholar, Crossref
Indexed at, Google Scholar, Crossref
Indexed at, Google Scholar, Crossref
Indexed at, Google Scholar, Crossref
Indexed at, Google Scholar, Crossref
Citation: Bartsch A, Beham D, Gebhardt J, Ehrlich I, Schratzenstaller T, et al. (2023) Mechanical Properties of NdPrFeB Based Magnetoactive Bisphenol- Free Boron-Silicate Polymers. J Nanomed Nanotech. 14: 705.
Copyright: ©2023 Bartsch A, et al. This is an open-access article distributed under the terms of the Creative Commons Attribution License, which permits unrestricted use, distribution, and reproduction in any medium, provided the original author and source are credited.
