Indexed In
- Euro Pub
- Google Scholar
Useful Links
Share This Page
Journal Flyer
Open Access Journals
- Agri and Aquaculture
- Biochemistry
- Bioinformatics & Systems Biology
- Business & Management
- Chemistry
- Clinical Sciences
- Engineering
- Food & Nutrition
- General Science
- Genetics & Molecular Biology
- Immunology & Microbiology
- Medical Sciences
- Neuroscience & Psychology
- Nursing & Health Care
- Pharmaceutical Sciences
Research Article - (2023) Volume 12, Issue 4
Impact of the Consumption of Three Food Plants in the Department of Man on the Body Mass Index and High Blood Pressure
Kone Mohamed Ba1,2*, Koffi Affoue Carole1,2, Gbakayoro Brice2 and Brou Kouakou22Department of Food Sciences and Technologies, Nangui Abrogoua University, Cote d'Ivoire, West Africa
Received: 03-Jan-2023, Manuscript No. GJBAHS-23-19508; Editor assigned: 06-Jan-2023, Pre QC No. GJBAHS-23-19508 (PQ); Reviewed: 20-Jan-2023, QC No. GJBAHS-23-19508; Revised: 03-Mar-2023, Manuscript No. GJBAHS-23-19508 (R); Published: 10-Mar-2023, DOI: 10.35248/2319-5584.23.12:189
Abstract
The main objective of this study is to determine the impact of the consumption of three food plants on the body mass index and high blood pressure. The descriptive cross-sectional survey was carried out for this work between February 2022 and April 2022 in three urban areas (Doyagouine, Campus and Gbepleu) and four rural areas (Kassiapleu, Biakale, Kuitongouine and Petit Gbepleu). It focused on the frequency of consumption of three food plants, Guile (Sesamum radiatum), Sran (Beilschmiedia mannii ), Zanhan (Byttneria catalpifolia ) and the assessment of anthropometric parameters (body mass, height and blood pressure). Then, a correlation between the anthropometric parameters and the frequency of consumption of these three food plants has been established. The results showed that factors such as age, place of residence have an influence on the prevalence of high blood pressure and obesity. The age groups most favorable to the development of high blood pressure is 40-60 years and 60-85 years and 40-60 years for obesity. High blood pressure and obesity are also most prevalent in urban environment. The correlations showed that more the subjects surveyed consumed the three food plants studied the less they were exposed to hypertension and obesity.
Keywords
Food plants; Guile (Sesamum radiatum); Sran (Beilschmiedia mannii ); Zanhan (Byttneria catalpifolia); Tonkpi; BMI; Arterial hypertension
Introduction
The burden of chronic diseases is increasing rapidly, making them the leading cause of mortality and morbidity worldwide today. Nearly half of all deaths from chronic disease are attributable to cardiovascular disease [1]. The epidemic of chronic diseases is growing every year around the world. In 2008, chronic diseases were responsible for 63% of deaths, i.e., 3%more than in 2001. Thus, they are the first cause of death in the world. According to WHO projections, by 2030 chronic diseases will be responsible for almost three-quarters of all deaths worldwide. Developing countries will concentrate 60% of the global burden of chronic disease [2]. In Cote d'Ivoire, cardiovascular diseases are a public health problem with a mortality rate of 11%. Strategies to combat noncommunicable diseases are based on identifying and reducing the level of exposure of populations to risk factors. It is therefore essential to promote interventions aimed at reducing the main modifiable common risk factors for noncommunicable diseases, in particular high blood pressure and morbid obesity [3]. If several factors seem to be decisive in the occurrence of these diseases, diet undeniably plays a major role [4]. On this point, several studies have shown that the paleolithic food model close to the traditional African diet contributed to maintaining an optimal BMI as well as to the prevention of many metabolic diseases [5]. This diet is centered on the consumption of protein from hunting and vegetable substance from gathering [6]. Among these plant substances, some have nutritional and therapeutic virtues of primary importance [7]. While it is true that several studies have looked at the correlation between the consumption of food plants and the prevalence of metabolic diseases in Cote d'Ivoire, the fact remains that very few have been interested in the food plants of the Tonkpi region. In this context, it seemed necessary to us to carry out this study in the city of man, capital of the Tonkpi region, and the villages located on its outskirts.
The main objective of this study is to determine the impact of the consumption of three food plants in the department of man on the body mass index and high blood pressure. Specifically it will be:
• Conduct a consumption frequency survey on three food plants, Guile (Sesamum radiatum), Sran (Beilschmiedia mannii ), Zanhan (Byttneria catalpifolia ).
• Measure anthropometric parameters namely, body mass, height and blood pressure.
• Establish a correlation between the anthropometric parameters and the frequency of consumption of these three food plants.
Materials and Methods
Study site
Located 600 km from Abidjan, the Tonkpi region has the regional capital of the city of man, also capital of the district of the mountains. Surrounded by mountains, man is called “city of 18 mountains”. It is a city of 4140.7 km2 with an estimated population of 188,704 inhabitants, according to the general census of population and housing of 2014. It is made up of several neighborhoods and peripheral villages. For this study, seven localities were chosen, three of which are in urban areas (Doyagouine, Campus and Gbepleu) and the other in rural areas (Kassiapleu, Biakale, Kouitongouine and Petit Gbepleu).
Technical material
The technical equipment consists of a PHARO® 200 kg electronic scale (Figure 1), a SECA 213 mobile height rod (Figure 2) and an ORON electronic upper arm blood pressure monitor (Figure 3).
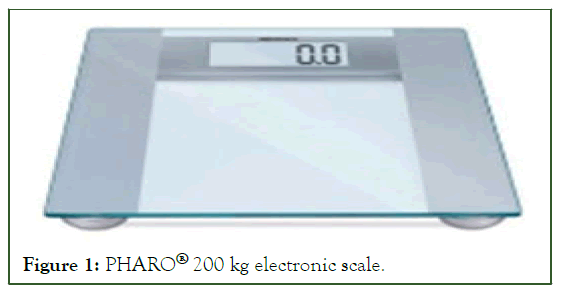
Figure 1: PHARO® 200 kg electronic scale.
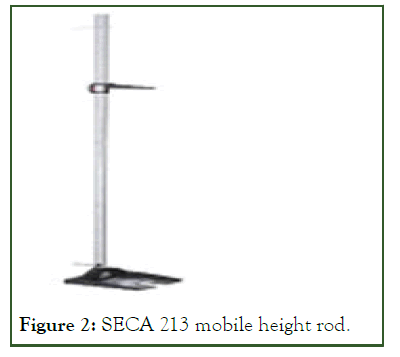
Figure 2: SECA 213 mobile height rod.
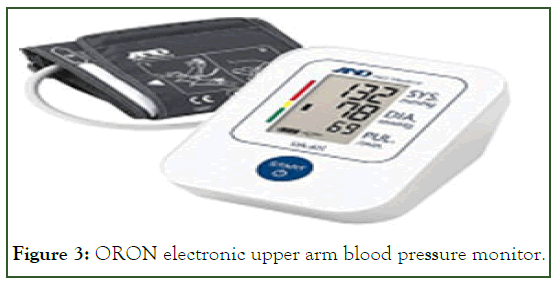
Figure 3: ORON electronic upper arm blood pressure monitor.
Procedure and study population
The descriptive cross-sectional survey was carried out for this work between February 2022 and April 2022 in three urban areas (Doyagouine, Campus and Gbepleu) and four rural areas (Kassiapleu, Biakale, Kuitongouine and Petit Gbepleu). This type of survey was chosen because it was carried out on part of the population.
The work itself was characterized by a survey of the consumption of seeds of Beilschmiedia mannii called in local language Sran, of Sesamum radiatum called in the local language Guile and of Byttneria catalpifolia called in the local language Zanhan and the taking of anthropometric parameters. The study was conducted in an adult population.
We interviewed 400 households distributed in each district of the city and the peripheral villages according to the number of households including 60 in Doyagouine, 60 in Campus, 60 in Gbepleu, 55 in Kassiapleu, 55 in Biakale, 55 in Kuitongouine and 55 in Petit Gbepleu.
The objective and content of the work were clearly explained to the inhabitants of the households in French and in Yacouba (local language). We have also assured them that the information collected will remain anonymous and confidential and will be used for purely scientific purposes. With their agreement, one person per household was submitted to the questionnaires and then their anthropometric parameters were taken.
The main inclusion criteria: Included in the study are all adults of both gender residing in the neighborhoods and villages chosen at the time of the survey and agreeing to take part in the questionnaires.
The main exclusion criteria: Excluded from this study are people residing in institutions, in a religious community or incarcerated (due to less freedom in the choice of food), as well as people who cannot be reached due to a physical or mental disability. Also people who refused to take the quizzes.Excluded from this study are people residing in institutions, in a religious community or incarcerated (due to less freedom in the choice of food), as well as people who cannot be reached due to a physical or mental disability. Also people who refused to take the quizzes.
Sociodemographic variables
The socio-demographic variables considered in this study are: Age, gender and place of residence.
In terms of age, we have worked on an adult population classified into three age groups established by the WHO:
• Section 1: 18-35 years old.
• Section 2: 35-60 years old.
• Section 3: 60-60+ years old.
• Gender: Both gender were surveyed (male and female).
Place of residence: Three districts in urban areas (Doyagouine, Campus and Gbepleu) and four in rural areas (Kassiapleu, Biakale, Kuitongouine and Petit Gbepleu). These districts of the urban environment were chosen because many inhabited by the yacouba the first consumers of Zanhan, Guile and Sran, so we find various social classes.
Measurements of anthropometric parameters
Anthropometric measurements: Are the most common methods for assessing nutritional status. They use standardized techniques. In order to describe the corpulence of the subjects, to appreciate their nutritional state and finally to see their blood pressure status, we measured the weight (kg), the height and proceeded to a blood pressure measurement.
Weight: For a precise measurement, the weighing are carried out using an electronic scale (PHARO® 200 kg). The weight is evaluated with the subject barefoot. In surveys epidemiology, the subject stands on the scale in an upright position, immobile, and the value is directly noted on the display screen of the scale by the interviewer. It is recorded in Kg.
Size: The measurement of the height is done using a fixed wall height chart in a dedicated room, when all the measurements are done in the same place. In other circumstances such as ours, where the measurement is carried out in different places, the use of removable measuring rods or portable is preferred. For removable height boards, it is necessary to ensure that they are placed against a straight wall, vertically, with the “0” at ground level. Height charts portable, are placed on level ground. You need a measuring rod with a horizontal slider mobile that can come and touch the top of the head. The person to be measured is standing barefoot, heels together, legs straight, arms swinging and shoulders relaxed. The back of his head, shoulder blades, buttocks, calves and heels should all touch the measuring rod or the wall on which it is fixed. Make sure the person being measured is looking straight in front. The interviewer lowers the per pendicular headrest so that it touches the top of the head by compressing the hair. The interviewer's eyes should be parallel to the headrest (Figure 4).
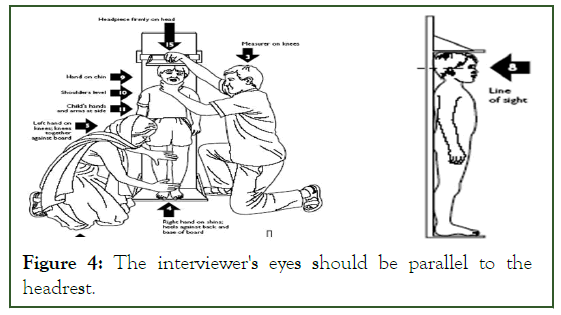
Figure 4: The interviewer's eyes should be parallel to the headrest.
Blood pressure
The blood pressure was taken by: Ambulatory Blood Pressure Measurement (ABPM): It allows the recording of blood pressure figures over a day. Once in contact with the subject, put it to rest for 15 minutes before taking anything.
Once the rest time has passed, the catch will be done using a device called a blood pressure monitor. The tensiometer used here is electric. Blood pressure will be taken on the right arm and the left arm. The blood pressure monitor consists of two (2) parts, the main body and the cuff, suitable for measuring blood pressure and pulse in humans. For the socket, first connect the wire connecting the main body and the cuff then place the cuff on the subject's arm, finally turn on the machine and wait for the result obtained after about 60 seconds. Remove the cuff once the result is obtained. The voltage measurement was done only once.
Determination of BMI in adults
Based on weight and height, the most widely used method recommended by the WHO is that of calculating the Body Mass Index (BMI) or Quetelet index, which is calculated according to the following formula: BMI=P/T2 (with P: Weight in kilograms and T: Height in meter [8]. The result is expressed in kg/m2. The WHO offers a detailed classification based on BMI values valid for both men and women. The weight and height data allowed us to classify the subjects into three groups according to the WHO classification:
• The first group includes thin subjects: BMI<18.5 kg/m2.
• The second group includes normal weight subjects: 18.5 kg/m2 ≤ BMI ≤ 25 kg/m2.
• The third group includes overweight and obese subjects: BMI>25 Kg/m2.
Frequency of consumption of seeds of Beilschmiedia mannii (Sran), Sesamum radiatum (Guile) and Byttneria catalpifolia (Zanhan)
The determination of the frequency is done with a question set. It is a question of knowing if the three plants (Zanhan, Guile and Sran) are consumed and how many times they are in the week (over 7 days). The results obtained are multiplied by four (4) in order to find a value per month.
Statistical analysis
The data was entered into tables of a specially designed access database according to the nature of the data before being transformed into excel files. The excel file containing the anthropometric data has been transformed into an EPI INFO file (version 6.04d) to allow the calculation of the body mass index using the epinut module of this software. All data was then collected and analyzed using stat view software, version 3.1. The levels of significance of the effects of the various sociodemographic factors on the anthropometric characteristics and the body mass index of the subjects surveyed were studied. When a factor had more than two levels or modalities, the corresponding results are compared two by two using the Chisquare test to determine which of them show a significant difference.
Results and Discussion
Results
Prevalence of arterial hypertension according to sociodemographic characteristics Overall prevalence of high blood pressure. The results in Figure 5 show that more than half of the adult population surveyed has normal blood pressure (69.5%) while 23.7% are declared hypertensive. The 6.8% others remaining declared hypotensive.
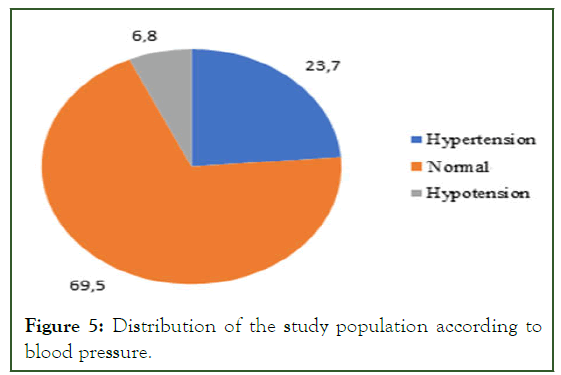
Figure 5: Distribution of the study population according to blood pressure.
Prevalence of high blood pressure by age
Histograms of the prevalence of arterial hypertension according to age Figure 6 show that the population over 40 is more vulnerable to hypertension with a rate of more than 45.5% of hypertensives against 5.7% of the remaining population (under 40 years old).
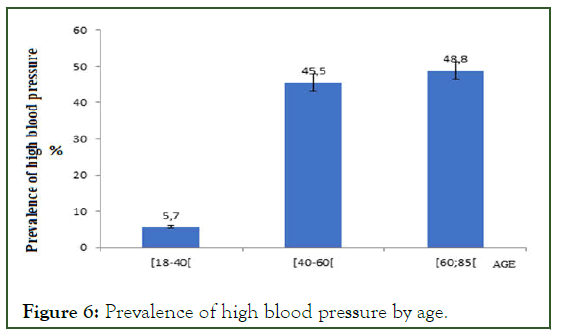
Figure 6: Prevalence of high blood pressure by age.
Prevalence of high blood pressure by place of residence (Figure 7) presents the prevalence of hypertension according to place of residence. It appears that 13.33% of the population living in rural areas is hypertensive, so more than half (86.67%) residing in urban areas is declared hypertensive.
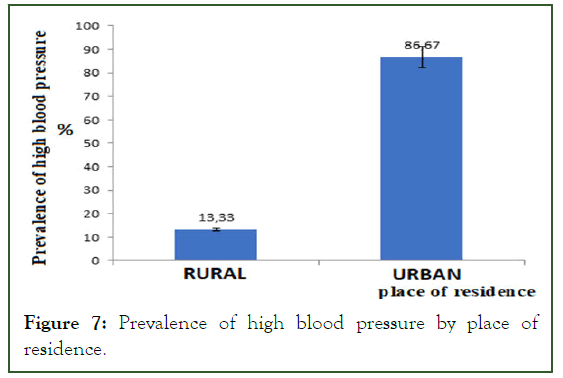
Figure 7: Prevalence of high blood pressure by place of residence.
Prevalence of obesity and overweight according to sociodemographic characteristics overall prevalence of obesity and overweight
The distribution of the study population according to obesity and overweight (Figure 8), it shows that more than half of the population (71.9%) have a normal BMI. On the other hand 22.6% of this population are underweight (thin) and the remaining 5.4% are underweight. Overweight or obese.
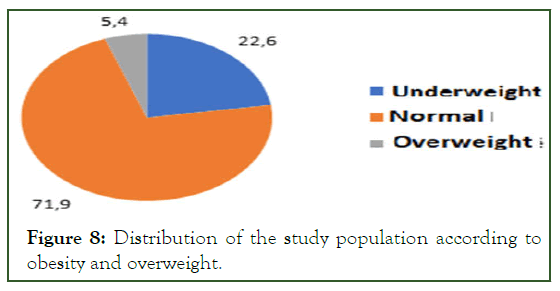
Figure 8: Distribution of the study population according to obesity and overweight.
Prevalence of obesity and overweight according to age
The results of the BMI analysis aimed at highlighting the prevalence of obesity and of overweight according to age are presented through the histograms in Figure 9. On of the entire adult population survey 62.8% are obese or overweight. These 62.8% are of the 40-60 years, unlike the over 60's who occupy 9.7% and 27.5% remaining are younger 18-40 years [9].
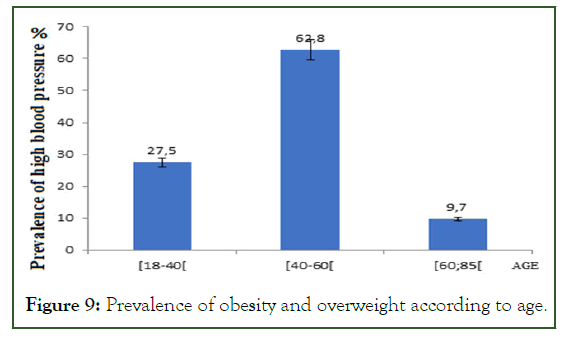
Figure 9: Prevalence of obesity and overweight according to age.
Prevalence of obesity and overweight according to place of residence
In the population surveyed, the 84.37% obese or overweight are in urban area while that 15.63% are found in rural areas. This result is presented on the histogram of the (Figure 10).
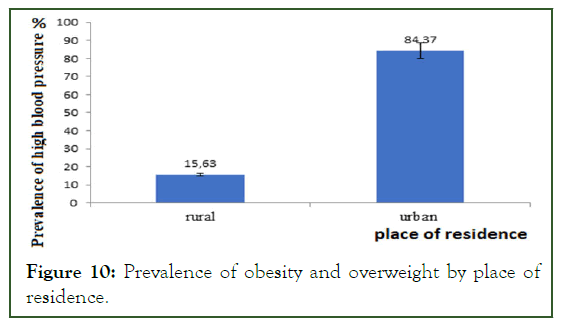
Figure 10: Prevalence of obesity and overweight by place of residence.
Study of the correlation between the prevalence of arterial hypertension and the frequency of Sran consumption
Figure 11 presents the relationship between the consumption of Zanhan and the prevalence of hypertension. The results show that regular users of Zanhan have a prevalence of lower hypertension [10]. This results in a strong negative correlation which is R2=0.9645.
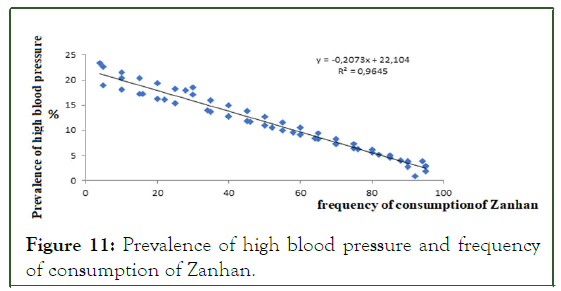
Figure 11: Prevalence of high blood pressure and frequency of consumption of Zanhan.
The relationship between the prevalence of arterial hypertension and the frequency of consumption of Sran is presented in Figure 12. The results show that the less the consumption of the Sran is higher the greater the prevalence of hypertension. Furthermore, we observe that the correlation is strong with R2=0.8276
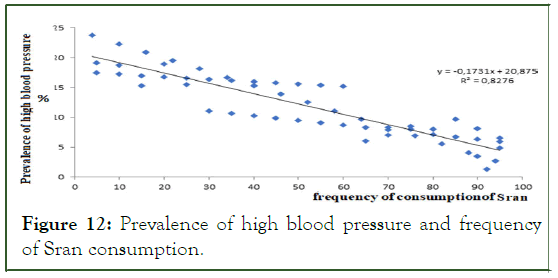
Figure 12: Prevalence of high blood pressure and frequency of Sran consumption.
Study of the correlation between the prevalence of arterial hypertension and the frequency of consumption of Guile
The results in Figure 13 show a high correlation (R2=0.8122) between the prevalence of arterial hypertension and the frequency of consumption of Guile. The results show also that the prevalence of hypertension is inversely proportional to the consumption of Guile.
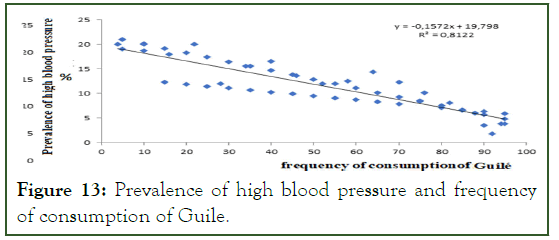
Figure 13: Prevalence of high blood pressure and frequency of consumption of Guile.
Study of the correlation between the prevalence of obesity, overweight and the frequency of consumption of three food plants, Guile (Sesamum radiatum), Sran (Beilschmiedia mannii) and Zanhan (Byttneria catalpifolia)
The results in Figure 14 show a strong correlation (R2=0.8515) between prevalence of obesity, overweight and the frequency of consumption of Zanhan. In addition the prevalence of obesity, overweight and the frequency of consumption of Zanhan evolve inversely; more the consumption of Zanhan is frequent unless you have hypertensive.
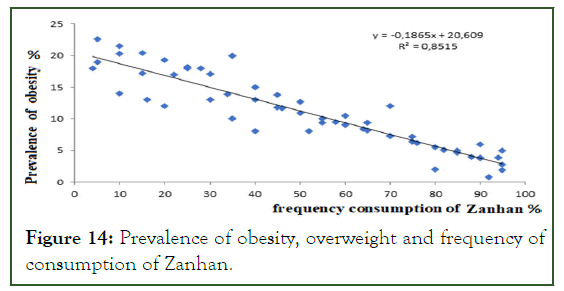
Figure 14: Prevalence of obesity, overweight and frequency of consumption of Zanhan.
Study of the correlation between the prevalence of obesity, overweight and the frequency of Sran consumption
Figure 15 presents the relationship between the consumption of Sran and the prevalence of obesity, overweight. The results show that regular users of Sran have a prevalence obesity, lower overweight. This results in a strong negative correlation (R2=0.8276).
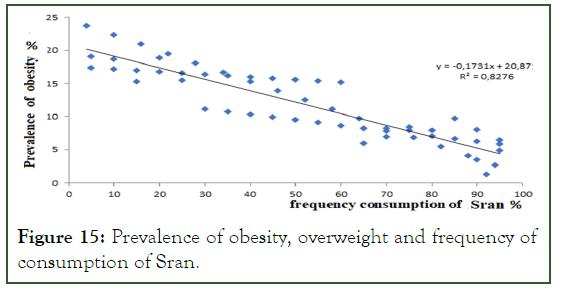
Figure 15: Prevalence of obesity, overweight and frequency of consumption of Sran.
Study of the correlation between the prevalence of obesity, overweight and the frequency of consumption of Guile
Obesity, overweight and consumption of Guile have a correlation between them (Figure 16). This strong negative correlation R2=0.8099 between the prevalence of obesity, overweight and the frequency of consumption of Guile indicates that the more the frequency of consumption in Guile is on the rise, the fewer obese people there are.
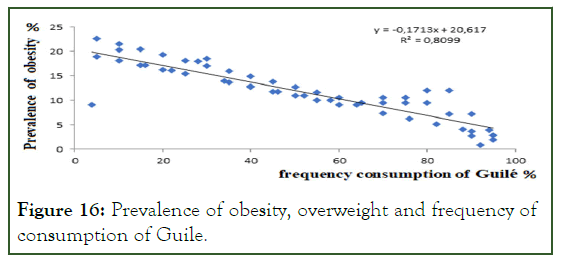
Figure 16: Prevalence of obesity, overweight and frequency of consumption of Guile.
Discussion
The objective of the present study is to determine the impact of the consumption of three plants food in the department of man on the Body Mass Index (BMI) and Arterial Hypertension (HTA). Thus the prevalence of hypertension of obesity and the frequency of consumption of said plants have been studied to:
• Show the existing correlation between the prevalence of hypertension and the frequency of consumption of the three plants.
• Show the correlation between the prevalence of obesity and the frequency of consumption of three plants.
Overall, the prevalence of hypertension for the study period and environment is 23.7. By rating Ivory although the prevalence of hypertension is not clearly documented, the secretariat general of the Abidjan Cardiology Institute foundation (ICA foundation) placed it in 2017 at around 38%. The prevalence of hypertension in the subjects surveyed is lower than the national prevalence of 2017, however hypertension is a public health problem in this study. However, the results of this study are substantially identical to those found in Adzope Attoh T, et al. Abobo-Te (Abidjan) [11]. Other studies like that of Acka in Ivory Coast and Pessinaba in Senegal have shown the prevalence higher by almost 45%. In general, the prevalence of hypertension is high in Africa and tends to increase in most countries [12]. Changing lifestyles (rural exodus, food, sedentarization) also contribute to the development of hypertension in Africa [13]. Indeed, this change in lifestyle is due to the demographic transition and epidemiological which is accompanied by major changes in lifestyles. We observe increasing urbanization, economic development and industrialization eating.
The analysis of our results show a significant link between the place of residence and the occurrence hypertension (86.67%). This confirms the hypothesis that hypertension is very common in subjects in urban areas [14]. Indeed, urbanization in low income countries leads to a westernization of life. It also leads within the African populations a change in culinary and eating habits [15]. These results are in contradiction with those found in the STEPS survey carried out in Senegal in 2015 where the prevalence was significantly higher in rural areas than in urban areas (26.2% against 21.7%).
The results of our study allow us to affirm that the prevalence of hypertension is more high in subjects over 40 years of age. Our results corroborate those of Attoh T, et al.; Ayima, et al.; Wamala, et al. [16]. On the other hand, Pessinaba did not found a link between age and the onset of hypertension [17]. Indeed from this age we witness at the birth of metabolic diseases such as hypertension, diabetes, obesity, diseases cardiovascular.
Speaking of obesity, our results show that overall obesity and overweight occupy 22.6% of our sample. This prevalence is “to the national one which is obesity and overweight” are nowadays much found in developing countries. That can be explained by changes in eating habits. Indeed, the man who lived of hunting and gathering, foods without preservatives or dyes are found in our days with a diet full of chemical component. Growing consumption saturated fat, animal products as well as salt and sugar contribute to the increase in diet related noncommunicable diseases (obesity). About 84.37% of the subjects surveyed residing in urban areas suffered from obesity and overweight. These results corroborate those of several authors including. This can be explained by certain factors, including behavioral factors such as the reduction of expenses energy through physical activity and the increase in the calorific balance ingested by the consumption of sugary and fatty foods. The increasing use of means of transport to the detriment of walking, or the practice of sedentary leisure (video games, watching television) to the detriment of the practice of sport. The low traditional diet fat but high in fiber is replaced by a fat made from meat, dairy products with high in saturated fat, much salt in cities than villages in Africa. This food transition in our urban societies can also be explained by the growing increase in the number of fast food services, the size of the individual portions and the presence of advertising campaigns encouraging the consumption of fatty and sugary products.
The prevalence of obesity and overweight according to age shows that the bracket is more exposed to obesity and overweight. These results are in agreement with those of many authors. This could be explained by the fact of financial stability, a desire to enjoy the things of life. Indeed the desire to discover the meals and the restorations said to be the best from the West, which are mostly very calorific rich in fats and sugar but low in minerals, vitamins and other micronutrients. A decrease physical exercise due to the increasingly sedentary nature of many forms of work. The results also showed that 9.7% of the most 60 years old are declared overweight and obese. This prevalence is much lower than those under 60. Unlike adults in the bracket, those over 60 years are in majority towards or in retirement, therefore a drop in income. In addition adults after the experience of the slice are more exposed to metabolic diseases (diabetes, hypertension, obesity).
The correlations showed that the prevalence of hypertension, obesity, overweight and consumption frequency of Zanhan, Guile and Sran are negative. A negative correlation is the relationship between two variables but in opposite direction. Correlations show that the consumption of Guile, Zanhan and Sran has no negative impact on hypertension and obesity in the population surveyed. Indeed the seeds of Beilschmiedia mannii (Sran) are protein seeds (43%-53% protein) and a sugar content of 7.44%. Sesamum radiatum (Guile) has a composition of 65% lipid, 23% protein and 2% sugar. This negative correlation can be explained by the fact that these three plants food could have protective nutritional elements of hypertension and obesity.
Conclusion
Our work focused on the impact of Beilschmiedia mannii , Sesamum radiatum and Byttneria catalpifolia on Body Mass Index (BMI) and high blood pressure (hypertension). It appears that factors such as age, place of residence have an influence on the prevalence of hypertension and obesity. The most favorable age group for development hypertension (metabolic disease) is 40-60 years and 60-85 years and 40-60 years for obesity. The middle urban is also an environment where hypertension and obesity are most prevalent. The correlations showed that the more the subjects surveyed consumed the three food plants studied, the less they were exposed to hypertension and obesity.
References
- Gomez-Chang E, Uribe-Estanislao GV, Martinez-Martinez M, Galvez-Mariscal A, Romero I. Anti-helicobacter pylori potential of three edible plants known as Quelites in Mexico. J Med Food. 2018;21(11):1150-1157.
[Crossref] [Google Scholar] [PubMed]
- Thakur D, Sharma A, Uniyal SK. Why they eat, what they eat: Patterns of wild edible plants consumption in a tribal area of Western Himalaya. J Ethnobiol Ethnomed. 2017;13(1):1-2.
[Crossref] [Google Scholar] [PubMed]
- Feyssa DH, Njoka JT, Asfaw Z, Nyangito MM. Seasonal availability and consumption of wild edible plants in semiarid Ethiopia: Implications to food security and climate change adaptation. J Hortic For. 2011;3(5):138-149.
- Uzogara SG. The impact of genetic modification of human foods in the 21st century: A review. Biotechnology Adv. 2000;18(3):179-206.
[Crossref] [Google Scholar] [PubMed]
- Blair SN, Good year NN, Gibbons LW. Physical fitness and incidence of hypertension in healthy normotensive men and women. JAMA. 1984;252(4):487-490.
[Google Scholar] [PubMed]
- McCarron DA. Calcium and magnesium nutrition in human hypertension. Ann Inter Med. 1983;98:800-805.
[Crossref] [Google Scholar] [PubMed]
- Dressler WW. Social and cultural influencein cardiovascular diseases: A review. Transcult Psychiatry Res Rev. 1984;21(1):5-42.
- Graham R, Senadhira D, Beebe S, Iglesias C, Monasterio I. Breeding for micronutrient density in edible portions of staple food crops: Conventional approaches. Field Crops Res. 1999;60(1-2):57-80.
- James SA, Kleinbaum DG. Sociologic stress and hypertension related mortality rates in North Carolina. AMJ public Health. 1976;66(4):354-358.
[Crossref] [Google Scholar] [PubMed]
- Klatsky AL, Friedman GD, Siegelaub Gerard MJ. Alohol consumption and blood pressure Kaiser-permanente multiphasic health examination data. N Engl J Med. 1977;296(21):194-200.
[Crossref] [Google Scholar] [PubMed]
- Neaton JD, Kuller LH, Went worth D, Borhani No. Total and cardiovascular mortality in relation to cigarette, smoking, serum cholesterol concentration, in diastolc blood pressure among black in white moles followed in for years. Am Heart J. 1984;108(3):759-770.
[Crossref] [Google Scholar] [PubMed]
- Domingo JL, Bordonaba JG. A literature review on the safety assessment of genetically modified plants. Environ Int. 2011;37(4):734-742.
[Crossref] [Google Scholar] [PubMed]
- Cao Y, Li R, Zhou S, Song L, Quan R, Hu H. Ethnobotanical study on wild edible plants used by three trans-boundary ethnic groups in Jiangcheng County, Pu’er, Southwest China. J Ethnobiol Ethnomed. 2020;16(1):1-23.
[Crossref] [Google Scholar] [PubMed]
- Qaim M, Kouser S. Genetically modified crops and food security. PloS one. 2013;8(6):e64879.
[Crossref] [Google Scholar] [PubMed]
- Welch RM. The impact of mineral nutrients in food crops on global human health. Plant and Soil. 2002;247:83-90.
- Lentini F, Venza F. Wild food plants of popular use in sicily. J Ethnobiol Ethnomed. 2007;3:1-2.
[Crossref] [Google Scholar] [PubMed]
- Simopoulos AP. Omega‐3 fatty acids in wild plants, nuts and seeds. Asia Pac J Clin Nutr. 2002;11:S163- S173.
Citation: Ba KM, Carole KA, Brice G, Kouakou B (2023) Impact of the Consumption of Three Food Plants in the Department of Man on the Body Mass Index and High Blood Pressure. Glob J Biol Agric Health Sci. 12:173.
Copyright: © 2023 Ba KM, et al. This is an open access article distributed under the terms of the Creative Commons Attribution License, which permits unrestricted use, distribution, and reproduction in any medium, provided the original author and source are credited.
