Indexed In
- Genamics JournalSeek
- Academic Keys
- JournalTOCs
- China National Knowledge Infrastructure (CNKI)
- Access to Global Online Research in Agriculture (AGORA)
- Centre for Agriculture and Biosciences International (CABI)
- RefSeek
- Directory of Research Journal Indexing (DRJI)
- Hamdard University
- EBSCO A-Z
- OCLC- WorldCat
- Scholarsteer
- SWB online catalog
- Publons
- Euro Pub
- Google Scholar
Useful Links
Share This Page
Journal Flyer

Open Access Journals
- Agri and Aquaculture
- Biochemistry
- Bioinformatics & Systems Biology
- Business & Management
- Chemistry
- Clinical Sciences
- Engineering
- Food & Nutrition
- General Science
- Genetics & Molecular Biology
- Immunology & Microbiology
- Medical Sciences
- Neuroscience & Psychology
- Nursing & Health Care
- Pharmaceutical Sciences
Research Article - (2024) Volume 15, Issue 4
Identification and Characterization of Caffeine Degrading Microbes from Coffee Husk for Production of Liquid Bio Fertilizer and Process Optimization by Using Rhizobium Bacteria
Zeynu Shamil*Received: 23-Nov-2020, Manuscript No. JFPT-24-7249; Editor assigned: 26-Nov-2020, Pre QC No. JFPT-24-7249 (PQ); Reviewed: 10-Dec-2020, QC No. JFPT-24-7249; Revised: 16-Aug-2024, Manuscript No. JFPT-24-7249 (R); Published: 13-Sep-2024, DOI: 10.35248/2157-7110.24.15.1121
Abstract
Bioremediation being a problem solver for many different environmental and other major hazards, they play an important and cost effective role in the decaffeination process. Within this experimental work eliminate caffeine from coffee husk then we take Rhizobium bacterial strain from Ethiopia bio diversity institute. We observe that could grow on the medium supplemented with 2.5g/L of caffeine i.e., could effectively degrade 2.5 g/L of caffeine in the liquid media as a sole source of carbon and nitrogen. Morphological and biochemical characteristics were maintained for re-affirmation the organism as Rhizobium . The degradation of caffeine capability was authenticated by growth curve. And secondly we observed that the potency of caffeine degradation caffeine degrading bacteria was maintained by standard medium with and without supplement of 2.5g/l of caffeine then we quantify no. of cell grow within the medium then finally we optimized the factors by using experimental design software. The result we obtained temp; 35°C, pH 7.07 incubation time 36 hr from those optimal condition obtained maximum cell growth in number was 3.41995E+008 and 5.0707E+008 with and without caffeine respectively.
Keywords
Caffeine degradation; Bacteria re-affirmation; Growth curve; Rhizobium bacteria
Introduction
Every day, large quantity of waste is generated in all the developing and developed countries. The highly toxic organic compounds in the form of solid, liquid and gas have been synthesized and released into the environment directly or indirectly over a long period of time by industrial and agricultural activities. The production and improper disposal of agro wastes has become a major pollution issue round the world.
Biological decomposition of organic waste such as fertilizers, pesticides and agro wastes are the most important and effective way to remove these compounds from the environment. Bacteria are the major microorganisms found in soil which decompose soil organic materials, of which bacteria are most prominent and most abundant. Microbes use the waste for their own metabolism. Bacteria typically a few micrometers in length, bacteria have a number of shapes, ranging from spheres to rods and spirals. However, most bacteria have not been characterized, and only about half of the bacterial phyla have species that can be grown in the laboratory from environmental sample.
Composition of caffeine and function
Caffeine (3,7-dihydro-1,3,7-trimethyl-1H-purine-2,6 ione) was one of environmental sample a purine alkaloid, which acts as a stimulant of central nervous system but shows toxicity when fed in excess and also has negative withdrawal effects and it was present in different varieties of plants.
Such as coffee plant, tea leaves, colanut , cocoa beans and other plant. It is also present in soft drinks. Evidence has proved the harmful effects of caffeine thus opening a path in the field of caffeine biodegradation [1]. Biodegradation by bacteria is considered to be the most efficient technique in degrading caffeine within the environment. Even though there are available methods for the removal of caffeine using conventional methods such as water, supercritical and solvent decaffeination but they are lack of accuracy/specificity for the removal of caffeine and in addition to the existing caffeine which sometime remains. Caffeine content in regular and instant coffee ranges from 0.43 to 0.85 and from 0.61 to 0.82 mg/ml, respectively. It stimulates the central nervous system, Studies on caffeine degradation by microorganisms were not reported till 1970 probably because caffeine was regarded as toxic to bacteria. Caffeine concentration greater than 2.5 mg/ml in the growth medium has been found to inhibit the growth of many bacterial species. Moreover, caffeine is also one of the major agro industrial wastes generated from the coffee and tea processing plants and these wastes are often released into the water bodies. All the ingredients which were used in the present investigation for making liquid biofertilizer are easily available. In the present study of broth was tested for the identification of organism which was used as a liquid bio fertilizer. All the identify colonies were then inoculated on YEMA broth and PIKOVSKAYA ‘s broth with and without.”supplement of caffeine. Bacterial culture media can be classified on the basis of, 1) composition, 2) consistency and 3) purpose classification of bacterial culture media on the basis of consistency.
Solid medium: Solid medium contains agar at a concentration of 1.5%-2.0% or some other, mostly inert solidifying agent. Solid medium has physical structure and allows bacteria to grow in physically informative or useful ways (e.g. as colonies or in streaks). Solid medium is useful for isolating bacteria or for determining the colony characteristics of the isolate.
Semisolid media: Semisolid media are prepared with agar at concentrations of 0.5% or less. They have soft custard like consistency and are useful for the cultivation of microaerophilic bacteria or for determination of bacterial motility.
Liquid (broth medium: These media contains specific amounts of nutrients but don’t have trace of gelling agents such as gelatin or agar. Broth medium serves various purposes such as propagation of large number of organisms, fermentation studies and various other tests. The caffeine degradation by bacteria’s with their efficiency use of caffeine (g/100 ml) were Pseudomonas putida (0.03418), Alcaligenes xylosoxydans (0.6418), Rhizobium sp. (2) Pandoraea sp. (0.6216), Bacillus sp. (2.75), Enterobacter aerogenes (10.1) and E.coli (6.12) the efficiency of caffeine degrade from bacteria were low because poison high concentration of caffeine. Environmental impact due to caffeine pollution was large concentrated form of caffeine can be poison the free living microbe from the soil.
Objective of the research
The aim of this study was to determine the effect of caffeine degradation by using Rhizobium bacterial strain.
Materials and Methods
Materials used
Apparatus used for this research were include compound microscopy, electronic beam balance, filter paper, fennels, beakers, pipettes (volumetric), volumetric flasks (100 ml), pH meter, petri dish bean, vacuum apparatus separator funnels, beaker, heater and 250 mL round-bottom flask bakers, cylinder, shaker and laminar flow or biological safety cabinet for the experiment run on burner, conical flask, test tube, glass rod. The revolving equipment that used to make the mixture homogenous during dilution glass bottle to cultivate (grow), autoclave the petri dish, incubator used for microorganism growth under controlled conditions; aluminum foil and cotton.
Reagents (chemicals) are used
The reagents used in this research are coffee husk used as raw material, distilled water, hydrogen peroxide, H2O2, dichloromethane (CH2Cl2), Calcium carbonate (CaCO3), anhydrous magnesium sulfate (MgSO4), Phenolphthalein indicator, caffeine, buffer solution, nutrient agar broth. The phosphoric acid methyl red.
Method
Sampling method: Coffee husk samples were collected to analysis of physic-chemical parameters after one week of harvesting coffee bean clutch dried coffee husk. The coffee beans collected from SNNP region of Ethiopia in Sidama zone Bansa kebele.
Coffee plantation site of farmer dried coffee husk after one week of harvest of coffee used. This sample collected in the material of chemically sterilized plastic pot. All coffee husk samples can be collected on the same time at the day of mourning and immediately taken to the laboratory for physicalchemical analysis.
Sample preparation and analysis: 5 kg of single dried coffee husk sample were collected from SNNP in Sideman zone Bansa town coffee plantation of farmer site the collected coffee husk samples was kept in an incubator before being prepared for analysis because protecting from other unwanted microbes side effect (conversion) the moisture contents were analyzed and also physical observation of coffee on plantation site is must be maintained [2]. Washed by distil waters for dry experiment followed by immediate drying then there were leads to size reduction by disk mill with diameter of particle size <<<0.2 mm.
Till date, regrettably, it continues being absurd and heartbreaking observing that, the politico-economic, sociopsychological and cultural capacities for sustainable human development in Africa’s postcolonial state, remain embroiled into extensive gratuitous state power illegitimacy, even after the formal demise or better still the stepping-aside of colonisation from some over fifty (54) states in Africa, most of which enjoy over sixty years of self-rule”. Definitely, this results into the rising incessant imaginary and/or real quest for disintegration of Africa’s nationalities as illustrated in Nigeria, Senegal, Cameroon, Sudan, South Sudan, Morocco, and so on [3].
Physicochemical value of coffee husk: Physicochemical analysis of coffee husk tests measure the microbial composition and activity of different CH (Coffee Husk) horizons. The physicochemical characteristics of CH influence the rate of biomass production and the activity and composition of microorganisms. Seasonal changes in CH moisture, CH temperature, pH organic carbon, nitrogen, lignin, starch, cellulose and hemicelluloses can have a large effect on CH microorganisms, which, in turn, affect the ability of the CH to supply nutrients to plants through the turnover of CH organic matter. Therefore, the physiochemical analysis of the collected CH samples were extremely important and should always be performed. pH was measured using pH meter, where as the CH temperature was measured using thermometer. The moisture content was analyzed by weighing the CH sample before and after oven drying. Spectrophotometric analysis as done in order to find nitrogen, cellulose and starch content. The standard titration method as well as laboratory analytical method was followed in order find the organic content, lignin and hemicelluloses content.
Extraction of caffeine (decaffeination): We used 250 mL of distil water and 20 g of pre-ground coffee husk in the espresso maker to make the coffee. After we collected the coffee into beaker that had a 6.0 g of CaCO3 in it, we heated the mixture to about 70°C for about 10 minutes on a hot plate to make digestion and cold down up to room temperature. Then we used the funnel, for filter aid inside the filter to filtration. Foaming is occurred; vacuum removed right away until foaming disappeared. Afterwards, the filtrate was transferred evenly into 2 separator funnels and extracted with 80 mL of dichloromethane (CH2Cl2) [4]. The separator funnels were rolled carefully and not shaken. After the extractions, the organic (bottom) layer was collected. The combined organic layer then was dried with anhydrous magnesium sulfate (MgSO4). The insoluble solids were filtered and removed.
The filtrate then was transferred into a 250 mL round-bottom flask. Then a rotary evaporator was used to evaporate the solution. This then formed the crude caffeine. The purpose is to isolate caffeine from coffee husk by using the organic solvent dichloromethane (CH2Cl2) that is also referred to as direct contact. Calcium carbonate (CaCO3) is used to remove the tannins from the coffee husk. Afterwards an extraction is used to separate the organic layer (bottom) from the aqueous layer (upper). By using an evaporator, it evaporates the organic solvent and forms the crude caffeine. Afterwards we used filtration for recrystallization and to obtain pure caffeine.
Screening of caffeine degrading bacteria: Using coffee husk sample from Ethiopia biodiversity institute initially before serial dilution 1 g of coffee husk sample was inoculated into enrichment media (g/l) containing disodium hydrogen phosphate (0.12), potassium dihydrogen phosphate (1.3), calcium chloride (0.3), magnesium sulphate (0.3) and ferrous sulphate (0.02). From that medium 1 ml was taken and transferred to serial dilution tubes and organisms were isolated by spread plate technique up to 8 strain of bacteria isolated from coffee husk. (From interview of Ethiopia biodiversity institute microbial staff) from those isolated strain of bacteria from Ethiopia biodiversity institute we take Rhizobium and Bacillus strains of bacteria for this experiment.
Organisms selected from the primary media were then inoculated into secondary screening media with different concentrations of caffeine was used. The strain capable of growing 2.5 g/100 ml concentration of caffeine was selected and transferred to the enrichment broth with supplement of caffeine (2.5 g/L) and incubated at 37°C in shaking incubator 120 rpm, for 48 hrs.
Analytical methods: Analytical method was methods used for this experiment for determination of potent or potential of microbes (Rhizobium and Bacillus spp.) to degrade caffeine analyzed by growth curve experiment.
Growth curve experiment: The growth curve experiment was carried out to understand the effect of caffeine on the growth kinetics of the organism. In the control flask the organism was inoculated into enrichment media without caffeine so that the normal growth of the organism can be analyzed and the test flask media was supplemented with Caffeine (2.5 g/L) deflection of growth curve were occurred to determine caffeine degrading capacity the same result observed with Sneha Nayak.
Viable cell counting (spread plate technique)-Serial dilution: 54 ml (i.e., 9 ml for each test tube) of distilled water was added into 6 test tubes to dilute the sample. The prepared distilled water was foiled with aluminum and then sterilized at 121°C for 15 psi and for 1 hrs the sterilized distilled water was then cooled. Then serial dilution was done. Then 54 ml of distilled water were shared for 6 test tube up to 9 ml of distilled water then 1 ml of samples filtrate of caffeine were taken and added into first distilled water test tube label 10-1 using pipette to dilute the sample [5]. Then 1 ml droplet of solution was taken from each of the 1st test tube and added to each 2nd test tube label 10-2. This procedure was continued up to the 6th test tube of sterilized distilled water for each sample (i.e., you make 10- 1-10-6 dilution for each sample) one after the other. 0.1 ml of diluted sample was taken from each of 12 test tubes and inoculated into labeled agar plate (inoculation of the sample occur after agar solution were solidified on plate. This solidification processes may be take up to 20 min) then by using sterilized spreader the sample was distributed. Finally, viable cell counted. The bacteria can be counted by calculating C.F.U. i.e., Colony Forming Unit.
C.F.U=No. of colonies/inoculums size (ml) × dilution factor C.F.U/ml
Characterization of screening caffeine degrading bacteria: The caffeine samples serial dilutions were done. The organism was identified by the analysis of the characteristics according to the morphological and biochemical characteristics. The various biochemical tests conducted were citrate utilization, catalase, urease, indole, methyl red, nitrate reduction test and carbohydrate fermentation such as lactose maltose sucrose were performed and confirmed. Then using the specific medium agar (YEMA and pikovaskiya media supplement with/without caffeine) for Rhizobium and Bacillus subtilis were used to grow the organism for the mass production.
Gram staining: The Gram stain is almost always the first step in the preliminary identification of a bacterial organism. A smear was prepared by placing a drop of water on the slide and then transferring microorganism to the drop of water with a sterile cooled loop. It was mixed and spread by means a circular motion of the inoculating loop. Smear was air dried. Crystal violet is the primary stain used first and stains all cells purple.
Its function is to impart its color to all cells in order to establish a color contrast. Grams iodine, used as mordent in which this reagent is not only a killing agent, but also serves as a mordant a substance that increases the cells affinity for a stain. It does this by binding to the primary stain, thus forming an insoluble complex.
The resultant crystal violet iodine complex serves to intensify the color of the stain. At this point, all cells will appear purple black. Ethyl alcohol, 95% is used as decolorizing agent in which this reagent serves as a dual function as a protein dehydrating agent and as a lipid solvent. By using this gram negative bacteria become colorless. Safranin is used to stain red those cells that have been previously decolorized. Thus safranin is a counter stain since only gram negative cells undergo decolourization, they may now absorb the counterstain. Gram positive cells retain the purple color of the primary stain and gram negative bacteria appear as pink color using compound microscope 40* lenses.
Caffeine degradation by bacteria: Some microorganisms have the ability to grow in the presence of caffeine and survival would be related to their capacity to degrade the alkaloid. Actually, it is not rare to find bacterial strains resistant to caffeine [6]. Some microorganisms, e.g., Klebsiella pneumoniae, Bacillus and Rhizobium can utilize purines/caffeine as carbon or nitrogen sources. So the experiment looks likes follows to determine bacteria use caffeine as substrate.
Prepare the 50 ml broth of microorganism (Rhizobium and Bacillus) using YEMA and PIKOVASKIYA medium for Rhizobium and Bacillus sp. of bacteria respectively. Similar procedure is followed for preparing 50 ml of broth which supplemented with 2.5 g/l of caffeine. These both of the mixture were ready to use as liquid bio fertilizer. Each individual microorganism inoculated the respective microorganism and shakes vigorously now this broth was ready to use for liquid biofertilizer then investigated the effect and the optimum of those selected factor pH, temperature and incubation time for response of maximum cell growth with and without caffeine containing broth by means of counted bacterial cell (Table 1).
| Sr No. | Ingredients | GM/mL |
|---|---|---|
| 1 | K2HPO4 | 0.5 |
| 2 | MgSO4 | 0.1 |
| 3 | Nacl | 0.2 |
| 4 | Yeast extract | 10 |
| 5 | Manitol | 10 |
Table 1: Ingredients for Rhizobium broth (YEM medium).
Experimental design analysis
Experimental data analysis was analyzed by the software designexpert 6.0-8.0. The experimental design selected for this study type was response surface method and design model was quadratic model, Box-Behnken design and the response variable was count number of bacteria cell growth. For each of with and without caffeine supplemented media broth (caffeine use 2.5 g/l) for Rhizobium bacteria spp. The three independent variables studied to determine the response factor cell growth (number of bacteria) was temperature, incubation time and pH (acid base status media) and those independent factor was the condition that can affect the growth of bacteria. There was level for each of condition (temp, pH and incubation time) shown as the following table (Table 2) [7].
| Factors | Level | ||
|---|---|---|---|
| Temperature (°C) | 27 | 37 | 47 |
| pH | 6 | 7 | 8 |
| Incubation time (hrs) | 10 | 25 | 40 |
Table 2: Experimentally optimize factor and levels.
Results and Discussion
Physicochemical analysis of coffee husk based on the physicochemical analysis of dry coffee husk samples the result was tabulated. Moisture content, pH, temperature, play a major role in the increase of the microbiological activity of the environmental sample. So before identifying or supplemented to the bacteria, the physical and chemical properties of the coffee husk sample must be analyzed properly.
So as shown in Table 3 the caffeine content of dry coffee husk was 0.9% whereas the current individual study finding shown on the table was 0.6% this shows that the study had a little bit of difference due to the increment of total carbohydrate and protein content of dry coffee husk [8].
| Sr No. | Physicochemical properties | Dry coffee husk |
|---|---|---|
| 1 | pH | 6.9 |
| 2 | Total carbon | 49 |
| 3 | Nitrogen | 7 |
| 4 | Moisture | 28 |
| 5 | Starch | 11 |
| 6 | Protein | 9 |
| 7 | Lipids | 1.5 |
| 8 | Minerals | 4.3 |
| 9 | Total carbohydrate | 69 |
| 10 | Cellulose | 42 |
| 11 | Hemicellulose | 6.5 |
| 12 | Lignin | 18 |
| 13 | Ash content | 5 |
| 14 | Caffeine | 0.89 |
Table 3: Physiochemical analysis.
Extracted caffeine from this experiment were 0.9% per gram of sample were crude caffeine was obtained from rotary evaporator extracted cured caffeine was again subjected to recrystallization (drying) there was 0.6% of pure caffeine were obtained. Those extracted percent of caffeine were more related with Table 3 then we used that extracted caffeine for bacterial substrate as carbon/nitrogen source. The collected strain of bacteria from Ethiopia biodiversity institute that were isolated from coffee husk were revealed or authenticated by means of morphological and biochemical test see from Table 4 [9].
| Test | Rhizobium sp. |
|---|---|
| Shape | Strait rode |
| Gram staing | -ve |
| Indole | -ve |
| Methyl red | +ve |
| Citrate | -ve |
| Gas production | -ve |
| Catalase | +ve |
| Urease production | +ve |
| NR | +ve |
| Carbohydrate fermentation | |
| Lactose | -ve |
| Maltose | +ve |
| Sucrose | +ve |
Table 4: Morphological and biochemical test.
From the two identity microbes as caffeine degrading bacteria was taken for secondary screening both Rhizobium and Bacillus was able to tolerate to 2.5 g/L of caffeine supplemented with other media components. The two identify bacteria were inoculated into enrichment broth with different concentration of caffeine to analyze how much amount of caffeine was degraded by the organism within 24 hrs of cell grow with growth curve analysis. Identified or authenticated (revealed) as Bacillus spp. and Rhizobium spp. by means of morphological and biochemical test [10]. Organism growth curve to study the effect of caffeine (caffeine degrading capacity) were done on the growth pattern of the organism. The organism was inoculated into medium containing caffeine and a control medium without caffeine being inoculated with the same organism; the results were shown in figure appendix C growth of the organism was monitored by growth curve experiment. The control flask showed a normal growth of the bacterium and there were changes in the growth pattern of organism on the test flask. This was due to the fact that caffeine contributed the cellular metabolism of the bacteria. So that the log phase was promoted lag phase along with high cell density was observed.
Analytical methods (analysis)
Analytical method was methods used for this experiment for determination of potent or potential of microbes (Rhizobium and Bacillus spp.) to degrade caffeine analyzed by growth curve experiment (Figure 1).
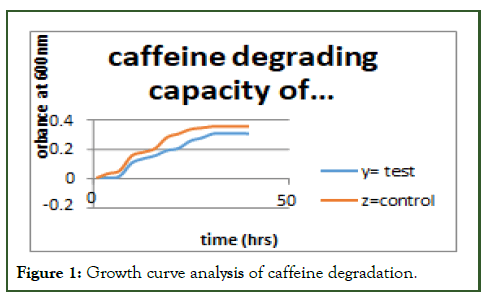
Figure 1: Growth curve analysis of caffeine degradation.
Statistical analysis of the experimental results for 50 mL of broth for Rhizobium bacteria (without supplement of caffeine)
Experimental results of three factors with three levels, one replicate and the following tables show statistical analysis of the experimental results by using design-expert software (version 6.0.8). Summary of the model details is that study type is response surface method design Box-Behnken center point is zero design model is quadratic number of experiment is 17 (Table 5).
| Run | Block | Factore 1 temp (°C) | Factore 2 pH | Factore 3 incubation time | Cell growth |
|---|---|---|---|---|---|
| 1 | Block 1 | 37 | 8 | 40 | 3.2E+008 |
| 2 | Block 1 | 27 | 6 | 25 | 3.994E+007 |
| 3 | Block 1 | 27 | 8 | 25 | 7.99E+007 |
| 4 | Block 1 | 27 | 7 | 40 | 1.45E+008 |
| 5 | Block 1 | 47 | 8 | 25 | 8.9E+008 |
| 6 | Block 1 | 37 | 6 | 40 | 2.6E+008 |
| 7 | Block 1 | 37 | 7 | 25 | 4.23E+008 |
| 8 | Block 1 | 37 | 7 | 25 | 4E+008 |
| 9 | Block 1 | 47 | 7 | 10 | 1.42E+008 |
| 10 | Block 1 | 37 | 6 | 10 | 2E+008 |
| 11 | Block 1 | 37 | 7 | 25 | 4.99E+008 |
| 12 | Block 1 | 27 | 7 | 10 | 1E+008 |
| 13 | Block 1 | 37 | 7 | 25 | 3.46E+008 |
| 14 | Block 1 | 47 | 6 | 25 | 4E+007 |
| 15 | Block 1 | 37 | 7 | 25 | 4.62E+008 |
| 16 | Block 1 | 37 | 8 | 10 | 2.22E+08 |
| 17 | Block 1 | 47 | 7 | 40 | 1.99E+08 |
Table 5: Response of cell growth for Rhizobium.
Analysis of Variance (ANOVA)
In ANOVA analysis the model was significant when fisher’s F test with a very low probability value. From Table 11 observed that the Model F-value of 3.6 implies the model is significant. There is only a 4.42% chance that a "Model F-Value" this large could occur due to noise. Values of "Prob>F" less than 0.0500 indicate model terms are significant. In this case A, B AB, are significant model terms. Values greater than 0.1000 indicate the model terms are not significant [11]. The coefficient was linear effect of temperature and pH and incubation time was least significant (Table 6).
| Source model | Sum of square | DF | Mean squares | F value | Prob>F | |
|---|---|---|---|---|---|---|
| 5.758E+017 | 8 | 7.198E+016 | 3.6 | 0.0442 | Significant | |
| A | 1.026E+017 | 1 | 1.026E+017 | 5.14 | 0.0332 | |
| B | 1.181E+017 | 1 | 1.181E+017 | 5.91 | 0.0411 | |
| C | 8.450E+015 | 1 | 8.450E+015 | 0.42 | 0.5337 | |
| A2 | 7.534E+016 | 1 | 7.534E+016 | 3.77 | 0.0881 | |
| B2 | 3.732E+015 | 1 | 3.732E+015 | 0.19 | 0.6770 | |
| C2 | 8.942E+016 | 1 | 8.942E+016 | 4.48 | 0.0673 | |
| AB | 1.640E+017 | 1 | 1.640E+017 | 8.21 | 0.0210 | |
| AC | 3.600E+013 | 1 | 3.600E+013 | 1.802E-003 | 0.9672 | |
| Residual | 1.598E+017 | 8 | 1.998E+016 | |||
| Lack of fit | 1.461E+017 | 4 | 3.653E+016 | 10.66 | 0.0208 | Significant |
| Pure error | 1.371E+016 | 4 | 3.427E+015 | |||
| Cor total | 7.356E+017 | 16 |
Table 6: ANOVA analysis.
Final equation in terms of actual factors
Cell growth=+6.70931E+008-3.19402E+007 Temp-2.11012E+008 pH +3.38111E+007 Incubation time-1.33770E+006 Temp2-2.97700E+007 pH2-6.47689E+005 Incubation time2+2.02510E+007 temp*pH+20000.00000 temp*incubation time
Effect and interaction of temperature and pH (fixed) on the incubation time for Rhizobium bacteria growth
The following Figure 2 show that an interaction effect of temperature and pH in this case, both temperature and pH have significant quadratic effects (P<0.05), indicating the presence of an optimum factors. When temperature increase cell growth also increases at pH of 7.
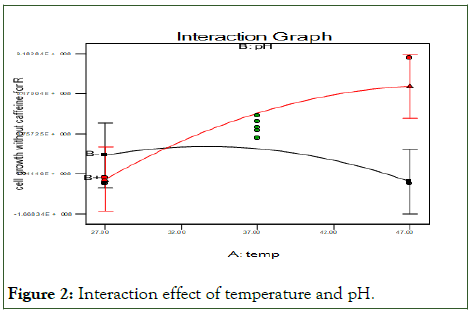
Figure 2: Interaction effect of temperature and pH.
The following Figure 3 show that an interaction effect of temperature and incubation time has significant quadratic effects (P<0.05), indicating the presence of an optimum in both factors [12]. The effect of temperature and incubation Time on the cell growth it shows 37°C of temperature of media with microbes inter in to shaking incubator for 21 hrs.
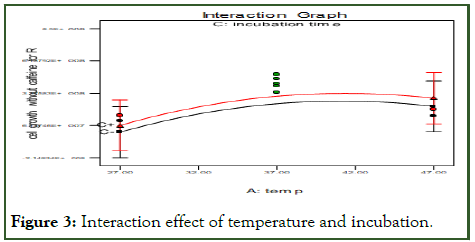
Figure 3: Interaction effect of temperature and incubation.
Statistical analysis of the experimental results of media supplemented with 2.5 g/l of caffeine for Rhizobium bacteria
Experimental results of three factors with three levels and one republican and the following tables show statistical analysis of the experimental results by using design-expert software (version 6.0.8). Summary of the model details is that study type is response surface method box-Behnken design model is quadratic number of experiment is 17 (Table 7).
| Run | Block | Factore 1 temp (°c) | Factore 2 pH | Factore 3 incubation time | Cell growth |
|---|---|---|---|---|---|
| 1 | Block 1 | 47 | 8 | 25 | 9.4E+007 |
| 2 | Block 1 | 37 | 7 | 25 | 4.63E+008 |
| 3 | Block 1 | 37 | 8 | 10 | 2.62E+008 |
| 4 | Block 1 | 37 | 6 | 40 | 3E+008 |
| 5 | Block 1 | 27 | 6 | 25 | 4.394E+007 |
| 6 | Block 1 | 47 | 7 | 10 | 1.82E+008 |
| 7 | Block 1 | 37 | 7 | 25 | 5.02E+008 |
| 8 | Block 1 | 27 | 8 | 25 | 8.39E+007 |
| 9 | Block 1 | 37 | 6 | 10 | 1.89E+008 |
| 10 | Block 1 | 37 | 7 | 25 | 4.4E+008 |
| 11 | Block 1 | 37 | 7 | 25 | 3.86E+008 |
| 12 | Block 1 | 47 | 7 | 40 | 2.39E+008 |
| 13 | Block 1 | 27 | 7 | 40 | 1.85E+008 |
| 14 | Block 1 | 37 | 7 | 25 | 5.39E+008 |
| 15 | Block 1 | 47 | 6 | 25 | 4.4E+007 |
| 16 | Block 1 | 37 | 8 | 40 | 3.6E+008 |
| 17 | Block 1 | 27 | 7 | 10 | 1.4E+008 |
Table 7: Response of cell growth for Rhizobium media supplemented with caffeine.
Analysis of Variance (ANOVA)
In ANOVA analysis the model was significant when fisher’s F test with a very low probability value. From Table 13 observed that the model F-value of 19.32 implies the model is significant. There is only a 0.04% chance that a "Model F-value" this large could occur due to noise. Values of "Prob>F" less than 0.0500 indicate model terms are significant. In this case A2, B2, are significant model terms. Values greater than 0.1000 indicate the model terms are not significant. The coefficient was linear effect of temperature and pH and incubation time was not significant (Table 8).
| Source model | Sum of square | DF | Mean squares | F value | Prob>F | |
|---|---|---|---|---|---|---|
| 4.046E+017 | 9 | 4.496E+016 | 19.32 | 0.0004 | Significant | |
| A | 1.409E+015 | 1 | 1.409E+015 | 0.61 | 0.4621 | |
| B | 6.214E+015 | 1 | 6.214E+015 | 2.67 | 0.1463 | |
| C | 1.209E+016 | 1 | 1.209E+016 | 5.19 | 0.0567 | |
| A2 | 2.536E+017 | 1 | 2.536E+017 | 108.93 | < 0.0001 | |
| B2 | 1.000E+017 | 1 | 1.000E+017 | 42.98 | 0.0003 | |
| C2 | 4.897E+015 | 1 | 4.897E+015 | 2.1 | 0.1902 | |
| AB | 2.520E+013 | 1 | 2.520E+013 | 0.011 | 0.9200 | |
| AC | 3.600E+013 | 1 | 3.600E+013 | 0.015 | 0.9045 | |
| BC | 4.225E+013 | 1 | 4.225E+013 | 0.018 | 0.8966 | |
| Residual | 1.629E+016 | 7 | 2.328E+015 | |||
| Lack of fit | 2.584E+015 | 3 | 8.612E+014 | 0.25 | 0.8572 | Not significant |
| Pure error | 1.371E+016 | 4 | 3.427E+015 | |||
| Cor total | 4.209E+017 | 16 |
Table 8: Analysis of Variance (ANOVA caffeine supplemented Rhizobium).
Final equation in terms of actual factors
Cell growth=-1.08047E+010+1.80662E+008 temp+2.18203E +009 pH+1.09472E+007 incubation time-2.45395E+006 temp2-1.54145E+008 pH2-1.51578E+005 incubation time2+2.51000E+005 temp*pH+20000.00000 temp*incubation time-2.16667E+005pH * incubation time
Interaction effect of experimental variables on cell growth (media supplemented with 2.5 g/l of caffeine) Rhizobium bacteria
The following Figure 4 show that an interaction effect of temperature and pH on cell growth. In this case, both temperature and pH have significant quadratic effects (P<0.05), indicating the presence of an optimum factors. The effect of temperature and pH on the cell growth it shows 37°C of temperature of media with microbes inter in to shaking incubator by pH of 6.8 give high cell growth.
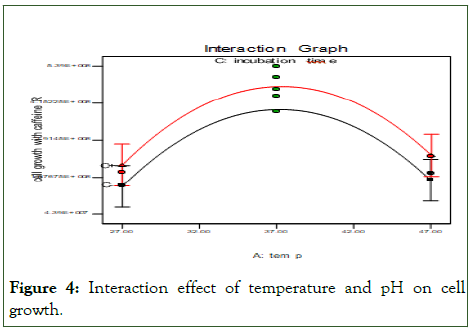
Figure 4: Interaction effect of temperature and pH on cell growth.
The following Figure 5 show that an interaction effect of temperature and incubation time on cell growth. In this case, both temperature and pH have significant quadratic effects (P<0.05), indicating the presence of an optimum factors. The effect of temprature and incubation time on the cell growth it show 37°C of temperature of media with microbes inter in to shaking incubator for 18 hrs give high cell growth.
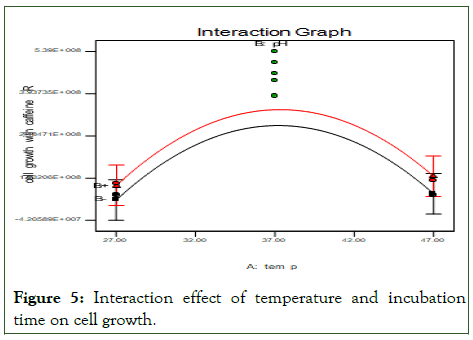
Figure 5: Interaction effect of temperature and incubation time on cell growth.
Desirability
The desirability function was the solution for multy-response optimization. Desirability is an objective function that ranges from zero outside of the limit to one at the goal. The numerical optimization finds a point that maximizes the desirability function. The desirability value of 0.631 corresponded to the cell numbers, and in the given range of parameters. The following histogram shows how each variable satisfied the criteria: Values near one are good (Figure 6).
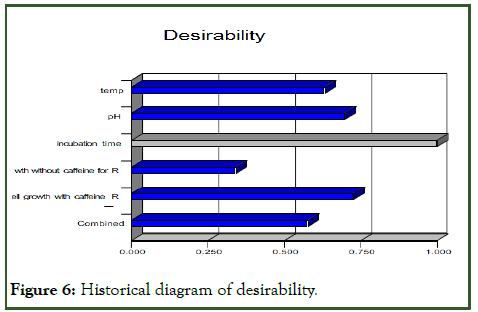
Figure 6: Historical diagram of desirability.
Validation of the analysis for Rhizobium
Prepare 50 ml of broth with and without supplemented of 2.5 gr/l of caffeine for growth medium of microorganism’s Bacillus those bacteria serve as liquid bio-fertilizer by inoculated the identify colonies of organism in to the broth and incubated at 34.08°C for 27.58 hrs and buffering pH of 6.58 followed by shaking vigorously. We obtain maximum cell growth 4.09131E +008 with supplement of caffeine and without supplement of caffein maxiume cell growth was 3.51146E+008 those cell were use as liquid bio fertilazer so additional number of cell obtained that 5.7985E+007 this show that this microbes use caffeine as substrate.
Conclusion
The environment where we live is the habitat for various microorganisms; mostly bacteria which are used for various industrial applications like enzymes production, fabric manufacturing, bioremediation like bio fertilizers pharmaceutical production etc. Microorganisms play an important role in composting of organic waste and can be an important contributor to optimal agricultural waste. This study revealed the identification of N2 fix (Rhizobium) bacteria caffeine as sole source of carbon and nitrogen as bacteria nutrient agar Because high content of carbon and nitrogen shown in physiochemical analysis. Degrading caffeine up to 2.5 g/l efficiently with an incubation time of 24 hrs. The main study evidence that lower concentration was found to show promoting effect on growth and productivity of plants.
The fertilizing efficiency broth is due to the presence of micro and macro nutrients, at preferential levels with/out supplement of caffeine. It can be concluded that the broth prepared using organism (Rhizobium) which were identify can be used as environment friendly liquid bio-fertilizers to replace hazardous chemical fertilizers. This will keep the fertile of soil conditions intact and maintain it for longer duration of time. Media supplemented with 2.5 g/l of caffeine then optimized the factor like temperature pH and incubation time that affect the response of cell growth for both species of bacteria supplemented and without supplemented caffeine.
The ability of the organism to degrade caffeine was determined by comparing the spectrum of caffeine with that of the sample. And also release best organism that degrade caffeine with this analytical method. Another revealed of this research 8% of caffeine eliminated from coffee husk per sample. Then those microbes authenticated by different morphological and biochemical test with those test we observe that most of test were active. And also effect of temperature (mesospheric regiom) and pH (weak acidic region) and incubation time analysis.
References
- Adesemoye AO, Torbert HA, Kloepper JW. Enhanced plant nutrient use efficiency with PGPR and AMF in an integrated nutrient management system. Can J Microbiol. 2008;54(10):876-886.
[Crossref] [Google Scholar] [PubMed]
- Asano Y, Komeda T, Yamada H. Microbial production of theobromine from caffeine. Biosci Biotechnol Biochem. 1993;57(8):1286-1289.
- Blecher R, Lingens F. The metabolism of caffeine by apseudomonas putidastrain. Hoppe Seylers Z Physiol Chem. 1977;358(7):807-817.
[Crossref] [Google Scholar] [PubMed]
- Buerge IJ, Poiger T, Muller MD, Buser HR. Caffeine, an anthropogenic marker for wastewater contamination of surface waters. Environ Sci Technol. 2003;37(4):691-700.
[Crossref] [Google Scholar] [PubMed]
- Camargo MC, Toledo MC. Caffeine content of commercial Brazilian coffee. Food Sci Technol. 1998;18:421-424.
- Essig D, Costill DL, van Handel PJ. Effects of caffeine ingestion on utilization of muscle glycogen and lipid during leg ergometer cycling. Int J Sports Med. 1980;1(02):86-90.
- Glassmeyer ST, Furlong ET, Kolpin DW, Cahill JD, Zaugg SD, Werner SL, et al. Transport of chemical and microbial compounds from known wastewater discharges: Potential for use as indicators of human fecal contamination. Environ Sci Technol. 2005;39(14):5157-5169.
[Crossref][Google Scholar] [PubMed]
- James CA, Miller-Schulze JP, Ultican S, Gipe AD, Baker JE. Evaluating contaminants of emerging concern as tracers of wastewater from septic systems. Water Res. 2016;101:241-251.
[Crossref] [Google Scholar] [PubMed]
- Scott TM, Rose JB, Jenkins TM, Farrah SR, Lukasik J. Microbial source tracking: Current methodology and future directions. Appl Environ Microbiol. 2002;68(12):5796-803.
[Crossref] [Google Scholar] [PubMed]
- Ahmed W, Hamilton KA, Lobos A, Hughes B, Staley C, Sadowsky MJ, et al. Quantitative microbial risk assessment of microbial source tracking markers in recreational water contaminated with fresh untreated and secondary treated sewage. Environ Int. 2018;117:243-249.
[Crossref] [Google Scholar] [PubMed]
- Plummer JD, Long SC. Monitoring source water for microbial contamination: Evaluation of water quality measures. Water Res. 2007;41(16):3716-3728.
[Crossref] [Google Scholar] [PubMed]
- Glassmeyer ST, Furlong ET, Kolpin DW, Batt AL, Benson R, Boone JS, et al. Nationwide reconnaissance of contaminants of emerging concern in source and treated drinking waters of the United States. Sci Total Environ. 2017;581:909-922.
[Crossref] [Google Scholar] [PubMed]
Citation: Shamil Z (2024) Identification and Characterization of Caffeine Degrading Microbes from Coffee Husk for Production of Liquid Bio Fertilizer and Process Optimization by Using Rhizobium Bacteria. J Food Process Technol. 15:1121.
Copyright: © 2024 Shamil Z. This is an open-access article distributed under the terms of the Creative Commons Attribution License, which permits unrestricted use, distribution, and reproduction in any medium, provided the original author and source are credited.
