Indexed In
- Academic Journals Database
- Open J Gate
- Genamics JournalSeek
- Academic Keys
- JournalTOCs
- China National Knowledge Infrastructure (CNKI)
- CiteFactor
- Scimago
- Ulrich's Periodicals Directory
- Electronic Journals Library
- RefSeek
- Hamdard University
- EBSCO A-Z
- OCLC- WorldCat
- SWB online catalog
- Virtual Library of Biology (vifabio)
- Publons
- MIAR
- University Grants Commission
- Geneva Foundation for Medical Education and Research
- Euro Pub
- Google Scholar
Useful Links
Share This Page
Journal Flyer
Open Access Journals
- Agri and Aquaculture
- Biochemistry
- Bioinformatics & Systems Biology
- Business & Management
- Chemistry
- Clinical Sciences
- Engineering
- Food & Nutrition
- General Science
- Genetics & Molecular Biology
- Immunology & Microbiology
- Medical Sciences
- Neuroscience & Psychology
- Nursing & Health Care
- Pharmaceutical Sciences
Research Article - (2013) Volume 5, Issue 2
Hydroxocobalamin Quantification in Human Plasma by High-Performance Liquid Chromatography Coupled with Electrospray Tandem Mass Spectrometry in a Pharmacokinetic Study
Abstract
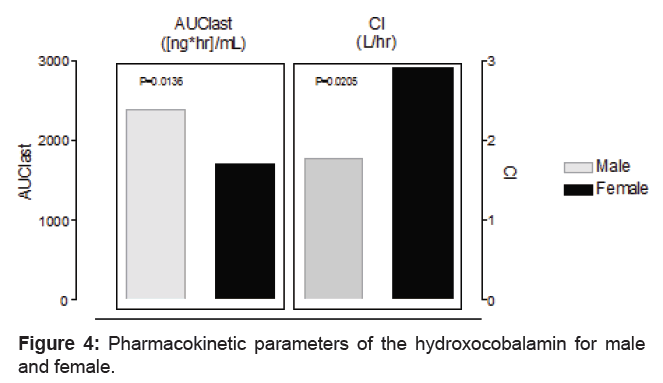
A rapid, sensitive and specific method for quantifying hydroxocobalamin in human plasma using paracetamol as the internal standard (IS) is described. The analyte and the IS were extracted from plasma by liquid-liquid extraction using an organic solvent (ethanol 100%; -20°C). The extracts were analyzed by high performance liquid chromatography coupled with electrospray tandem mass spectrometry (HPLC-MS-MS). Chromatography was performed on Prevail C8 3 μm, analytical column (2.1×100 mm i.d.). The method had a chromatographic run time of 3.4 min and a linear calibration curve over the range 5-400 ng.mL-1 (r>0.9983). The limit of quantification was 5 ng.mL-1. The method was also validated without the use of the internal standard. The precision in the intra-batch validation with IS was 9.6%, 8.9%, 1.0% and 2.8% whereas without IS was 9.2%, 8.2%, 1.8% and 1.5% for 5, 15, 80 and 320 ng/mL, respectively. The accuracy in intra-batch validation with IS was 108.9%, 99.9%, 98.9% and 99.0% whereas without IS was 101.1%, 99.3%, 97.5% and 92.5% for 5, 15, 80 and 320 ng/mL, respectively. The precision in the inter-batch validation with IS was 9.4%, 6.9%, 4.6% and 5.5% whereas without IS was 10.9%, 6.4%, 5.0% and 6.2% for 5, 15, 80 and 320 ng/mL, respectively. The accuracy in inter-batch validation with IS was 101.9%, 104.1%, 103.2% and 99.7% whereas without IS was 94.4%, 101.2%, 101.6% and 96.0% for 5, 15, 80 and 320 ng/mL, respectively. This HPLC-MS-MS procedure was used to assess the pharmacokinetics of Hydroxo cobalamin following intramuscular injection 5000 μg in healthy volunteers of both sexes (10 males and 10 females). The volunteers had the following clinical characteristics (according to gender and expressed as mean ± SD [range]): males: age: 32.40 ± 8.00 y [23.00-46.00], height: 1.73 ± 0.07 m [1.62-1.85], body weight: 72.48 ± 10.22 Kg [60.20- 88.00]; females: age: 28.60 ± 9.54 y [18.00-44.00], height: 1.60 ± 0.05 m [1.54-1.70], body weight: 58.64 ± 6.09 Kg [51.70- 66.70]. The following pharmacokinetic parameters were obtained from the hydroxocobalamin plasma concentration vs. time curves: AUClast, T1/2, Tmax, Vd, Cl, Cmax and Clast. The pharmacokinetic parameters were 120 (± 25) ng/mL for Cmax, 2044 (± 641) ng.h/mL for AUClast, 8 (± 3.2) ng.mL-1 for Clast, 38 (± 15.8) hr for T1/2 and 2.5 (range 1-6) hr for Tmax. Female volunteers presented significant (p=0.0136) lower AUC (1706 ± 704) ng.h/mL) and larger (p=0.0205) clearance (2.91 ± 1.41 L/hr), as compared to male 2383 ± 343 ng.h/mL and 1.76 ± 0.23 L/hr, respectively. These pharmacokinetic differences could explain the higher prevalence of vitamin B12 deficiency in female patients. The method described validated well without the use of the internal standard and this approach should be investigated in other HPLC-MS-MS methods.
Keywords: Cobalamin, Clearance, Healthy volunteer, Plasma, Gender difference, Vitamin B12 supplementation
Introduction
Cobalamin is necessary for the development of red blood cells, growth and nervous system maintenance [1]. It is present in animal products such as eggs, milk, fish and meat [1]. The dietary need for adults and infants are 1.5 ug (1 to 2 ug) and 0.4 ug per day, respectively [1,2]. Cobalamin plasma levels are considered normal between 0.2 and 0.9 ng/mL2. There are two different forms of administration for intramuscular vitamin B12: cyanocobalamin and hydroxocobalamin [1]. The hydroxocobalamin is the choice for intramuscular administration since it is more bioavailable than the water solution of cyanocobalamin, it is retained in the body longer and requires less frequent dosage [1,3]. This is due to the extensively bind to plasma proteins and the long half-life [3].
Hydroxocobalamin has been determined in human and rat plasma by isotopic dilution [4,5], in nutritive supplements and chlorella foods by capillary electrophoresis-inductively coupled plasma mass spectrometry [6] and in ovine tissues by high-performance liquid chromatography [7]. Here we describe a fast, sensitive, and specific method for quantification of hydroxocobalamin in human plasma using high-performance liquid chromatography coupled with tandem mass spectrometry (HPLC-MS-MS), with paracetamol as the internal standard. This method was subsequently used to assess the pharmacokinetic profile in healthy volunteers of both sexes (10 males and 10 females) of one injectable (intramuscular) vitamin B12 formulation (injectable solution of alfa 5,6-dimethylbenzimidazolyl pyrrolidone cobamide; 2.5 mL of 2.000 ug/mL solution).
Methods
Calibration standards and quality controls
Stock solutions of hydroxocobalamin and the IS were prepared in methanol-water (50:50 v/v) at concentrations of 1 mg/mL. Calibration curves of hydroxocobalamin were prepared by spiking blank plasma at concentrations of 5, 10, 20, 50, 100, 200, 300 and 400 ng/mL and the analysis was carried out in duplicate for each concentration. The quality control samples were prepared in blank plasma at concentrations of 15.0, 80.0 and 320.0 ng/mL (Low, intermediate and high qualitycontrol samples, respectively). The spiked plasma samples (standards and quality controls) were extracted on each analytical batch along with the unknown samples.
Drug, chemicals and reagents
Hydroxocobalamin was provided by Genix Indústria Farmacêutica Ltda, Brazil (lot number 507610360). Paracetamol was provided by Anqiu Luan Pharmaceutical China (lot number 0640720). Acetonitrile (HPLC grade), ethanol (HPLC grade), methanol (HPLC grade), formic acid (88%; Analysis Grade) and ammonium acetate (Analysis Grade) were purchased from Mallinckrodt (USA). Ultra pure water was obtained from an Elga UHQ system (UK). Blank human blood was collected from healthy, drug-free volunteers. Plasma was obtained by centrifugation of blood treated with the anticoagulant sodium heparin. Pooled plasma was prepared and stored at approximately -20ºC until needed.
Drug analysis
The blood samples were centrifuged at approximately 2000 g for 1 min at 4°C, and the decanted plasma stored at -20°C until assayed for hydroxocobalamin contents.
The extraction was performed by vortex-mixing 200 μL of each plasma sample, placed in glass tubes followed by the internal standard (50 μL of paracetamol at 1 μg/mL), with 1 mL of an organic solvent (ethanol 100%; -20°C) and vortexed for 40 s. The sample was centrifuged at 2000 g for 5 min. The upper organic phase was transferred to another set of clean glass tubes and evaporated until dry under N2 at 50°C. The dry residues were dissolved with 0.2 mL of acetonitrile/water (50/50; v/v)+10 mM ammonium acetate+0.1% of formic acid and vortexed for 10 s.
Chromatographic conditions
An aliquot (10 μL) of each plasma extract was injected into a Prevail C8 3 um, analytical column (2.1×100 mm i.d.). The compounds were eluted by pumping the mobile phase at a flow rate of 600 uL/min, and a post-column split (1:2) was introduced. Under these conditions, typical standard retention times were 1.55 min for hydroxocobalamin and 2.18 min for paracetamol, and back-pressure values of approximately 70 bar were observed. The temperature of the auto-sampler was maintained at 6ºC ± 2 and the run-time was 3.4 min.
The method requires an additional time (0.5 min) to inject a new sample since the auto sampler takes 0.5 min to inject a sample. This additional time allowed for finishing the equilibrium between injections. The mobile phase was acetonitrile:water (50:50 v/v) + 10 mM ammonium acetate + 0.1% formic acid.
Mass-spectrometric conditions
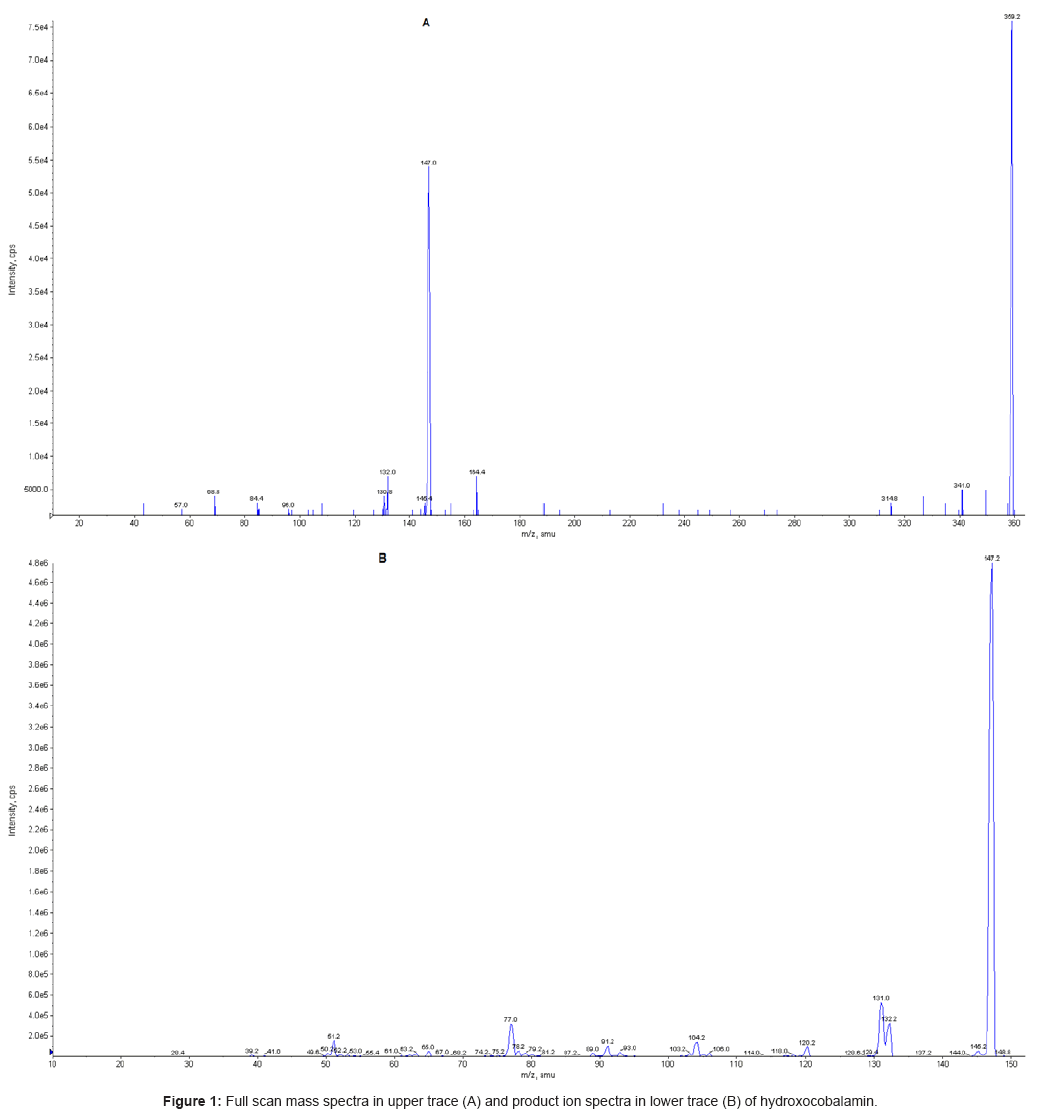
The mass spectrometer (API 4000) equipped with an electrospray source in positive mode (ES+), was set up in Multiple Reaction Monitoring (MRM), monitoring the transitions 359.20>147.10 and 152.00>110.00, for hydroxocobalamin and IS, respectively. Figure 1 shows the full scan spectra (upper trace) and the product ion spectra (lower trace) obtained for hydroxocobalmin. The source block temperature was set at 400°C and the turboionspray capillary voltage to 5.0 kV. For both hydroxocobalamin and internal standard, the following parameters optimized ?hydroxocobalmin?were obtained: for hydroxocobalamin the declustering potential, collision energy and collision exit potential were 139 (V), 29 (eV) and 12 (V), respectively. The corresponding values for internal standard were 66 (V), 23 (eV) and 8 (V), respectively. Data were acquired by Analyst software (1.4.1, Applied Biosystems, Foster City, CA, USA).
Method development
Linearity was determined to assess the performance of the method. A linear least-squares regression with a weighting index of 1/x2 was performed on the peak area ratios of hydroxocobalamin and IS vs. hydroxocobalamin concentrations of the eight plasma standards (5, 10, 20, 50, 100, 200, 300 and 400 ng/mL) in duplicate to generate a calibration curve.
The recovery was evaluated by dividing the extracted sample mean by the unextracted (spiked blank plasma extract residues) sample mean of the corresponding concentration. The matrix effect experiments were performed using the ratio between spiked mobile phase solutions and spiked plasma residues (drug-free plasma extracts).
There were performed 3 validations in time different. Each validation had 7 samples for limit of quantification and quality controls. Within- and between-run precision was determined as the relative standard deviation, RSD(%)=100(SD/M), where M is the mean, SD is the standard deviation of M. Accuracy was calculated as the percentage relative error, RE(%)=(E-T)(100/T), where E is the experimentally determined concentration and T is the nominal concentration.
Stability
Stability quality control plasma samples (15.0, 80.0 and 320.0 ng/ mL for hydroxocobalamin) were subjected to short-term (8 h 30 min) room temperature, three freeze/thaw (-20 to 25°C) cycles and 72 h 30 min auto-sampler stability (6°C). Subsequently, the hydroxocobalamin concentrations were measured compared to freshly prepared samples.
Clinical protocol
Twenty healthy volunteers of both sexes between 18 and 50 years of age and within 15% of the ideal body weight were selected for the study after having their health status previously assessed by clinical evaluation (physical examination, ECG) and the following laboratory tests: blood glucose, urea, creatinine, AST, ALT, alkaline phosphatase, -GT, total bilirubins, albumin and total proteins, triglycerides, total cholesterol, hemoglobin, hematocrit, total and differential white cell counts, and routine urinalysis. All subjects were negative for HIV, HCV and HBV (except for serological scar).
The study began and finished with 20 volunteers. The volunteers had the following clinical characteristics (according to gender and expressed as mean ± SD [range]): males: age: 32.40 ± 8.00 [23.00- 46.00], height: 1.73 ± 0.07 m [1.62-1.85], body weight: 72.48 ± 10.22 [60.20-88.00]; females: age: 28.60 ± 9.54 [18.00-44.00], height: 1.60 ± 0.05 [1.54-1.70], body weight: 58.64 ± 6.09 [51.70-66.70]. All subjects provided written informed consent and the State University of Campinas - Unicamp approved the clinical protocol. The study was conducted in accordance with the provisions of the Declaration of Helsinki (1964), Tokyo (1975), Venice (1983), Hong Kong (1989), Somerset West (1996) and Edinburgh (2000) revisions [8].
The study was a single dose (5000 μg, 2.5 mL) gluteal intramuscular administration. The volunteers were hospitalized at 05:00 p.m. and received specialized assistance and care, including a brief investigation of their conditions upon confinement and at time of discharge, in order to evaluate their adherence to the requirements of the clinical protocol. Standard meals were administered at 07:00 p.m. (dinner) and 10:00 p.m (snack). After an overnight fast (approximately 8 hours), they received at approximately 6:00 a.m. a dose (gluteal intramuscular) of alfa 5,6-dimethylbenzimidazolyl polypyrrolidone cobamide (Cronobê®) injectable solution (5000 μg, 2.5 mL). All volunteers were required to remain fasting for 2 hours after dose administration, when a xanthine-free standard breakfast was available. A xanthine-free standard lunch was provided after five (lunch), eight (afternoon snack), twelve (dinner) and fifteen (night snack) hours after dose. After the 24- hour blood withdrawal a standardized meal (breakfast) was served, and after a medical evaluation, volunteers were discharged and standard meal (lunch) of rice, beans, vegetables, and fried chicken plus a fruit as dessert was consumed. A morning, afternoon and evening snack was also provided consisting of crackers, bread, jelly, cakes and apples. No other food was permitted during the “in-house” period and liquid consumption was allowed ad libitum after lunch (with the exception of xanthine-containing drinks, including tea, coffee, and cola). At time intervals, systolic and diastolic arterial pressure (measured noninvasively with a sphygmomanometer), heart rate and temperature were recorded. Blood samples (7 mL) from a suitable antecubital vein were collected at 1, 2, 3, 4, 5, 6, 12, 18, 24, 48, 72, 96, 120, 144 and 168 post-dosing.
Formulation
The following formulation was employed: alfa 5,6-dimethylbenzimidazolyl polypyrrolidone cobamide injectable solution (Cronobê®) 2.000 μg/mL (2.5 mL) manufactured by Biolab Sanus Farmacêutica Ltda (lot N° 802615, expiration: Feb/2010).
Pharmacokinetic and statistical analysis
Non-compartmental analysis was also used to determine the pharmacokinetic parameters of cobalamin after the intramuscular administration. The Cmax and the time taken to achieve this concentration (Tmax) were obtained directly from the curves. The areas under the hydroxocobalamin plasma concentration vs. time curves from 0 to the last detectable concentration (AUClast) were calculated by applying the linear-log trapezoid rule [9]. Extrapolation of these areas to infinity (AUC0-inf) was done by adding the value Clast/ke to the calculated AUClast (where Clast=the last detectable concentration). Clearance (CL) was calculated by the formula dose/AUC0-inf. The AUC and CL were also calculated correcting the dose by weight (kg) and by surface area (m2) [10]. Cobalamin stability results were assessed for significance using Student’s t-test. The software used included WinNonLin Professional Network Edition (Pharsight, v. 5.3), Microsoft Excel (v. 7.0) and GraphPad Prism (v. 3.02).
Results and Discussion
This is the first HPLC-MS-MS method described for measuring hydroxocobalamin in biological fluids. The method was linear, calculating the calibration curve by a least-squares regression for hydroxocobalamin concentrations from 5 to 400 ng/mL (calibration curve equation: 0.0000136*x ± 0.000131, r=0.9983).
The recovery of hydroxocobalamin was 38.2%, 37.5% and 33.5% for the 15.0, 80.0 and 320.0 ng/mL standard concentrations, respectively. The recovery of the internal standard was 75.1% for 1000.0 ng/mL concentration. The matrix effect of hydroxocobalamin was -21.2%, -40.3% and -40.0% for the 15.0, 80.0 and 320.0 ng/mL standard concentrations, respectively. The matrix effect of the internal standard was -33.3% for 1000.0 ng/mL concentration. The limit of quantification (LOQ), defined as the lowest concentration at which both the precision and accuracy were ± 20%, was 5.0 ng/mL. The within- and between-run precision and accuracy (with and without internal standard) for the LOQ and QCs are summarized in table 1.
| Intra-batch validation (n=7) | |||||||||
| with IS | without IS | with IS | without IS | with IS | without IS | with IS | without IS | ||
| Nominal concentration (μg/mL) | 5.0 | 15.0 | 80.0 | 320.0 | |||||
| Arithmetic mean (ug/mL) | 5.4 | 5.1 | 15.0 | 14.9 | 79.2 | 78.0 | 316.9 | 295.9 | |
| Precision (CV%) | 9.6% | 9.2% | 8.9% | 8.2% | 1.0% | 1.8% | 2.8% | 1.5% | |
| Accuracy (%) | 108.9% | 101.1% | 99.9% | 99.3% | 98.9% | 97.5% | 99.0% | 92.5% | |
| Inter-batch (n=21) | |||||||||
| with IS | without IS | with IS | without IS | with IS | without IS | with IS | without IS | ||
| Nominal concentration (μg/mL) | 5.0 | 15.0 | 80.0 | 320.0 | |||||
| Arithmetic mean (ug/mL) | 5.1 | 4.7 | 15.6 | 15.1 | 82.6 | 81.3 | 319.0 | 307.1 | |
| Precision (CV%) | 9.4% | 10.9% | 6.9% | 6.4% | 4.6% | 5.0% | 5.5% | 6.2% | |
| Accuracy (%) | 101.9% | 94.4% | 104.1% | 101.2% | 103.2% | 101.6% | 99.7% | 96.0% | |
Table 1: Accuracy and precision data for hydroxocobalamin in human plasma.
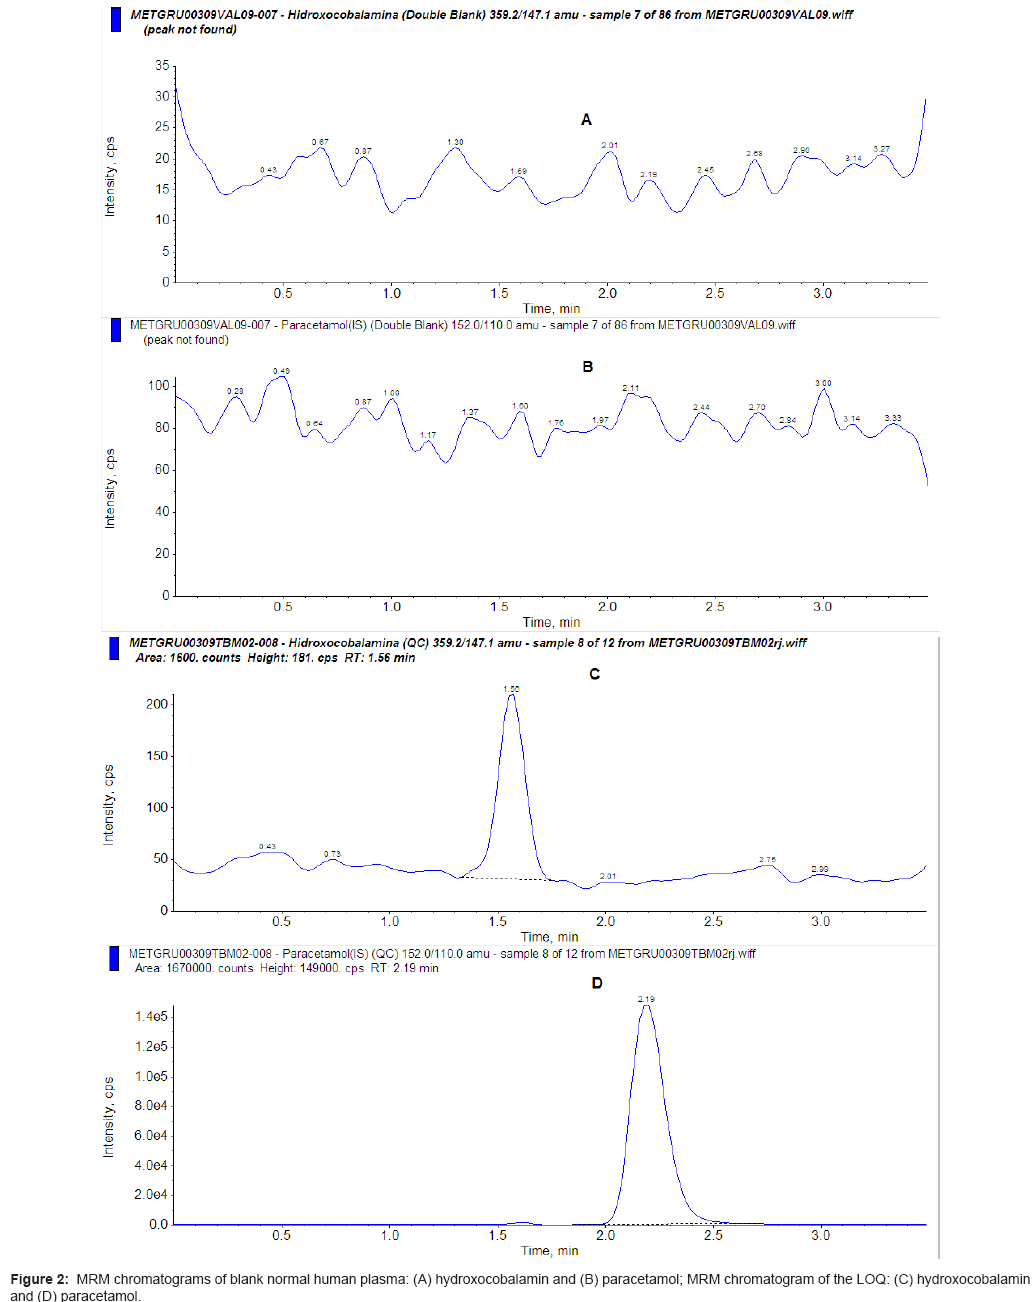
The stability tests (Table 2) indicated no significant degradation under the conditions described above. No endogenous peak was observed in the mass chromatogram of blank plasma. The mass chromatograms of a sample are shown in figure 2, in which the retention times of both hydroxocobalamin and paracetamol were 1.55 and 2.18, respectively.
| Post-processing stability test (ng/mL) | ||||||
| (n=5) | Reference values | Values after 72 h 30 min | Reference values | Values after 72 h 30 min | Reference values | Values after 72 h 30 min |
| Low sample | Medium sample | High sample | ||||
| Arithmetic Mean | 16.7 | 16.2 | 80.5 | 75.3 | 300 | 275 |
| CV (%) | 1.8 | 3.9 | 2.1 | 13.4 | 2.6 | 3.2 |
| Variation | -3,0 | -6.5 | -8.3 | |||
| Freeze-and-thaw stability test (ng/mL) | ||||||
| (n=5) | Reference values | Values after 3 cycles | Reference values | Values after 3 cycles | Reference values | Values after 3 cycles |
| Low sample | Medium sample | High sample | ||||
| Arithmetic Mean | 13.1 | 11.8 | 57.6 | 52.2 | 196 | 185 |
| CV (%) | 4.8 | 6.2 | 3.1 | 4.0 | 8.9 | 1.5 |
| Variation | -9.9 | -9.4 | -5.6 | |||
| Short-term stability test (ng/mL) | ||||||
| (n=5) | Reference values | Values after 8 h 30 min | Reference values | Values after 8 h 30 min | Reference values | Values after 8 h 30 min |
| Low sample | Medium sample | High sample | ||||
| Arithmetic Mean | 13.1 | 11.7 | 57.6 | 50.5 | 196 | 170 |
| CV (%) | 4.8 | 5.1 | 3.1 | 5.3 | 8.9 | 3.7 |
| Variation | -10.7 | -12.3 | -13.3 | |||
Table 2: Stability quality control plasma samples (15.0, 80.0 and 320.0 ng/mL for hydroxocobalamin) to short-term (8 h 30 min) room temperature, three freeze/thaw (-20 to 25°C) cycles and 72 h 30 min auto-sampler stability (6°C).
This is the first HPLC-MS-MS method developed for measuring hydroxocobalamin in human plasma. Hydroxocobalamin has been determined in human and rat plasma by isotopic dilution (LLOQ 34 pg/mL) [4,5], in nutritive supplements and chlorella foods by capillary electrophoresis-inductively coupled plasma mass spectrometry (LLOQ 200 pg/mL, run-time 11 min) [6] and in ovine tissues by high-performance liquid chromatography (LLOQ 34 pg/mL, runtime 10 min). Our method has good sensitivity (LLOQ of 5 ng/mL) for the objective of the study and can be carried out in a short time (RT of 1.55 min for hydroxocobalamin), permitting a high throughput. Furthermore, this method involves a very simple liquid-liquid extraction.
Internal standards are routinely used in bioanalytical methods and HPLC-MS-MS has enough selectivity to allow the use of deuterated standards (Table 3). However, these standards are expensive and not easily available. Thus, they are commonly replaced by structurally related compounds. Considering that the extraction procedures for HPLC-MS-MS bioanalysis are very simple (protein precipitation is routinely employed), one should ask whether the use of structurally related internal standard is really required or advisable. The method described above validated well without the use of the internal standard, similar to other method [11]. Whether this approach applies to other bioanalytical methods should be further investigated.
| Analyte | |||
|---|---|---|---|
| Low concentration | |||
| Std solution | Unextracted | Extracted | |
| 11900 | 9470 | 3530 | |
| 11700 | 9470 | 3540 | |
| 11500 | 10000 | 3220 | |
| 12000 | 8180 | 3570 | |
| 11100 | 8750 | 3650 | |
| Mean | 11640 | 9174 | 3502 |
| CV (%) | 3.1 | 7.8 | 4.7 |
| Recovery | 38.2 | ||
| Matrix Effect | -21.2 | ||
| Medium concentration | |||
| Std solution | Unextracted | Extracted | |
| 68800 | 44800 | 16400 | |
| 66700 | 41700 | 16400 | |
| 73300 | 43800 | 16300 | |
| 66900 | 42000 | 16000 | |
| 86600 | 44000 | 16100 | |
| Mean | 72460 | 43260 | 16240 |
| CV (%) | 11.5 | 3.1 | 1.1 |
| Recovery | 37.5 | ||
| Matrix Effect | -40.3 | ||
| High concentration | |||
| Std solution | Unextracted | Extracted | |
| 289000 | 180000 | 60600 | |
| 289000 | 178000 | 60400 | |
| 268000 | 176000 | 58200 | |
| 289000 | 177000 | 59300 | |
| 337000 | 172000 | 57000 | |
| Mean | 294400 | 176600 | 59100 |
| CV (%) | 8.7 | 1.7 | 2.6 |
| Recovery | 33.5 | ||
| Mattrix Effect | -40.0 | ||
Table 3: Matrix effect between spiked mobile phase solutions and unextracted samples, spiked on plasma residues for analyte and internal standard.
As demonstrated in this study, the present HPLC-MS-MS method is simple and selective for the determination of hydroxocobalamin in human plasma, thus it can be used for pharmacokinetic and bioequivalence studies of hydroxocobalamin.
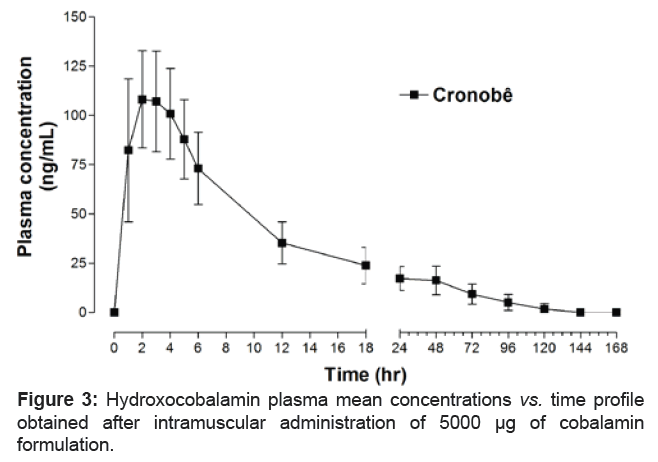
The cobalamin was well tolerated and no significant adverse reactions were observed or reported. The mean hydroxocobalamin plasma concentrations vs. time profiles after intramuscular dose (5000 μg) of cobalamin are shown in figure 3, respectively. Table 4 shows the mean pharmacokinetic parameters obtained from 20 volunteers after the administration of 5000 μg cobalamin.
| Parameter | Unit | N | Mean | SD | Min | Median | Max | CV% |
|---|---|---|---|---|---|---|---|---|
| AUCinf | ([ng*hr]/mL) | 20 | 2467 | 765 | 839 | 2632 | 3496 | 30.99 |
| AUClast | ([ng*hr]/mL) | 20 | 2044 | 641 | 729 | 2249 | 3218 | 31.36 |
| Clast | (ng/mL) | 20 | 7.74 | 3.20 | 5.13 | 6.62 | 19.30 | 41.26 |
| Cmax | (ng/mL) | 20 | 119.49 | 25.09 | 71.70 | 119.50 | 177.00 | 21.00 |
| Ke | (1/hr) | 20 | 0.02 | 0.01 | 0.01 | 0.02 | 0.06 | 60.21 |
| T1/2 | (hr) | 20 | 38.08 | 15.88 | 12.10 | 40.65 | 71.47 | 41.69 |
| Tlast | (hr) | 20 | 90.00 | 24.47 | 48.00 | 96.00 | 120.00 | 27.19 |
| Tmax | (hr) | 20 | 2.65 | 1.23 | 1.00 | 2.50 | 6.00 | 46.26 |
| Vd | (L) | 20 | 111.71 | 33.42 | 54.68 | 114.00 | 164.42 | 29.91 |
| CL | (L/hr) | 20 | 2.34 | 1.14 | 1.43 | 1.90 | 5.96 | 48.96 |
Table 4: Mean pharmacokinetic parameters obtained from 20 volunteers after administration of cobalamin formulation.
As expected, the mean hydroxocobalamin pharmacokinetic parameter for t1/2 (38.08 ± 15.88 hr) was higher than intravenous administration of cobalamin. (dose 2.5 g, t1/2=30.3 ± 2.4 hr; dose 5 g, t1/2=30.2 ± 6.7 hr; dose 7.5 g, t1/2=27.5 ± 2.5 hr; dose 10 g, t1/2=25.9 ± 2.7 hr). No pharmacokinetic study has been performed comparing the influence of gender of the volunteer/patients [12].
After intramuscular administration of the cobalamin 5000 ug to the volunteers, the AUC and Cl differ markedly by gender after administration of cobalamin 5000 μg. As, shown in the figure 4, the female volunteers presented significant (p=0.0136) lower AUC (1706 ± 704 ng.hr/mL) and larger (p=0.0205) clearance (2.91 ± 1.41 L/hr) as compared to male volunteers for AUC (2383 ± 343 ng.hr/mL) and clearance (1.76 ± 0.23 L/hr), respectively. The differences were present even the dose was corrected by either weight or body surface of the volunteer (Table 5). These pharmacokinetic differences could explain the higher prevalence of vitamin B12 deficiency in female patients [9].
| Male (Mean ± SD) | Female (Mean ± SD) | t-test | |
|---|---|---|---|
| AUC ([ng*hr]/mL) | 2382.96 ± 343.05 | 1705.59 ± 703.65 | 0.0136 |
| corrected by weight (ug/kg) | 34.07 ± 3.00 | 19.93 ± 8.18 | 0.0001 |
| corrected by BSA (ug/m2) | 0.88 ± 0.08 | 0.54 ± 0.21 | 0.0002 |
| CL (L/hr) | 1.76 ± 0.23 | 2.91 ± 1.41 | 0.0205 |
| corrected by weight (L/hr*kg) | 0.03 ± 0.003 | 0.06 ± 0.028 | 0.0036 |
| corrected by BSA (L/hr*m2) | 1.14 ± 0.09 | 2.14 ± 0.94 | 0.0036 |
Table 5: Average, SD and T-Test comparing clereance (CL) and AUClast against body surface area (BSA; m2) and weight (kg).
Acknowledgements
The pharmacokinetic study was paid by Biolab Sanus Farmacêutica Ltda. Gilberto De Nucci is a visiting professor at Department of Clinical Pharmacy, College of Pharmacy, King Saud University, Riyadh, Saudi Arabia.
References
- Butler CC, Vidal-Alaball J, Cannings-John R, McCaddon A, Hood K, et al. (2006) Oral vitamin B12 versus intramuscular vitamin B12 for vitamin B12 deficiency: a systematic review of randomized controlled trials. Fam Pract 23: 279-285.
- Kuzminski AM, Del Giacco EJ, Allen RH, Stabler SP, Lindenbaum J (1998) Blood 92: 1191.
- van Asselt DZ, Merkus FW, Russel FG, Hoefnagels WH (1998) Nasal absorption of hydroxocobalamin in healthy elderly adults. Br J Clin Pharmacol 45: 83-86.
- Van den Berg MP, Merkus P, Romeijn SG, Verhoef JC, Merkus FW (2003) Hydroxocobalamin uptake into the cerebrospinal fluid after nasal and intravenous delivery in rats and humans. J Drug Target 11: 325-331.
- Merkus P, Guchelaar HJ, Bosch DA, Merkus FW (2003) Neurology 6: 1669.
- Chen JH, Jiang SJ (2008) Determination of cobalamin in nutritive supplements and chlorella foods by capillary electrophoresis-inductively coupled plasma mass spectrometry. J Agric Food Chem 56: 1210-1215.
- Kelly RJ, Gruner TM, Sykes AR (2005) Development of a method for the separation of corrinoids in ovine tissues by HPLC. Biomed Chromatogr 19: 329-333.
- Rosin H, Man WY, Doyle E, Bult A, Beijnen JH (2000) J Liq Chromatogr and Related Tech 23: 329.
- Wang YH, Yan F, Zhang WB, Ye G, Zheng YY, et al. (2009) Neurosci Bull 25: 209.
- DuBois D, DuBois EF (1916) Arch Intern Med 17: 862.
- Mendes FD, Chen LS, Borges A, Babad?pulos T, Ilha JO, et al. (2011) Ciprofibrate quantification in human plasma by high-performance liquid chromatography coupled with electrospray tandem mass spectrometry for pharmacokinetic studies. J Chromatogr B Analyt Technol Biomed Life Sci 879: 2361-2368.
- Uhl W, Nolting A, Gallemann D, Hecht S, Kovar A (2008) Changes in blood pressure after administration of hydroxocobalamin: relationship to changes in plasma cobalamins-(III) concentrations in healthy volunteers. Clin Toxicol (Phila) 46: 551-559.
Copyright: © 2013 Mendes GD, et al. This is an open-access article distributed under the terms of the Creative Commons Attribution License, which permits unrestricted use, distribution, and reproduction in any medium, provided the original author and source are credited.
