
Indexed In
- Open J Gate
- Genamics JournalSeek
- JournalTOCs
- China National Knowledge Infrastructure (CNKI)
- Electronic Journals Library
- RefSeek
- Hamdard University
- EBSCO A-Z
- OCLC- WorldCat
- SWB online catalog
- Virtual Library of Biology (vifabio)
- Publons
- MIAR
- Euro Pub
- Google Scholar
Useful Links
Share This Page
Journal Flyer
Open Access Journals
- Agri and Aquaculture
- Biochemistry
- Bioinformatics & Systems Biology
- Business & Management
- Chemistry
- Clinical Sciences
- Engineering
- Food & Nutrition
- General Science
- Genetics & Molecular Biology
- Immunology & Microbiology
- Medical Sciences
- Neuroscience & Psychology
- Nursing & Health Care
- Pharmaceutical Sciences
Research Article - (2023) Volume 14, Issue 4
Health Risk Assessment and Statistical Modeling of Toxic Metals in Groundwater of Lahore, Pakistan
Iqra Khalid*Received: 29-Mar-2023, Manuscript No. JPEB-23-20456; Editor assigned: 31-Mar-2023, Pre QC No. JPEB-23-20456 (PQ); Reviewed: 14-Apr-2023, QC No. JPEB-23-20456; Revised: 30-May-2023, Manuscript No. JPEB-23-20456 (R); Published: 06-May-2023, DOI: 10.35248/2157-7463.23.14.527
Abstract
The groundwater of Lahore is now in great concern due to heavy metal pollution. That's why; carcinogenic and noncarcinogenic health risk assessment of the consumption of groundwater is currently needed. The objective of this research is to determine the heavy metals concentration in groundwater and to evaluate its potential health risks for the lifetime of exposure for residents using the USEPA model and probabilistic technique (monte carlo simulation).
The groundwater samples were collected from selected sampling sites of the study area and analyzed for physicochemical parameters, and heavy metals. Descriptive statistics showed that the mean concentration of Pb (0.77), Cr (1.828), and Ni (0.35) were higher than PEQS standards for drinking water while values of other parameters were within guidelines. The results of descriptive statistics and box whisker plots showed most of the data showed an un-symmetrical distribution of the parameters. Pearson correlation matrix showed that heavy metals correlate with physicochemical parameters. ANOVA results also supported the Pearson correlation matrix. The findings of PCA and CA identified the possible sources of pollution, i.e. Industrial discharges, landfill leachates, sewage effluent discharges, and leakage from sewers. EF was calculated with a reference metal i.e. Ca and the trend observed was Pb>Cr>Ni>Mg>As>Zn. Based on the total hazard quotient (HQing+HQder) the trend of heavy metals was found Cr>Pb>As>Ni>Zn for children, adult males, and adult females. The hazard index values (upto 79.12), (75.25), and (59.42) were calculated for children, adult males and, adult females respectively which showed high probability of non-carcinogenic risks. The Hazard Quotient (HQs) values for children (upto 57.89), for adult males (upto 55.18) and adult females (upto 45) were greater one (>1) for Cr, Pb, Ni and as, which indicates a significant non-cancer risk. Similarly, the cancer risk trend observed was of the order of Cr>Ni>As>Pb. While the cancer risk assessment has shown that 25 people could have carcinogenic effects of each 100 population. By monte carlo simulation, the Cancer risk trend observed was Cr>Ni>As>Pb for all age groups. The total hazard quotient trend observed was Cr>Pb>As>Ni>Zn which suggested that Cr has high probability of health risks in this study area.
Keywords
Heavy metals; Lahore; Groundwater; Correlation; Statistical modeling; Health risk assessment; Monte carlo simulation; Uncertainty analysis
Introduction
In fact, Life without water is beyond the realm of imagination. Clean potable water is a critical right of every individual. In underdeveloped nations, the essential needs of human life are not met mostly [1]. Likewise, Pakistan is included in underdeveloped countries, wherein most of the public are living without clean drinking water. Groundwater is the most important source of drinking water and offers around 50% of the World’s drinking water. Groundwater is generally regarded free of contamination, but its quality is declining owing to the anthropogenic and natural conditions. However, due to soil’s natural puriï¬cation characteristics groundwater is thought to be cleaner than surface water [2].
Gelogenic and Anthropogenic sources can lead to deterioration of groundwater. Natural sources can result due to chemical weathering of minerals and leaching (mariano). The fast industrialization and urbanization followed by unregulated and unplanned waste discharge Chabukdhara, et al; Chowdhury, et al; and Izah, et al. intensive farming methods Chabukdhara, et al.; Chowdhury, et al.; and Izah et al. seepage and percolation through highly contaminated locations Chabukdhara, et al.; Chowdhury, et al. discharges of industrial and municipal effluents into the land Chowdhury, et al.; Izah, et al. mining of ore, Mariano, et al.; Masok, et al.; and Maleka, et al. and smelting of metals (mariano) are anthropogenic activities which have caused heavy metal contamination in groundwater [3]. Geologically, whether they are abundantly present in the crust of earth or the residues surrounding the aquifer, these heavy metals come into groundwater; whereas heavy metals from anthropogenic sources go to groundwater by solubilizing in water in the form of ions from rainfall or drainage which eventually enters groundwater [4].
Heavy metal pollution of ground water is a critical public health risk concern for a long time globally. High concentrations of heavy metals can contaminate the water quality and cause significant cancer and non-cancer risks to the health of human owing to their persistent, bio accumulative and toxic nature. Some of the metals are necessary for the growth and functions of living organisms in traces, but exposure to greater amounts and for longer duration are harmful for human health [5]. These trace heavy metals enter the human system via daily intake and dermal absorption through skin.
The health risk assessments by exposure of increased heavy metals are reported by many researchers. In groundwater, the pollution of heavy metals is irreversible, hidden and continual. Heavy metals contamination endangers health and welfare of people via food series [6]. This study is conducted to assess the health risks due to heavy metals in groundwater through drinking water ingestion and dermal exposure through skin. monte carlo simulation was done to reduce the uncertainties in Risk Assessment. Different statistical tools for example Pearson correlation matrix, ANOVA, PCA, and CA were used for correlation and identification of possible contamination sources of physicochemical parameters and heavy metals in groundwater [7].
Materials and Methods
Mughalpura and Baghbanpura is commercial as well as industrial and residential area. Mughalpura is situated on Lahore's eastern side, near the southern canton of Lahore, in the northern part of Baghbanpura, along the famous Lahore Canal. The google map showing the locations of sampling points and groundwater pollution sources in this study area is shown in Figure 1. There are a number of large and small scale industries present in this study area [8]. There is a Pakistan mint industry (1 km) from study area. It was founded in 1942 and still has been in operations. Pakistan mint has been manufacturing coins and currency for the state but also medals and awards for the military armed forces. There is also a waste water/solid waste disposal point (1-2 km) away from study area. The largest railway workshop of Asia is also present in this area since 1912. There are a number of small industries like auto workshops, rewinding workshops, railway servicing workshops in this area [9]. Besides that, wastewater drains (5-6 ft deep) are passing in this area, these all can be major sources of ground water pollution of aquifer. So, with the collaboration of WASA Lahore twenty sites were identified [10].
Sampling and analysis
In this Research, two areas (Baghbanpura and Mughalpura) of Lahore were selected for statistical modeling of groundwater quality and health risk assessment. Twenty grab ground water samples were collected from different tube wells with the collaboration of Water and Sanitation Agency (WASA), Lahore. The details of sampling locations are given in Table 1. Three groundwater samples were collected from each tube well at weekly interval l [11]. So, the total samples were sixty. The groundwater sampling was done using the methods described by American Public Health Association (APHA, 2005). Prior to collection the wells have been pumped sufficiently (10 min) in order to ensure that it represents the fresh water. Prior to collection; the polythene plastic bottles (1.5 liters capacity) were thoroughly washed. The collected samples were tagged in a proper manner and a record was made ready. The collected samples were transported to laboratory for analysis pollution of aquifer (Figure 1). So, with the within 24 hours. Samples were analyzed for different physiochemical parameters, and heavy using standard procedures and AAS respectively. All analytical procedures described in this study were consistently following recommendations by the American public health association, in accordance with the standard methods for the examination of water and wastewater [12]. For statistical modeling, IBM SPSS (version 20) software was applied to carry out the descriptive statistics, pearson’s correlation matrix, Analysis of Variance (ANOVA), principle component analysis and cluster analysis (Dendograms). For health risk assessment using monte carlo simulation, minitab (version 17) was used. A questionnaire survey was conducted from random houses of Study area and requested to finish questionnaires. Face to face interviews were conducted with the 100 respondents to collect the drinking water ingestion and dermal exposure related information [13].
Table 1: Locations of tube wells, the sample symbols.
| Location | Symbol | No. of samples |
|---|---|---|
| Government (boys) high school, Baghbanpura | TW-1 | 3 |
| Shalimar town, Baghbanpura | TW-2 | 3 |
| Street no 12, Muhammad Deen colony, Baghbanpura | TW-3 | 3 |
| Peer Sher Shah Darbar, Baghbanpura | TW-4 | 3 |
| Darse road, Baghbanpura | TW-5 | 3 |
| Bagheechi Sethan, Mughalpura | TW-6 | 3 |
| Suriya Jabeen park, Baghbanpura | TW-7 | 3 |
| Gosha e Anghoori, Mughalpura | TW-8 | 3 |
| Angori Bagh scheme-II, Mughalpura | TW-9 | 3 |
| Takia Sahowari, Mughalpura | TW-10 | 3 |
| Sunny View park, Mughalpura | TW-11 | 3 |
| Shah Kamal road, Mughalpura | TW-12 | 3 |
| Esaa abad, Mughalpura | TW-13 | 3 |
| Baba Bari Peer, Mughalpura | TW-14 | 3 |
| Baja line, Mughalpura | TW-15 | 3 |
| Masjid Taj Din, Mughalpura | TW-16 | 3 |
| Engine shed, Mughalpura | TW-17 | 3 |
| Achanat garh, Mughalpura | TW-18 | 3 |
| Mian park, Mughalpura | TW-19 | 3 |
| Sansi quarters, Mughalpura | TW-20 | 3 |

Figure 1: Google map showing the sampling points and groundwater pollution sources.
Results and Discussion
Descriptive analysis
For descriptive statistics, mean, variance, standard deviation, median, skewness, and kurtosis has been computed. The results of the descriptive analysis for all groundwater samples have been demonstrated in Table 2. The average values of pH, turbidity, chlorides, sulfates, total hardness, calcium hardness, and magnesium hardness were within the PEQS guideline values. The average values of Pb, Cr, and Ni exceeded the PEQS values [14]. The parameters for which PEQS values are not available like electrical conductivity, sulfates, calcium ion (Ca+2), and magnesium ion (Mg+2). They are compared with WHO guidelines. So, the mean values of electrical conductivity and magnesium ion were greater than WHO guideline values Table 2.
Table 2: Descriptive statistics for all parameters analyzed in groundwater.
| Parameters | Range | Minimum | Maximum | Mean | Std. deviation | Variance | Skewness | Kurtosis | PEQS |
|---|---|---|---|---|---|---|---|---|---|
| pH | 1.2 | 6.7 | 7.9 | 7.398 | 0.27 | 0.076 | -0.431 | -0.431 | 6.5-8.5 |
| Elec. cond. (µS) | 1010 | 450 | 1460 | 681.17 | 218.33 | 47668.1 | 1.94 | 4.02 | 50-500* |
| Turbidity (NTU) | 35.56 | 0.14 | 35.7 | 1.76 | 5.2 | 27.04 | 5.47 | 32.72 | <5 |
| Chlorides (ppm) | 65.07 | 0 | 65.08 | 20.55 | 14.74 | 217.14 | 1.56 | 2.18 | <250 |
| Sulfates (ppm) | 76.86 | 1.714 | 78.57 | 20.24 | 15.2 | 230.4 | 2.67 | 7.55 | 500* |
| Total hardness (ppm) | 520 | 56 | 576 | 160.17 | 102.03 | 10409.5 | 2.31 | 6 | <500 |
| Calcium hardness (ppm) | 150.7 | 9.62 | 160.32 | 35.7 | 25.8 | 665.92 | 2.83 | 10.25 | - |
| Magnesium hardness (ppm) | 373.3 | 42.38 | 415.68 | 124.47 | 78 | 6085.24 | 2.09 | 4.62 | - |
| Lead (ppm) | 1.95 | 0 | 1.95 | 0.78 | 0.62 | 0.39 | 0.17 | -1.29 | ≤ 0.05 |
| Chromium (ppm) | 2.9 | 0.24 | 3.14 | 1.83 | 0.94 | 0.89 | -0.13 | -1.57 | ≤ 0.05 |
| Nickel (ppm) | 0.72 | 0.04 | 0.76 | 0.35 | 0.17 | 0.028 | 0.241 | -0.253 | ≤ 0.02 |
| Arsenic (ppm) | 0.04 | 0.0001 | 0.037 | 0.017 | 0.0142 | 0 | 0.012 | -1.507 | ≤ 0.05 |
| Calcium (Ca++) | 60.28 | 3.8477 | 64.12 | 14.23 | 10.32 | 106.55 | 2.83 | 10.25 | 75* |
| Magnesium (Mg++) | 90.34 | 10.25 | 100.59 | 30.12 | 18.88 | 356.38 | 2.1 | 4.62 | 30* |
| Zinc (ppm) | 0.037 | 0 | 0.037 | 0.003 | 0.0064 | 0 | 3.14 | 12.44 | 5 |
The skewness values (close to zero) indicate that the parameters are symmetrical distributed. While the higher skewness values showed un-symmetrical distribution of parameters. pH, Pb, Cr, Ni, and As showed symmetrical distribution while the rest of the data showed non-symmetrical distribution. Similarly spatial distribution map for heavy metals As, Cr, Pb, Ni and Zn in groundwater of the study area is shown in Figure 8.
Box and whisker plots: For the analysis of the distribution patterns of the studied parameters, the box and whisker plots were used. In the box and whisker graph, the data is symmetrical if the median is evenly divided and if the median is to be right or left of the plots, the data is asymmetrical or skewed. The Figure 2 showed the results of the plot of box and whisker for physical and heavy metals. The graph shows that data is not normally distributed and a lot of un-symmetry is present in data. The pH and chromium values showed negatively skewed while skewness values for other parameters are positive. Overall, there is a little symmetry in the data.

Figure 2: Box and Whisker plots for all parameters.
Pearson correlation coefficient: The pearson correlation identifies the linear correlation between two variables. The strength of correlation is determined by the magnitude of the correlation coefficient [15]. The results of the pearson correlation coefficient are shown in Table 3.
Table 3: Pearson correlation matrix for all parameters in groundwater.
| pH | E cond. | Turb | Cl-1 | SO42- | Total hard | Ca hard | Mg hard | Pb | Cr | Ni | As | Ca | Mg | Zn | |
|---|---|---|---|---|---|---|---|---|---|---|---|---|---|---|---|
| pH | 1 | ||||||||||||||
| E cond. | -0.33 | 1 | |||||||||||||
| Turb | -0.57** | 0.68** | 1 | ||||||||||||
| Cl-1 | 0 | 0.39 | 0.08 | 1 | |||||||||||
| SO42- | -0.56** | 0.79** | 0.90** | 0.15 | 1 | ||||||||||
| Total Hard | -0.51* | 0.95** | 0.80** | 0.33 | 0.87** | 1 | |||||||||
| Ca Hard | -0.50* | 0.93** | 0.78** | 0.32 | 0.84** | 0.99** | 1 | ||||||||
| Mg Hard | -0.51* | 0.95** | 0.80** | 0.33 | 0.87** | 1.00** | 0.98** | 1 | |||||||
| Pb | 0.09 | -0.03 | 0.27 | -0.50* | 0.15 | 0.04 | 0.08 | 0.02 | 1 | ||||||
| Cr | -0.01 | 0.12 | -0.05 | 0.09 | 0.19 | 0.08 | 0.07 | 0.08 | 0.13 | 1 | |||||
| Ni | 0.15 | -0.12 | -0.15 | 0.56** | -0.13 | -0.15 | -0.18 | -0.14 | -0.43 | 0.06 | 1 | ||||
| As | 0.01 | 0.4 | 0.07 | 0.14 | 0.26 | 0.44 | 0.43 | 0.45 | -0.12 | 0.04 | -0.01 | 1 | |||
| Ca | -0.50* | 0.93** | 0.78** | 0.32 | 0.84** | 0.99** | 1.00** | 0.98** | 0.08 | 0.07 | -0.18 | 0.43 | 1 | ||
| Mg | -0.51* | 0.95** | 0.80** | 0.33 | 0.87** | 1.00** | 0.98** | 1.00** | 0.02 | 0.08 | -0.14 | 0.45 | 0.98** | 1 | |
| Zn | -0.37 | -0.05 | 0.28 | -0.14 | 0.23 | 0.07 | 0.06 | 0.08 | 0.19 | -0.26 | -0.26 | 0.05 | 0.06 | 0.08 | 1 |
In the pearson correlation matrix, pH, electrical conductivity and turbidity showed a strong correlation with chlorides, sulfates, total hardness, calcium hardness, magnesium hardness. Sulfates and total hardness showed a strong correlation with calcium hardness, magnesium hardness, calcium ion, and magnesium ion. Similarly moderate correlations were observed among heavy metals i.e. Pb-Ni, Cr-Ni, Pb-Cr. This indicates that these metals have the same source.
Analysis of variance
Analysis of Variance (ANOVA) was performed to test null hypothesis. ANOVA was performed at the alpha value (α=0.05). For this, a null Hypothesis (Ho) was formulated i.e. physicochemical parameters do not correlate with heavy metals. ANOVA gives the results in the form of F statistics and its associated level of significance [16]. The F is obtained by dividing the Mean Square between groups (MS between) by Mean Square within groups (MS within).
The results of ANOVA showed that the null hypothesis is failed to reject for Ca++ and Mg++ as the significance level is less than α=0.05 value. The physicochemical parameters do not correlate with calcium and magnesium ions. Similarly, Nickel doesn’t correlate with chlorides and turbidity. While null hypothesis is rejected for other heavy metals as the significance level is greater than α=0.05 value [17]. The heavy metals do correlate with physiochemical parameters these correlations showed that heavy metals are present in groundwater in the form of salts (i.e. chlorides and sulfates), which indicated human activities are sources for heavy metal pollution in groundwater. The results are shown in Table 4.
Table 4: ANOVA for all parameters in groundwater.
| pH | EC | Turbidity | Chlorides | Sulfates | Total hardness | Ca hardness | Mg hardness | |||||||||
|---|---|---|---|---|---|---|---|---|---|---|---|---|---|---|---|---|
| F | Sig. | F | Sig. | F | Sig. | F | Sig. | F | Sig. | F | Sig. | F | Sig. | F | Sig. | |
| Pb | 0.789 | 0.659 | 1.054 | 0.451 | 1.63 | 0.19 | 1.62 | 0.102 | 1.321 | 0.223 | 0.941 | 0.589 | 1.111 | 0.418 | 0.877 | 0.673 |
| Cr | 0.666 | 0.774 | 0.602 | 0.916 | 0.91 | 0.617 | 0.939 | 0.538 | 1.212 | 0.296 | 1.457 | 0.244 | 0.683 | 0.846 | 0.826 | 0.694 |
| Ni | 0.542 | 0.876 | 0.927 | 0.588 | 3.21 | 0.02 | 2.208 | 0.019 | 0.795 | 0.708 | 1.29 | 0.328 | 0.908 | 0.615 | 1.051 | 0.608 |
| As | 1.112 | 0.373 | 0.88 | 0.64 | 1.11 | 0.451 | 0.601 | 0.872 | 1.055 | 0.43 | 1.188 | 0.391 | 0.689 | 0.84 | 2.66 | 0.312 |
| Ca+2 | 8.552 | 0 | 32.16 | 0 | 8.07 | 0 | 2.49 | 0.008 | 7.765 | 0 | 10.23 | 0 | 11661 | 0 | 0 | 0 |
| Mg+2 | 7.75 | 0 | 29.74 | 0 | 2.65 | 0.041 | 2.934 | 0.002 | 7.696 | 0 | 95.6 | 0 | 13.4 | 0 | 0 | 0 |
| Zn | 0.471 | 0.922 | 0.54 | 0.953 | 0.43 | 0.975 | 0.383 | 0.982 | 0.692 | 0.814 | 1.24 | 0.358 | 0.594 | 0.917 | 0.397 | 0.911 |
Principal component analysis
PCA is performed to convert the original variables into new, unconnected variables (axes), known as principal components, that are linear combinations of the original variables. PCA is based on an imaginary eigen value. In this case eigen value is considered 1. The eigenvalue-one criterion shows that principal components having eigenvalues more than one are considered as significant and are grouped based on same source [18]. The components having eigen values less than 1 are ignored. The varimax and Kaiser rotational method of PCA was used and the results are illustrated in Table 5. The tool was utilized on all the parameters for source identification. The PCA gave four components named PC1, PC2, PC3, and PC4 explaining a total variance of 77.65%. PC 1 explained 51.59% of the total variance; PC2 explained 10.71%; PC3 explained 8.25% and PC4 explained 7.09%. PC1 expressed the highest loading for pH, conductivity, turbidity, chlorides, sulfates, total hardness, calcium hardness, magnesium hardness, Ca+2, Mg+2, and total dissolved solids. So the source of these parameters are geogenic releases i.e. dissolution of rocks [19]. PC 2 showed the highest loading for “Pb” (0.667), “Cr” (0.687), and “Ni” (-0.737). The sources of Ni and Cr may be industrial waste discharges, as well as mafic and ultramafic rock erosion, and weathering of rock. Pb is used in various industrial applications, for example cable sheathing and pigments used for battery recycling. PC3 showed maximum loading for “Zn” and PC4 showed maximum loading for “As”.
Table 5: Principal component analysis for all parameters.
| Rotated component matrix a | ||||
|---|---|---|---|---|
| 1 | 2 | 3 | 4 | |
| pH | -0.65 | 0.014 | 0.298 | 0.279 |
| Elec. cond. (µS) | 0.959 | 0.026 | 0.116 | 0.017 |
| Turbidity (NTU) | 0.756 | 0.153 | -0.255 | 0.133 |
| Chlorides (mg/L) | 0.552 | -0.321 | 0.465 | -0.144 |
| Sulfates (ppm) | 0.854 | 0.142 | -0.13 | -0.129 |
| Total hardness (mg/L) | 0.988 | 0.073 | 0.043 | 0.004 |
| Calcium hardness(mg/L) | 0.944 | 0.124 | -0.005 | 0.026 |
| Magnesium hardness (mg/L) | 0.98 | 0.055 | 0.058 | -0.004 |
| Lead (ppm) | 0.086 | 0.667 | 0.253 | -0.077 |
| Chromium (ppm) | 0.079 | 0.687 | -0.033 | -0.016 |
| Nickel (ppm) | -0.092 | -0.737 | 0.151 | -0.028 |
| Arsenic (ppm) | 0.01 | -0.056 | -0.021 | 0.968 |
| Calcium (Ca++) | 0.944 | 0.124 | -0.005 | 0.026 |
| Magnesium (Mg++) | 0.98 | 0.055 | 0.058 | -0.004 |
| Zinc (ppm) | 0.108 | -0.064 | -0.87 | -0.013 |
| Eigenvalue | 7.74 | 1.6 | 1.24 | 1.06 |
| Variance | 51.59 | 10.71 | 8.25 | 7.09 |
Cluster analysis
Cluster Analysis (CA) belongs to a wide range of statistical techniques whose primary aim is to classify large data into clusters based on similarities within the group or differences between groups. The resulting groups, therefore, resemble each other but differ from other groups. The correlation among parameters using dendrogram was carried out at all twenty locations with average values of parameter, as shown in Figure 3. Four groups were formed by cluster analysis i.e. G1, G2, G3, and G4. As, Zn Ni, Pb, turbidity, Cr, pH, chlorides, sulfates, calcium, calcium hardness, and magnesium formed a single group (G1), Euclidean distance was lower therefore it showed a strong relationship as can be seen in Figure 3. Total hardness and magnesium hardness formed another group (G2), Euclidean distance was more therefore it showed a weak relationship. The third group (G3) was formed by G1 and (G2) relation was not too strong. G3 and electrical conductivity formed G4, Euclidean distance was large which indicated different sources of pollution Figure 3. The results from CA supported the results of PCA which provide insights into their potential sources. The sources of Pb, Ni, and Cr may be anthropogenic activities i.e. seepage from industrial activities, landfill leachates, sewage effluent discharges, and leakage from sewers as shown in Figure 1 for the study area. So, CA identified gelogenic and various anthropogenic sources for enhanced levels of HMs in the groundwater [20]. These gelogenic sources include dissolution of rocks and anthropogenic sources include seepage from industrial discharges, landfill leachates, and sewage effluent discharges, and leakage from sewers as can be seen in Figure 1.

Figure 3: Cluster analysis for all parameters.
Enrichment Factor (EF)
Enrichment Factor (EF) is used in general for identifying the geogenic/anthropogenic sources of the metals, and for determining the level of metal contamination. The formula for enrichment factor is as follows:
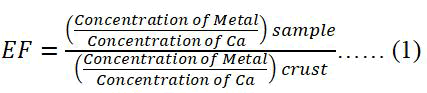
The EF technique normalizes the heavy metal content in sample measured in relation to a reference metal like Ca. The EF values of Cr, Pb, Ni, As, Mg, Ca, and Zn taking average Ca as a reference is calculated. All EF values of heavy metals are shown in Table 6 and in Figure 4. The values of Pb are found to be >100 strongly supporting anthropogenic activities to be the sources of Pb in the groundwater. These anthropogenic activities include seepage from industrial discharges, landfill leachates, and sewage effluent discharges. The order of the Enrichment factor was observed as Pb>Cr>As>Ni>Mg>Zn.
Table 6: EF values for all heavy metals.
| Metals | Week 1 | Week 2 | Week 3 |
|---|---|---|---|
| Cr | 51.94 | 54.4 | 49.7 |
| Pb | 150.19 | 167.9 | 164.1 |
| Ni | 14.13 | 9.96 | 13.01 |
| As | 60 | 25.75 | 0.3 |
| Mg | 3.77 | 3.76 | 3.72 |
| Ca | 1 | 1 | 1 |
| Zn | 0.14 | 0.12 | 0.11 |

Figure 4: Enrichment factor for all heavy metals.
Human health risk assessment
A human may come in contact with heavy metals through two pathways i.e. drinking water consumption, and dermal absorption through skin which is available for contact. The cancer and non-cancer risks caused by heavy metals in groundwater due to drinking water ingestion and dermal exposure to people are estimated by following this procedure. To calculate such health risks concentration of heavy metals in groundwater is measured. By this concentration of heavy metals in groundwater Lifetime Average Daily Dose (LADD) for ingestion and dermal absorption is calculated and LADD values were used to calculate cancer and non-cancer risks for human. The steps of this methodology are explained below.
Lifetime Average Daily Dose (LADD)
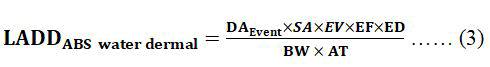
The lifetime average daily dose for life is calculated using Equations (2) and (3), adjusted by the USEPA 2004 exposure scenarios, taking both approaches into consideration. The all input parameters for these equations are given in Table 7.
Table 7: Input parameters used in calculations of exposure assessment.
| Parameters | Units | Ingestion values | Dermal absorption values | Reference |
|---|---|---|---|---|
| Heavy metals concentration | mg/L | - | - | Study data |
| Ingestion rate | L/day | 3.8 (males), 2.44 (females), 1.87 (childs) | - | Survey data |
| Skin Surface Area (SA) | (cm2) | - | 18,000 (males), 18,000 (females), 6600 (child) | USEPA (2004) |
| Permeability coefficient (Kp) | cm/hr | - | 0.0001 (Pb), 0.002 (Cr), 0.0002 (Ni), 0.001 (As), 0.0006 (Zn) | USEPA (2004) |
| tevent | hr/event | - | 0.34 (bathing for males), 0.41 (bathing for females), 0.42 (bathing for child), 0.67 (dish washing for females), 0.43 (laundry washing for females) | Survey data |
| Exposure Duration (ED) | Years | 70 (adults), 7 (childs) | 0.972 (males), 0.122 (child), 1.215 (females) | Survey data |
| Exposure Frequency (EF) | Days/yr | 365 | 365 | USEPA (2004) |
| Body Weight (BW) | Kg | 74.94 (males), 66.85 (females), 35 (childs) | 74.94 (males), 66.85 (females), 35 (child) | Survey data |
| Average Time (AT) | Days | 25550 (males), 25550 (females), 2555 (childs) | Non-carcinogenic effects=ED × 365=Carcinogenic effects: AT=70 × 365=25,550 | USEPA (2004) |
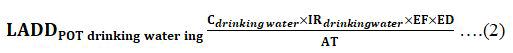
Where, LADDPOT drinking watering: Lifetime Average Daily Dose from ingestion of contaminated groundwater consumption in study area (mg/kg/day); Cdrinking water: Heavy metal’s concentration in polluted groundwater (mg/mL), IRdrinking water: Intake rate (mL/kg-day); EF: Exposure Frequency (days per year), ED: Exposure Duration (years), AT: Time over which the dose is averaged (days)
Where;
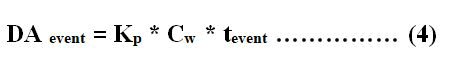
LADDABS water dermal: Average daily dose absorbed through lifetime of dermal contact with contaminated water (mg/kg-day), EV: Frequency of the event (events/day), EF: Exposure Frequency (days per year), ED: Exposure duration (years), SA: Surface Area of exposed skin (cm2), BW: Bodyweight (kg), and time for which the dosage is averaged is AT (days), DAEvent: Absorbed dose per event (mg/cm2-event). DAevent is calculated by equation (4)
Where,
Kp: Coefficient of dermal permeability for heavy metal in water (cm/hr).
Cw: Concentration of heavy metal in polluted groundwater (mg/cm3).
t event: Duration of the event (hr/event).
For three populations, i.e. children, adult males, and adult females the LADD values of metals through drinking water ingestion and dermal absorption have been calculated.
The minimum, mean, and maximum values of LADD for children, adult males, and adult females are shown in Table 9. The following order of LADD (ingestion+dermal) values was observed for heavy metals Cr>Pb>Ni>As>Zn. Similarly the trend of LADD (ingestion+dermal) values was children>adult males>adult females.
Non carcinogenic health risk assessment: Non-carcinogenic risks were calculated in the form of Hazard Quotient (HQ). The hazard quotient is the quotient of the average Lifetime daily dose, divided by the threshold value for toxicity that is called the Reference Dose (RfD) of a particular heavy metal. The HQ values for each heavy metal are specific and given in Table 8. To calculate the hazard quotient for a particular heavy metal the Equation (5) was used (USEPA, 2003).
HQing/der = LADDing/dermal / RfDing/dermal (5)
Where RfDing/der: Reference dose of ingestion/dermal absorption for the heavy metal (mg/kg-day), LADDing/der: Lifetime average daily dose for ingestion/dermal absorption, HQing/der: Hazard quotient for ingestion/dermal absorption. Hazard Index (HI) is calculated to assess the total possible non-carcinogenic risks brought about by more than one number of heavy metals. The hazard index was calculated for the combination of heavy metals from Equation (6).
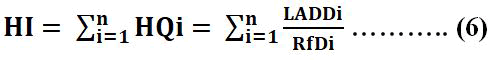
For the HI value greater than 1, there may significant non-cancer causing risks to humans, whereas HI value is less than 1 implies there could not be any health risks to humans.
For three populations, i.e. children, adult males, and adult females the non-carcinogenic risk assessment was carried out by both deterministic and probabilistic approaches for heavy metals. The minimum, mean and maximum values of Hazard Quotients (HQs), and Hazard Indices (HI) for different heavy metals are calculated via combined exposure pathways (ingestion and dermal absorption) and shown in Table 9. The results showed that the HQs were higher than 1 for Pb, Cr, and as at all 20 locations. While the HQs values were higher than 1 for Ni at 8 locations out of twenty and HQs values were lower than 1 for Zn at all locations. The non-carcinogenic health risk assessment revealed that the hazard quotient trend observed was of the order of Cr>Pb>As>Ni>Zn for all age groups (children, adults males, and adults females). The ranges of Hazard Quotient (HQs) values for children were Cr (11.13 to 57.89), Pb (2.08 to 24.61), as (2.77 to 3.32), Ni (0.49 to 1.63), and Zn (0 to 0.0023). The ranges of hazard quotient values of heavy metals for adult males were Cr (10.61 to 55.18), Pb (1.96 to 23.27), as (2.62 to 3.14), Ni (0.47 to 1.54), and Zn (0 to 0.0022). The ranges of hazard quotient values of heavy metals for adult females were Cr (8.65 to 44.96), Pb (1.41 to 16.77), as (1.89 to 2.26), Ni (0.34 to 1.11), and Zn (0 to 0.0016). The following order of HQs was observed in this study area, children>adult males>adult females. The ranges of hazard index values for children, adult males, and adult females were (26.34 to 79.12), (24.99 to 75.25), and (19.01 to 59.42) respectively. It is revealed that HQs and HI for children were higher than adults which indicated that children are more likely to be at risk because of their low body weight. The Hazard Quotient (HQs) and Hazard Index (HI) values greater than the safe limit (>1) set by the USEPA, indicate a significant non-cancer health risk of human.
Carcinogenic health risk assessment: The potential for a human cancer increases throughout the course of life as a consequence of contact to cancer-causing agent is evaluated by estimating the risk of cancer. The slope factor multiplied by the lifetime average daily dose gave cancer risk (USEPA, 2003):
Cancer risk=LADD ing × CSF oral ……. (7)
Where, risk is the unit less and CSForal: Oral carcinogenic slope factor (mg/kg-day)-1. CSF is defined as risk produced by carcinogenic heavy metals with an average lifetime of one mg/kg/day amount. CSF value is specific for each heavy metal and given in Table 8. Risks higher than 1 × 10⁻⁴ are regarded as intolerable, risks lower than 1 × 10⁻⁶ means humans may not experience any health risks, and risks range between 1 × 10⁻⁴ and 1 × 10⁻⁶ is in general regarded as tolerable range.
Table 8: Values of reference dose and slope factors.
| Heavy metals | RfD oral (mg/kg-day) | RfD dermal (mg/kg-day) | CSF (mg/kg-day)-1 |
|---|---|---|---|
| Cr | 0.003 | 0.000075 | 0.5 |
| Pb | 0.0036 | 0.00042 | 0.0085 |
| Ni | 0.02 | 0.0054 | 0.91 |
| As | 0.0003 | 0.000285 | 1.5 |
| Zn | 0.3 | 0.06 | - |
| References | IRIS USEPA | IRIS USEPA | CALIPH EPA |
For assessment of the total possible carcinogenic impacts brought about by more number of heavy metals, a Cancer Index (HI) approach is used. In the case of the combination of heavy metals, the cancer index is calculated from Equation (8).
Similarly, the chances of Cancer (CR) were also highly variable for all age groups in this study area. In general, the 1 in million CR (i.e. 1 x 10⁻⁶) in human health risk assessment is an appropriate carcinogenic risk standard. This level can be changed to 1 in 10,000 (1 x 10⁻⁴) according to national standards and environmental policies. The carcinogenic health risk assessment revealed that the cancer risk trend observed was of the order of Cr>Ni>As>Pb for all age groups. The minimum, mean, and maximum values of cancer risks through ingestion exposure pathway for children, adult males, and adult females are shown in Table 9. The ranges of Cancer Risk (CR) values of heavy metals for children were Cr (1.4 × 10⁻² to 7.7 × 10⁻²), Ni (8.9 × 10⁻³ to 2.9 × 10⁻²), as (1.2 × 10⁻³ to 1.4 × 10⁻³), Pb (6.3 × 10⁻⁵ to 7.5 × 10⁻⁴). The ranges of Cancer Risk (CR) values of heavy metals for adult males were Cr (1.4 × 10⁻² to 7.3 × 10⁻²), Ni (8.4 × 10⁻³ to 2.8 × 10⁻²), as (1.1 × 10⁻³ to 1.4 × 10⁻³), Pb (5.9 × 10⁻⁵ to 7.1 × 10⁻⁴). The ranges of Cancer Risk (CR) values of heavy metals for adult females were Cr (1.0 × 10⁻² to 5.2 × 10⁻²), Ni (6.1 × 10⁻³ to 2.0 × 10⁻²), as (8.4 × 10⁻⁴ to 1.0 × 10⁻³), Pb (4.3 × 10⁻⁵ to 5.1 × 10⁻⁴). The ranges of cancer index values for children, adult males, and adult females were (3.4 × 10⁻² to 9.4 × 10⁻²), (3.2 × 10⁻² to 8.9 × 10⁻²), and (2.3 × 10⁻² to 6.4 × 10⁻²) respectively Table 9. These cancer risks and cancer index values for children, adult males, and adult females were greater than the acceptable risk of 1-in-1,000,000, which indicate the cancer risks are highly unacceptable. Out of every 100 people, 9 children, 9 adult males and 6 adult females are at cancer risk.
Table 9: Risk assessment calculations for heavy metals in groundwater of the study area of Lahore.
| Heavy metals | Children | Adult males | Adult females | ||||||||
|---|---|---|---|---|---|---|---|---|---|---|---|
| Min | Mean | Max | Min | Mean | Max | Min | Mean | Max | |||
| LADD (ingestion+dermal) | |||||||||||
| Pb | 7.46x 10⁻³ | 4.17 x 10⁻² | 8.85 x 10⁻² | 7.05 x 10⁻³ | 3.94 x 10⁻² | 8.37 x 10⁻² | 5.08 x 10⁻³ | 2.83 x 10⁻² | 6.02 x 10⁻² | ||
| Cr | 2.99 x 10⁻² | 9.84 x 10⁻² | 1.55 x 10⁻¹ | 2.83 x 10⁻² | 9.28 x 10⁻² | 1.47 x 10⁻¹ | 2.03 x 10⁻² | 6.68 x 10⁻² | 1.06 x 10⁻¹ | ||
| Ni | 9.88 x 10⁻³ | 1.90 x 10⁻² | 3.25 x 10⁻² | 9.34 x 10⁻³ | 1.80 x 10⁻² | 3.08 x 10⁻² | 6.72 x 10⁻³ | 1.29 x 10⁻² | 2.21 x 10⁻² | ||
| As | 8.30 x 10⁻⁴ | 9.33 x 10⁻⁴ | 9.95 x 10⁻⁴ | 7.85 x 10⁻⁴ | 8.82 x 10⁻⁴ | 9.40 x 10⁻⁴ | 5.65 x 10⁻⁴ | 6.35 x 10⁻⁴ | 6.77 x 10⁻⁴ | ||
| Zn | 0 | 1.64 x 10⁻⁴ | 6.98 x 10⁻⁴ | 0 | 1.55 x 10⁻⁴ | 6.60 x 10⁻⁴ | 0 | 1.11 x 10⁻⁴ | 4.75 x 10⁻⁴ | ||
| Hazard quotient (ingestion+dermal) | |||||||||||
| Pb | 2.08 | 11.59 | 24.61 | 1.96 | 10.96 | 23.27 | 1.41 | 7.9 | 16.77 | ||
| Cr | 11.13 | 36.56 | 57.89 | 10.61 | 34.84 | 55.18 | 8.65 | 28.39 | 44.96 | ||
| Ni | 0.49 | 0.95 | 1.63 | 0.47 | 0.9 | 1.54 | 0.34 | 0.65 | 1.11 | ||
| As | 2.77 | 3.12 | 3.32 | 2.62 | 2.95 | 3.14 | 1.89 | 2.12 | 2.26 | ||
| Zn | 0 | 5.48 x 10⁻⁴ | 2.3 x 10⁻³ | 0 | 5.18 x 10⁻⁴ | 2.21 x 10⁻³ | 0 | 3.75 x 10⁻⁴ | 1.6 x 10⁻³ | ||
| HI | 26.34 | 52.22 | 79.12 | 24.99 | 49.65 | 75.25 | 19.01 | 39.06 | 59.42 | ||
| Cancer risk (only ingestion) | |||||||||||
| Pb | 6.3 x 10⁻⁵ | 3.5 x 10⁻⁴ | 7.5 x 10⁻⁴ | 5.9 x 10⁻⁵ | 3.3 x 10⁻⁴ | 7.1 x 10⁻⁴ | 4.3 x 10⁻⁵ | 2.4 x 10⁻⁴ | 5.1 x 10⁻⁴ | ||
| Cr | 1.5 x 10⁻² | 4.9 x 10⁻² | 7.7 x 10⁻² | 1.4 x 10⁻² | 4.6 x 10⁻² | 7.3 x 10⁻² | 1.0 x 10⁻² | 3.3 x 10⁻² | 5.2 x 10⁻² | ||
| Ni | 8.9 x 10⁻³ | 1.7 x 10⁻² | 2.9 x 10⁻² | 8.4 x 10⁻³ | 1.6 x 10⁻² | 2.7 x 10⁻² | 6.1 x 10⁻³ | 1.1 x 10⁻² | 2.0 x 10⁻² | ||
| As | 1.2 x 10⁻³ | 1.4 x 10⁻³ | 1.4 x 10⁻³ | 1.1 x 10⁻³ | 1.3 x 10⁻³ | 1.4 x 10⁻³ | 8.4 x 10⁻⁴ | 9.5 x 10⁻⁴ | 1.0 x 10⁻³ | ||
| Cancer index | 3.4 x 10⁻² | 6.8 x 10⁻² | 9.4 x 10⁻² | 3.2 x 10⁻² | 6.4 x 10⁻² | 8.9 x 10⁻² | 2.3 x 10⁻² | 4.6 x 10⁻² | 6.4 x 10⁻² | ||
Monte Carlo simulation
Risk assessment is a sensitive and complex analysis and there is always uncertainty present in it. Monte carlo simulation is a probabilistic method that is applied to reduce the uncertainties in risk assessment. By Minitab software, 10,000 rows of simulated data for cancer risk and hazard quotient were calculated. Minitab generated graphical summary including histogram and descriptive statistics (mean and median, minimum, maximum, variance, skewness) of data. From histograms we identified that which value has the highest frequency of risk for all heavy metals. By monte carlo simulation, the minimum, mean and maximum values of HQ(ingestion+dermal) values are shown in Table 10. The non-carcinogenic health risk assessment revealed that the hazard Quotient trend observed was of the order of Cr>Pb>As>Ni>Zn for all age groups. Similarly, the Cancer risk trend observed was Cr>Ni>As>Pb for all age groups which suggested that Cr has high probability of health risks in this study area. The ranges of hazard index values for children, adult males, and adult females were (-7.78 to 114.91), (-7.88 to 108.06), and (-9.45 to 69.6) respectively. The ranges of cancer index values for children, adult males, and adult females were (-9.09 × 10⁻³ to 1.48 × 10⁻¹), (-2.13 × 10⁻² to 1.35 × 10⁻¹), and (-4.37 × 10⁻³ to 9.68 × 10⁻²) respectively. The hazard quotient and hazard index values greater than 1 indicate a significant non-cancer risk to human. Similarly, the cancer risks and cancer index values for children, adult males, and adult females were greater than the acceptable risk of 1-in-1,000,000; this indicates the cancer risks are highly unacceptable. The histogram of frequencies of hazard quotient and cancer risk using monte carlo simulation for each heavy metal are shown in Figure 5-7. The trend of heavy metals with and without simulation was same, which indicate there was no uncertainty in our data (Figure 8).
Table 10: Risk assessment calculations for heavy metals in groundwater of the study area by Monte Carlo simulation.
| Heavy metals | HQ (ingestion+dermal) for children | HQ (ingestion+dermal) for males | HQ (ingestion+dermal) for females | ||||||
|---|---|---|---|---|---|---|---|---|---|
| Min | Mean | Max | Min | Mean | Max | Min | Mean | Max | |
| As | 2.58 | 3.11 | 3.66 | 2.47 | 2.94 | 3.36 | 1.78 | 2.11 | 2.47 |
| Cr | -2.53 | 36.63 | 77.8 | -4.83 | 35.03 | 72.72 | -4.26 | 28.46 | 58.85 |
| Ni | -0.18 | 0.95 | 2.03 | -0.03 | 0.9 | 1.89 | -0.26 | 0.65 | 1.41 |
| Pb | -7.65 | 11.61 | 31.42 | -5.49 | 11.06 | 30.09 | -6.71 | 7.94 | 19.91 |
| Zn | -1.89 × 10⁻³ | 5.57 × 10⁻⁴ | 2.85 × 10⁻³ | -1.85 × 10⁻³ | 5.28 × 10⁻⁴ | 2.71 × 10⁻³ | -1.24 × 10⁻³ | 3.82 × 10⁻⁴ | 2.15 × 10⁻³ |
| Hazard index | -7.78 | 52.3 | 114.91 | -7.88 | 49.93 | 108.06 | -9.45 | 39.16 | 69.6 |
| Cancer risk (ingestion) | |||||||||
| As | 1.17×10⁻³ | 1.40×10⁻³ | 1.65×10⁻³ | 1.11×10⁻³ | 1.32×10⁻³ | 1.55×10⁻³ | 7.93×10⁻⁴ | 9.53×10⁻⁴ | 1.12×10⁻³ |
| Cr | -9.07 × 10⁻³ | 4.93 × 10⁻² | 1.08 × 10⁻¹ | -1.89 × 10⁻² | 4.63 × 10⁻² | 9.72 × 10⁻² | -4.28 × 10⁻³ | 3.35 × 10⁻² | 7.09 × 10⁻² |
| Ni | -9.60 × 10⁻⁴ | 1.74 × 10⁻² | 3.85 × 10⁻² | -3.36 × 10⁻³ | 1.65 × 10⁻² | 3.57 × 10⁻² | -7.62 × 10⁻⁴ | 1.17 × 10⁻² | 2.40 × 10⁻² |
| Pb | -2.44 × 10⁻⁴ | 3.58 × 10⁻⁴ | 9.13 × 10⁻⁴ | -1.33 × 10⁻⁴ | 3.37 × 10⁻⁴ | 8.48 × 10⁻⁴ | -1.27 × 10⁻⁴ | 2.42 × 10⁻⁴ | 6.39 × 10⁻⁴ |
| Cancer Index | -9.09 × 10⁻³ | 6.85 × 10⁻² | 1.48 × 10⁻¹ | -2.13 × 10⁻² | 6.45 × 10⁻² | 1.35 × 10⁻¹ | -4.37 × 10⁻³ | 4.65 × 10⁻² | 9.68 × 10⁻² |

Figure 5: Simulation results of non-carcinogenic risks for a) Children; b) Adult females; c) Adult males.

Figure 6: Simulation Results of non-carcerrisks (dermal) for a) Children b) Adult females c) Adult males

Figure 7: Simulation results of carcinogenic risks (in × 10-6) of heavy metals for a) Children; b) Adult females; c) Adult males.

Figure 8: Spatial distribution map for heavy metals a) Arsenic; b) Chromium; c) Lead; d) Nickel; e) Zinc in study area of Lahore
Conclusions
The concentrations of Cu, Cd, and Fe were Below the Detection Limit (BDL) at all locations of the study area. The mean values of Pb, Cr and Ni, and As exceeded the PEQS values while the mean values of other parameters were within PEQS values. The descriptive statistics and box-whisker graphs showed most of the parameters are unsymmetrical distributed. Pearson correlation showed that “Ni”, “Cr”, “Pb”, and “As” correlate with physical parameters. ANOVA also supported these correlations. PCA and CA data identified possible sources, i.e. Landfill leachates, sewage effluent discharges, and seepage of industrial discharges. The enrichment Factor trend observed was Pb>Cr>Ni>Mg>As>Zn. The hazard quotient trend observed was of the order of Cr>Pb>As>Ni>Zn for children, adult males and adult females by deterministic method. The hazard quotient (HQs) values of all age groups were (>1) for Cr, Pb, and as at all locations which indicates a significant health risk to the humans. Similarly, Cancer Risk trend observed was of the order of Cr>Ni>As>Pb for all age groups. By Monte Carlo Simulation, the CRing trend observed was Cr>Ni>As>Pb for children, adult males, and adult females. The CR of children >CR of males>CR of female. Based on the HQing the order of heavy metals impact is: Cr>Pb>As>Ni>Zn for children, adults and females. The HQing of children >HQing of males >HQing of females. Based on HQder the order of heavy metals impact is Cr>Pb>As>Ni>Zn for children, adult males, and adult females. The HQder of females >HQder of children > HQder of males.
Recommendations
Proper steps must be taken to raise awareness, develop the technology and policy recommendations, to reduce local people's health risks. Appropriate planning and methods of waste management from industrial establishments should be enforced to prevent further degradation of groundwater. A proper monitoring system for pollution control should also be enforced. Before consumption, polluted groundwater resources should be properly treated.
Acknowledgements
The author is thankful to Water and Sanitation Agency (WASA), Lahore, for providing relevant information and data. The author is also thankful to IEER UET, for providing analytical facilities for quality assurance.
Declaration of Competing Interest
We confirm there is no conflict of interest.
Author Contributions
IK involved in the writing up of the research proposal, performed the sampling and laboratory analysis, presented the results, and is the corresponding author.
Funding
This study was supported by a grant awarded by the university of engineering and technology, Lahore.
Data Availability Statement
The data used to support the findings of this study are available from the corresponding author upon request.
Conflicts of Interest
The authors declare that they have no conflicts of interest.
References
- Ince NH, Dirilgen N, Apikyan IG, Tezcanli G, Ustun B. Assessment of toxic interactions of heavy metals in binary mixtures: A statistical approach. Arch Environ Contam Toxicol. 1999;36(4):365-372.
[Crossref] [Google Scholar] [Pubmed]
- Hou D, O'Connor D, Nathanail P, Tian L, Ma Y. Integrated GIS and multivariate statistical analysis for regional scale assessment of heavy metal soil contamination: A critical review. Environ Pollut. 2017;231:1188-1200.
[Crossref] [Google Scholar] [Pubmed]
- Barbieri MJ. The importance of Enrichment Factor (EF) and geoaccumulation index (Igeo) to evaluate the soil contamination. J Geol Geophys. 2016;5(1):1-4.
- Bhutiani R, Kulkarni DB, Khanna DR, Gautam A. Water quality, pollution source apportionment and health risk assessment of heavy metals in groundwater of an industrial area in North India. Expo Health. 2016;8:3-18.
- Chabukdhara M, Gupta SK, Kotecha Y, Nema AK. Groundwater quality in Ghaziabad district, Uttar Pradesh, India: Multivariate and health risk assessment. 2017;179:167-178.
[Crossref] [Google Scholar] [Pubmed]
- Chowdhury S, Mazumder MJ, Al-Attas O, Husain T. Heavy metals in drinking water: Occurrences, implications, and future needs in developing countries. Sci Total Environ. 2016;569:476-488.
[Crossref] [Google Scholar] [Pubmed]
- Acharjee A, Ahmed Z, Kumar P, Alam R, Rahman MS, Simal-Gandara J. Assessment of the ecological risk from heavy metals in the surface sediment of River Surma, Bangladesh: Coupled approach of monte carlo simulation and multi-component statistical analysis. 2022;14(2):180.
- Fallahzadeh RA, Ghaneian MT, Miri M, Dashti MM. Spatial analysis and health risk assessment of heavy metals concentration in drinking water resources. Environ Sci Pollut Res Int. 2017;24(32):24790-802.
[Crossref] [Google Scholar] [Pubmed]
- Giri S, Singh AK, Mahato MK. Monte Carlo simulation-based probabilistic health risk assessment of metals in groundwater via ingestion pathway in the mining areas of Singhbhum copper belt, India. Int J Environ Health Res. 2020;30(4):447-460.
[Crossref] [Google Scholar] [Pubmed]
- Haque A, Jewel MA, Ferdoushi Z, Begum M, Husain MI, Mondal S. Carcinogenic and non-carcinogenic human health risk from exposure to heavy metals in surface water of Padma River. Res J Environ Toxicol. 2018;12(1):18-23.
- Hu G, Bakhtavar E, Hewage K, Mohseni M, Sadiq R. Heavy metals risk assessment in drinking water: An integrated probabilistic-fuzzy approach. J Environ Manage. 2019;250:109514.
[Crossref] [Google Scholar] [Pubmed]
- Hu G, Rana A, Mian HR, Saleem S, Mohseni M, Jasim S, et al. Human health risk-based life cycle assessment of drinking water treatment for heavy metal (loids) removal. J Clean Prod. 2020;267:121980.
- Hussain S, Habib-Ur-Rehman M, Khanam T, Sheer A, Kebin Z, Jianjun Y. Health risk assessment of different heavy metals dissolved in drinking water. Int J Environ Res Public Health. 2019;16(10):1737.
[Crossref] [Google Scholar] [Pubmed]
- Islam AR, Bodrud-Doza M, Rahman MS, Amin SB, Chu R, Al Mamun H. Sources of trace elements identification in drinking water of Rangpur district, Bangladesh and their potential health risk following multivariate techniques and monte-carlo simulation. Groundw Sustain Dev. 2019;9:100275.
- Izah SC, Chakrabarty N, Srivastav AL. A review on heavy metal concentration in potable water sources in Nigeria: Human health effects and mitigating measures. Expo Health. 2016;8:285-304.
- Alam N, Ahmad SR, Qadir A, Ashraf MI, Lakhan C, Lakhan VC. Use of statistical and GIS techniques to assess and predict concentrations of heavy metals in soils of Lahore City, Pakistan. Environ Monit Assess. 2015;187(10):636.
[Crossref] [Google Scholar] [Pubmed]
- Likuku AS, Mmolawa KB, Gaboutloeloe GK. Assessment of heavy metal enrichment and degree of contamination around the copper-nickel mine in the Selebi Phikwe Region, Eastern Botswana. Environ Ecol Res. 2013;1(2):32-40.
- Masok FB, Masiteng PL, Mavunda RD, Maleka PP. An integrated health risk evaluation of toxic heavy metals in water from Richards Bay, South Africa. J Environ Anal Toxicol. 2017;7(4):2161-0525.
- Saleh HN, Panahande M, Yousefi M, Asghari FB, Oliveri Conti G, Talaee E, et al. Carcinogenic and non-carcinogenic risk assessment of heavy metals in groundwater wells in Neyshabur Plain, Iran. Biol Trace Elem Res. 2019;190(1):251-261.
[Crossref] [Google Scholar] [Pubmed]
- Waqas H, Shan A, Khan YG, Nawaz R, Rizwan M, Rehman MS, et al. Human health risk assessment of arsenic in groundwater aquifers of Lahore, Pakistan. Hum Ecol Risk Assess: Int J. 2017;23(4):836-850.
Citation: Khalid I (2023) Health Risk Assessment and Statistical Modeling of Toxic Metals in Groundwater of Lahore, Pakistan. J Pet Environ Biotechnol. 14:527.
Copyright: © 2023 Khalid I. This is an open access article distributed under the terms of the Creative Commons Attribution License, which permits unrestricted use, distribution, and reproduction in any medium, provided the original author and source are credited.