Indexed In
- Open J Gate
- The Global Impact Factor (GIF)
- Open Archive Initiative
- VieSearch
- International Society of Universal Research in Sciences
- China National Knowledge Infrastructure (CNKI)
- CiteFactor
- Scimago
- Ulrich's Periodicals Directory
- Electronic Journals Library
- RefSeek
- Directory of Research Journal Indexing (DRJI)
- Hamdard University
- EBSCO A-Z
- Publons
- Google Scholar
Useful Links
Share This Page
Journal Flyer
Open Access Journals
- Agri and Aquaculture
- Biochemistry
- Bioinformatics & Systems Biology
- Business & Management
- Chemistry
- Clinical Sciences
- Engineering
- Food & Nutrition
- General Science
- Genetics & Molecular Biology
- Immunology & Microbiology
- Medical Sciences
- Neuroscience & Psychology
- Nursing & Health Care
- Pharmaceutical Sciences
Review Article - (2024) Volume 14, Issue 2
Gurugram: Challenges on Being a Smart City-A Review
Jassi Kushwaha and Aaquib KhanReceived: 25-Jun-2021, Manuscript No. IJWR-24-10921; Editor assigned: 30-Jun-2021, Pre QC No. IJWR-24-10921; Reviewed: 14-Jul-2021, QC No. IJWR-24-10921; Revised: 16-Aug-2024, Manuscript No. IJWR-24-10921; Published: 13-Sep-2024, DOI: 10.35248/2252-5211.24.14.579
Abstract
Urbanisation is accelerating across the India as result of modernisation and economic opportunity. One of the major components of urbanisation is progressive migration of people from rural to urban areas. In next 30 years, the population of India is predicted to be doubled up. Looking at the faster rate of evolution poses a big infrastructure challenge for developing cities to provide housing and urban infrastructure with safe drinking water, sanitation, functioning sewerage, transportation, etc., to the migrant population flocking in. To promote urban infrastructure Government has come with an initiative of smart cities mission to build 100 smart cities all over the country. And the number is expected to grow further. Lying to the south of Delhi in Haryana State, the city Gurugram also known as ‘Singapore of India’ and a city favoured by expats, mostly working for multinational companies anticipates to be smart city. In May, 2016 Gurugram missed the list of smart cities. The city of boomtown of millions has brought in its wake concerns around sustainability. The several reasons like lack in functioning citywide sewer or drainage system, safe drinking water, proper disposal of solid waste, C and D waste management and environmental concerns like air pollution are blamed for the city not making smart city shortlist. As many efforts are being made by the respective government bodies to achieve the objective of overcoming these challenges and to make Gurugram a smart city. The focus of the study being made through this paper is to provide an overview of existing challenges faced by millennium Gurugram city. This paper outlines major issues and attempts to provide possible solutions for the management of above said challenges on sustainable basis.
Keywords
Smart city; Urbanisation; Environmental concern; Waste management
Introduction
Urbanisation describes the shift of people from rural area to urban area. It shows both increase in footprint of urban area and increase in population. As a result of industrialisation and modernisation in India, people have started moving towards town leading to growth of towns. The explosive growth and migration in India has made colossal demands on resources including water, energy, land, mobility and biodiversity and is generating stack of waste. This needs to be addressed at the early stages of growth. It shows the great challenge for the government and city to accommodate the agglomerations. Government realised need for cities to cope with the challenges of metropolitan living and to become magnets for investment and hence the formulated the idea of “smart cities” [1].
Smart city is not limited to single particular concept or any idea. It involves overall development of city and citizens, in both horizontal and vertical parameters. The core infrastructure features of smart city mission includes adequate water supply; assured electricity supply; sanitation, including solid waste management; C and D waste management; efficient urban mobility and public transport; affordable housing; good governance, e-governance; sustainable environment; safety and security of citizens; and health and education [2].
Literature Review
Urban expansion in Gurugram
Gurugram is the most urbanised city in Haryana with third highest per capita income in the country after Chandigarh and Mumbai. Gurugram contributes 48% of Haryana Revenue. Gurugram is attractive because of its strategic location with its boundaries touching Rajasthan, Uttar Pradesh and to New Delhi and also its closeness to the international airport. Gurugram district has witnessed a remarkable growth in all spheres of developments, notably in industries and markets. Present-day Gurugram, also called ‘Millennium city’ has become house for more than half of 500 companies [3].
Gurugram’s excellent connectivity with other state via Delhi- Jaipur-Ahmedabad rail and NH-8 has made the city a hub of multinational companies, industries giants, call centres, software companies, shopping malls and skyscrapers.
Thousands of people visit to Gurugram for the purpose of work, travel and entertainment. In early eighty’s with the collaboration of Suzuki Motors of Japan and Maruti Udyog Limited, a new area of rapid industrialisation of Gurugram came up. The Gurugram-Manesar-Bawal belt has emerged as the auto hub of the country, thereby offering ample opportunities to the entrepreneurs [4]. With its rapid development, Gurugram has emerged as an important district in Haryana. In 1991, the population of city was fastened at 125,000. With growing urbanisation, city has experienced potential growth-from population of 870,539 in 2001 to 1,514,085 in 2011 (Figure 1). By the year 2020, city is expected to show potential growth of 4.3 millions (Table 1).
Gurugram district is divided into three sub-divisions, Gurgaon (north, south and Pataudi). In Gurgaon district, Gurgaon and Pataudi also have sub divisional status (Figure 2) (Table 2) [5].
| Year | Population growth |
|---|---|
| 1951-1961 | 28.7% |
| 1961- 1971 | 34.1% |
| 1971 - 1981 | 35.5% |
| 1981- 1991 | 28.6% |
| 1991-2001 | 44.2% |
| 2001-2011 | 73.1% |
Table 1: Population of Gurugram (1951-2011).
| Title | Details |
|---|---|
| Sub division | Gurgaon (North, South and Pataudi) |
| Tehsils | Gurgaon, Sohna, Pataudi, Farruk Nagar, Manesar |
| Sub-Tehsils | Wazirabad, Badsahpur, Kadipur, Harsaru |
| Blocks | Gurgaon, Sohna, Farruk Nagar, Pataudi |
| Municipal council | Sohna |
| Municipal committees | Pataudi, Haily Mandi, Farruk Nagar |
Table 2: Administrative structure of Gurugram.
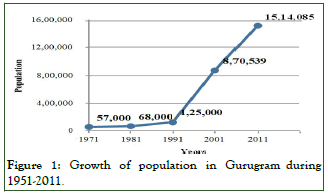
Figure 1: Growth of population in Gurugram during 1951-2011.
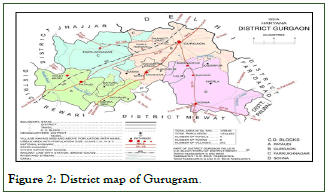
Figure 2: District map of Gurugram.
Discussion
Challenges/issues
With growing explosive urbanisation, Gurugram is flooding and becoming water guzzler, drawing underground water and from upstreams and discharging their waste sewage and industrial effluents downstream. Water table in Gurugram is getting depleted at the rate of 1 m/year-3 m/year. Many parts of Gurugram are unconnected to sewer lines and sewage dumped, is leading to more contamination; unscientific management and ineffective treatment. The quality of air in the city is getting deteriorated extremely due to huge volume of vehicular movement, industrial units and construction activities that release toxic effluents in to the air (Figure 3). The city being settled in land locked region traps the toxic air which leads to a variety of respiration-related ailments among citizens [6].
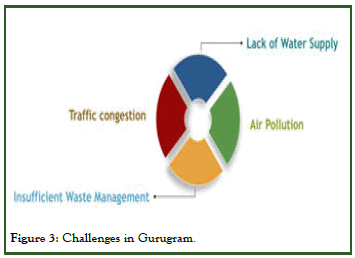
Figure 3: Challenges in Gurugram.
Gurugram’s solid waste generation is rising with growing population. At present the city is generating 650 Metric Tonnes (MT) per day of solid waste, twice of waste generated 10 years ago. The projected solid waste generation of the city in 2021 is estimated to be 1,040 MT and in 2041 is to be 2,839 MT.
Gurugram also generates sizeable quantities of C and D waste estimated to be 700 tonnes per day, E-waste-70,000 tonnes annually and biomedical waste-1.5 tonnes per day. Rather than curbing rate of urbanisation, we need to look at the real challenges and opportunities that exits. With the help of this paper we are trying to anticipate the developed atrocities due to lack of water supply and insufficient waste management in the city and the challenges posed by them and solutions that needs to be found.
Water
Water sources and supply: Water is one of the key asset for sustainable urban development. It is very essential for every human endeavour for household use, agriculture, industry, leisure and also has an important role to play in ecosystem function. Gurugram gets its water supplies from Yamuna river. Yamuna’s water is supplied from Tajewala headworks near Yamunanagar and passes through Western Yamuna Canal (WYC) in Kakaroi village, near Sonepat and then supplied to Basai in Gurugram through Gurgaon Water Supply (GWS) canal. The supply of water in Gurugram is controlled by Public Health and Engineering Department (PHED) and Gurugram Metropolitan Development Authority (GMDA). Formerly, it was controlled by Haryana Urban Development Authority (HUDA) which transferred these services to GMDA in October 2018. PHED is responsible for supply of water in old city area while GMDA is responsible for the new city [7].
Gurugram’s water demand is met through both canal based water supply and tube wells. Tajewala headworks supplies 245 Million Litres a Day (MLD) at its head at Kakaroi village. From Kakroi Sonepat, Gurugram gets raw Yamuna water through 72.585 km long Gurgaon Water Supply channel (GWS) and part of water is supplied through Delhi sub-branch canal (NCR channel) 75.536 km constructed by Haryana irrigation department (Table 3). GWS and NCR channel meets not just demand of HUDA and PHED but also by supplying water to HSIIDC’s (Haryana State Industrial and Chandu Bhudera) (Table 4).
| Location of Water Treatment Plant (WTP) | Water supply (MGD) | Status | Source of water |
|---|---|---|---|
| Basai | 60 | Existing | Gurgaon water supply canal (Yamuna) |
| Chandu Budhera | 66 | Existing | NCR canal |
| Total augumentation | 126 |
Table 3: Source of water supply in Gurugram.
| S. No | Description | Name of agency projecting demand | Requirement |
|---|---|---|---|
| 1 | Gurugram | HUDA, HSIDC, Sultanpur lake, PHED | 375 cusec |
| 2 | Rural area | PHED | 80 cusec |
| 3 | Bahadurgarh, Sampla, Badli | PHED | 150 cusec |
| 4 | Reliance SEZ | HSIIDC | 135 cusec |
| 5 | DLF universal | HSIIDC | 108 cusec |
| 6 | Orient craft | HSIIDC | 02 cusec |
| 7 | Other developers | HSIIDC | 05 cusec |
| 8 | Industries at | ||
| Manesar | HSIIDC | 54 cusec | |
| Bahadurgarh | 11 cusec | ||
| Kharkhoda | 27 cusec | ||
| 9 | Losses and theft | 60 cusec | |
| Total | 1007 cusec | ||
Table 4: Proposed water supplies in NCR channel by 2021.
Water distribution
After treating Yamuna’s raw water at two plants, water is supplied to area under MCG, private localities and other colonies through 506 km piped distribution network. But due to haphazard planing city suffers from unequal distribution as 64 per cent of city has piped access to water. Earlier, Gurugram district was divided into three water supply zones by HUDA [8].
HUDA was responsible for water supply in zone 1, zone 2 and zone 3.
Zone 1: New Palam Vihar, Maruti Udyog, Katarpuri, Molaheda, sectors 4, 5, 6, 7, 8, 9, 9A, 10, 10A, 11, 12, 21, 22, 23, Dundahera and nearby areas.
Zone 2: Sector 14, 15, 16,17, 18, 19, 20, 29, 30, 31, 32, 33, 34, 41, 29, 27, 28, 40, Jalvayu Vihar, MG Road, DLF, Sushant Lok and nearby areas.
Zone 3: Sector 49-57 and areas along Sohna road. Gurugram city has 3 boosting stations in sector 5, 16 and 51 which receives water from basai and Chandu budhera treatment plants and distribute to old sectors (Table 5). Many sectors like sector 58-68, 69-74, 75-80, are currently dependent on water tankers. Now, new district administration had decided to increase number of water supply zones from three to eight zones. Now, new sectors have been divided in four zones-sectors 58-67, 68-80, 80-97 and 98-115 to improve water supply situation (Figure 4) [9].
| The city | |
| Area | 732 sq. km |
| Population (2011) | 15,14,432 |
| Population density 2011 | 1241 inhabitants per sq. km. |
| Population (2021), as projected | 3056183 |
| Growth rate | 79.93% |
| The water | |
| Demand | 666 MLD |
| Per capita water demand as per city agency | 225 LPCD |
| Sources and supply | |
| Water sources | Yamuna and ground water |
| Water sourced from surface sources | 94% |
| Water sourced from ground sources | 6% |
| Total water supplied | 126 MGD |
| Per capita supply | 130 MLD |
| Leakage loss | 15% |
| Actual supply (after deducting losses) | 91 MLD |
| Population served by water supply system | 64% |
| Demand-supply gap (after leakage loss) | 42% |
| Treatment | |
| Number of WTPs | 2 |
| Total treatment capacity | 126 MGD |
| Required increase in supply | 131% |
Table 5: Improve water supply situation.
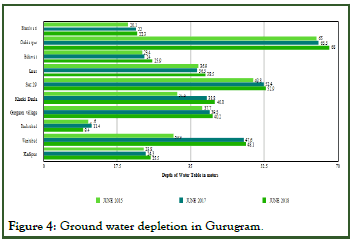
Figure 4: Ground water depletion in Gurugram.
Observant groundwater
The ground water through tubewell is one of the major source of supply. In Gurugram, over extraction of water without proper recharge and leaching have polluted the groundwater supply. The leaching of pollutants from municipal solid waste, industrial waste and agriculture, pesticides and fertilisers into aquifers have polluted ground-water along with surface water. This has increased content of nitrates and fluorides in groundwater. It is essential to understand that groundwater is not a resource to be utilised without thought. Water use has to be integrated effectively with water regeneration. The quality of Gurugram’s ground water is deteriorating and salinity is increasing with each passing year. Many commercial, residential and building construction projects depend on tubewell. According to Central Ground Water Board (CGWB), water table in Gurugram has dropped from 43 m below ground level (bgl) in 2003 to 51 m bgl in 2006 (Table 5). Over exploitation of ground water has resulted in water depletion at rate of 1 m-3 m per year. According to the CSE report total ground water extraction is estimated around 86 MLD from public and private sources. The CGWB has warned that if the ground water continues to diminish below 200 m, only rocks will be left. This has drawn groundwater at an alarming rate [10].
Water demand vs. supply
Gurugram’s supply system is designed to carry about 245 Million Litres a Day (MLD) at its head at Kakaroi village, near Sonepat. About 50% of this water is lost through evaporation and diversion. Only 30% of the city’s water needs are met from river Yamuna. According to one estimate, the city needs 560 MLD of water. The net supply by the municipality does not meet even half of this demand.
The official estimation of demand of water in Gurugram is 51% higher than the norms set by central public health and environmental engineering organisation.
The gap between official demand and supply is 42%. Based on these calculations, the city would have to increase its supply substantially to meet this jump.
| Agency | Population 2021 (in millions) | Water demand 2007 (MLD) | Water demand 2021 (MLD) |
|---|---|---|---|
| Official figures | 3.7 | 162 | 666 |
| JAFRA | 6 | 324 | 1080 |
Table 6: Water demand projection.
The challenge is how to augment local sources of water to build water security. There is urgent need to increase the ground water recharge to compensate the declined depth of water table. Rooftop rainwater harvesting should be adopted and recharge structures must be constructed in the area to enhance ground water depression. Gurugram needs to take steps to make its growth model more sustainable, as explosive urbanisation is stretching the city's resources to the limit.
Sewerage
Sewage system act as an important stake in protecting public health and for sustainable environment. Sewers are the large network of pipes that constitutes the drainage system and are responsible for removal and disposal of surplus rain/irrigation water from the land. Sanitary sewer and storm sewer are two important aspects of physical infrastructure of drainage system. In sanitary sewer system, underground pipes are laid that carry sewage from bathrooms, sinks, kitchens and other plumbing components to a wastewater treatment plant.
And in storm sewer system, underground or open ditches are designed to carry rainfall runoff and discharge untreated into local streams, rivers and other surface water bodies [11].
Existing situation of sewerage generation and collection of Gurugram
Sewage generation of city was 17 MLD in year 2001 and approximately 80 MLD in year 2005. In 2007, by official estimate sewage generation was pegged at 129.6 MLD while according to the Joint Association of Federation of Residents Welfare Association (JAFRA) sewage generation is estimated it to be about 260 MLD. At present according to official data, city produces about 225 MLD of sewage, while treatment plant can process only 148 MLD (Table 6). The waste generation by the city is calculated by taking the generation factor at 98 LPCD. Based on this generation factor, the future sewage generation in year 20-21 is worked out to be around 532.8 MLD by JAFRA and 864 MLD by official data.
| Agency | Sewage generation (MLD) In 2021 | Sewage treatment (MLD) in 2021 | GAP sewage generation and treatment capacity (MLD) |
|---|---|---|---|
| JAFRA | 532.8 | 255 | 272.8 |
| Official data | 864 | 255 | 604 |
Table 7: Future sewage generation.
Sewerage system in many parts of Gurugram has become old. It often leads to polluting ground water because of many joints and leakage in pipes. Only 50-60 percent of city is covered by sewerage system and only 95% is covered by closed drains. The private colonies which are not covered by sewage connection, collect sewage in septic tank and dump in open areas and drains. Estimation of such flows is not possible. The city is divided in four sewerage zones I to IV by HUDA. The total length of sewers was about 114 km in year 2007.
In Gurugram, at least 80 million litres of untreated sewage gets mixed with rain water and flows directly into storm. It pollutes river, damages underground water table, clogs drainage system even when rainfall is modest. A case is being addressed by national green tribunal since September 2016, (Manoj Misra vs. State of Haryana and Subhash Gupta vs. Union of India), in which petitioners have raised concerns about local stormwater drains from Delhi-NCR dumping untreated sewage into the Najafgarh drain and ultimately into the Yamuna [12].
According to NGT (National Green Tribunal), drains in the city must be obstructionfree and should not carry sewage. Gurugram Metropolitan Development Authority’s (GMDA) submitted the action plan to check illegal disposal of sewage in the city before the bench of NGT (Table 7).
| S. No | Zones | Population 2011 | Actual coverage by water supply (%) | Actual water supply in lpcd | Actual water demand (MLD) | Actual sewage generation @ 80% of water demand | Coverage of sewer network (%) | Coverage by individual toilets (%) |
|---|---|---|---|---|---|---|---|---|
| 1 | Gurugram | 9,33,454 | 60 | 136 | 126.95 | (MLD) | 60 | |
| 2 | Farukknagar | 13,513 | 90 | 86 | 1.1 | 0.88 | 7 | 80 |
| 3 | Dundahera | Included in Gurugram | 100 | 70 | - | 0 | 0 | 90 |
| 4 | Sohna | 53,962 | 80 | 115 | 6.21 | 4.96 | 86 | 70 |
| 5 | Hailey Mandi | 20,906 | 95 | 103 | 4.26 | 3.41 | 53 | 90 |
| 6 | Pataudi | 20,418 | 95 | 103 | * | * | 72 | 90 |
| 7 | Rural | 4,72,179 | 90 | 100 | 37.77 | 37.77 | 0 | 55 |
| Total | 15,14,432 | 185.84 | 148.58 |
Table 8: Sewage generation of Gurugram.
Treatment of sewage
Gurugram has three Sewage Treatment Plants (STPs), two of which are under HUDA and mainly treat the wastewater generated in the HUDA sectors. These plants are maintained by private agencies. Some of the sewage generated in 37 villages of MCG is also disposed into main HUDA sewer line. The sewage generated in the old city area is sent to the third STP owned and operated by MCG. The sewage collected from all offices, malls, high-rises and other colonies from ambience mall are disposed to unlined drain (Table 8). It get mixed with untreated sewage disposed by Khost Drain, Badshahpur Drain, Drain no 1, 2 from Gurgaon before meeting Yamuna. Khost drain starts from Ghata irrigation dam and runs along extended golf course road till vatika chowk. From vatika chowk, the drain is called Badshahpur drain.
| Name | Location | Treatment capacity (MLD) | Disposal of treated effluents |
|---|---|---|---|
| STP owned by HUDA | At Dhanwapur village | 67.5 | Najafgarh drain |
| STP owned by PHED | At Dhanwapur village | 31.5 | Najafgarh drain |
| STP owned By HUDA | Berhampur village | 50 | Najafgarh drain |
| Total | 150 |
Table 9: STPs in Gurugram.
By travelling 8 km to meets Najafgarh drain which carries both treated and untreated residential waste as well as waste treated in industrial effluent.
Solid waste
Solid waste is the undesirable or rejected solid materials generated from residential, industrial or commercial areas. It can be any garbage, sludge from waste water treatment plant or any other discarded materials including solid, liquid, semi-solid from industries, commercial, mining or from agriculture operations (Figure 5). Solid wastes can be classified in three manner according to their i) Origin or generation such as domestic, industrial, commercial, construction or institutional, ii) On the basis of type of contents or material for example organic material, glass, metal, plastic paper etc., iii) On the basis of their hazard potential like toxic, non-toxin, flammable, radioactive, infectious, etc.
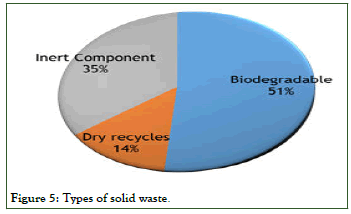
Figure 5: Types of solid waste.
Solid waste management and existing condition
Solid waste management may be defined as control of generation, collection, storage, transfer and transport, processing and disposal of solid wastes in a manner to reduce or eliminate the adverse impact on environment and human health. The measure of waste generated is directly proportional to socio economic status of the urban population. As there has been a sharp outburst in the population of the city in last 10 to 20 years, there has been a parallel increase and growth in its area. The need to accommodate the growing population has caused this increase in area. The growth in area has bought with it change in the nature of landuse with the growing limits of the city. Solid waste generation varies form residential and industrial producers, for urban and rural areas and for change in developed and developing nations. Consequently, due to landscape change there has been drastic change in solid waste generation.
At present, city has urban area about 167 square km and is producing over 600 metric tonnes of waste, according to MCG. The estimation of future waste generation is calculated on the basis of expecting population therefore per capita growth of waste generation is estimated at 1.33 per cent per annum. The quantum of solid waste generation is projected to be 1040 MT in 2021 and 2839 MT in year 2041. This unmanaged MSW is giving green signal to innumerable ailments. While some experts say actual waste generation of the city is around 800-1000 tonnes (Figure 6). Around 51% generated waste is biodegradable and the rest being non-biodegradable and inert in nature.
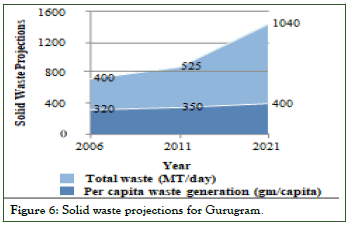
Figure 6: Solid waste projections for Gurugram.
According to CPCB report 2013, there is no city in India which ensures 100% segregation of waste at the formation site, only 70% of the waste is collected out of 30% is again mixed in urban environment. Out of total waste collected, only 12.45 waste is scientifically processed and rest is disposed in open dumps.
Generation and collection
Due to rapid development city is generating all kinds of waste, ewaste (due to huge corporate sector) as well as bio-medical waste (due to growing hospital sector) and also industrial waste. The MCG is the apex body for waste planning and management of the city. Apart from MCG, there are multiple agencies such as GMDA, HUDA, HSIIDC and private colonisers like DLF and Unitech which are involved operationally to manage waste sector of Gurugram (Figure 7).
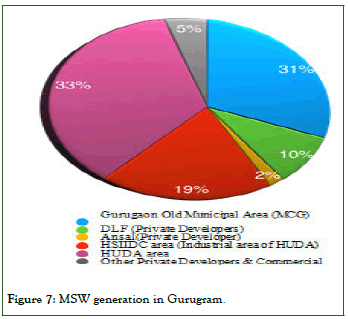
Figure 7: MSW generation in Gurugram.
The collection of waste from source such as waste from household, markets, institutions and taking community bins is primary collection of waste. In Gurugram, primarily private agency eco-green energy is involved for waste collection from door to door and street sweeping in MCG areas.
According to the report “Integrated solid waste management facility at village: Bhandwari” by HUDA in May 2016, there are approximately 300 bins of 1.1 cum capacity, 100 bins of 3 cum capacity and 200 bins of 4.5 cum capacity. In urban villages of Gurugram, there is no allocated site to dump waste. As a result, the waste is dumped locally in the vacant land on the outskirts of village and leads to waste augmentation on the roads (Table10). There is an urgent need to improve waste collection and to recognised the need to adopt inventing strategies for suitable solid waste management.
| State | Daily waste generated (MT) | Waste processed |
|---|---|---|
| D and N Haveli | 35 | 0% |
| J and K | 1374 | 1% |
| Jharkhand | 2327 | 2% |
| Odisha | 2650 | 2% |
| Bihar | 1318 | 3% |
| Punducherry | 350 | 3% |
| Mizoram | 201 | 4% |
| West Bengal | 7700 | 5% |
| Haryana | 4514 | 6% |
| Chattisgarh | 1680 | 74% |
| Telangana | 7371 | 67% |
| Sikkim | 89 | 66% |
| Goa | 260 | 62% |
| Meghalaya | 268 | 58% |
| Tripura | 420 | 57% |
| Delhi | 10500 | 55% |
| Manipur | 176 | 50% |
| Kerala | 1463 | 45% |
| Maharastra | 22570 | 39% |
Table 10: Solid waste generation in different states.
Transfer station and transportation
There are three operational transfer stations in Beriwala Bagh, Atul Kataria Chowk and DLF-5 with capacity of around 350 tons per day. Eco-green energy is all set to add four more transfer stations, designated in Haryana State Industrial and Infrastructure Development Corporation (HSIIDC), sector 29, Caterpuri and Dundahera to increase capacity to 800 tons per day. Waste is collected from door to door then transported to transfer stations. To transit waste from source to transfer station eco-green energy has deployed 430 vehicles, including 170 rickshaw. At transfer stations material recovery technology is used for the segregation of waste. Transfer stations are equipped with material recovery technology for the segregation of waste. Ramp facility is provided to aid uploading of the dumper placer containers into compactor machine then finally into a large container. As of now at transfer stations only 15%-20% segregation is done. In spite of deploying the material recovery technology and segregating waste for recycling, it was found that the segregated waste got mixed up again and was simply being compacted and sent to landfill in Bandhwar.
Disposal of waste to landfill
A combined solid waste management plant is set up at Faridabad-Gurugram toll road, Bhandwari. A combined solid waste management plant is set up to process waste for twin cities Faridabad and Gurugram at Bhandwari. Bhandwari landfill site spread in 27.1 acres, is designated at Faridabad-Gurugram toll road, near Bhandwari. The plant can handle 600 tonnes garbage daily. This landfill over 40 feet high, is posing a severe threat to surrounding Aravallis and ecology. This landfill occupies a large area and penetrates the earth for about 20 feet. This 28 acre garbage dump is separated by concrete wall from it’s surrounding. To maintain the stability of the mountain, excavation is done constantly. On the other side of a concrete wall, the concrete wall separates this 28-hectare garbage dump from its surroundings, excavators are constantly at work, rearranging the waste to maintain the stability of the ‘mountain’. Around 800 to 1000 trucks visits the site everyday, and dumps 1000 tonnes of garbage daily. Steamrollers are used to create new inroads among the heaps to allow the trucks to enter and drop more waste. The soil inside the landfill is a darkish brown, giving a preferable condition for maturing leachate which oozes out from under the waste. This pond of leachate along the boundary wall is slowly percolating deep inside the soil and is polluting water table in Aravallis. The topography of Aravallis has many cracks and crevice which easily allows leachate to seep into the soil. Waste dumped at landfill releases a highly combustible gas methane which pollutes the air and also makes site prone to catch fire.
The organic content of waste at Bhandwari is about 39.6% to 81.4% and average moisture content of dried waste is 28.3% (Figure 8).
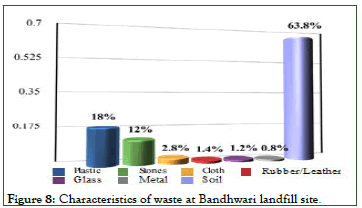
Figure 8: Characteristics of waste at Bandhwari landfill site.
The waste management at Bhandwari is done by eco-green energy, private company. The company has come up with the proposal for power generation plant at the landfill site. This power plant will generate 25 MW of electricity from the dumped waste. For establishment of this power plant 20 acre of land is required, as the landfill surrounds the green belt area it is violating the Forest Act 2006.
Landfill Mining and Reclamation (LFMR) method where landfill is excavated and processed is suggested to the Bhandwari plant. And rest of the waste which cannot be recycled or processed should be capped.
Construction and demolition waste
C and D waste is defined as the waste which is generated during construction, renovation and demolition of buildings or structures. These waste generated may include waste of building materials such as, concrete, bricks, woods and lumber, roofing, dry walls, debris, landscape and other wastes. Construction and demolition remains comprises of fine particles of silica which can enter into lungs and from the lungs, the particles slip into the bloodstream and bring about a range of disease. Silica dust is hazardous for construction workers and others to breathe as it encounters more cases of diabetes, brain fevers, polycystic ovarian disorder and impaired cognitive function in children. C and D waste also has huge impact on environment as it is one of major sources of PM 2.5 and PM10 (Figure 9). It leads to the city enveloped with cloud of dust and contributes to air toxicity.
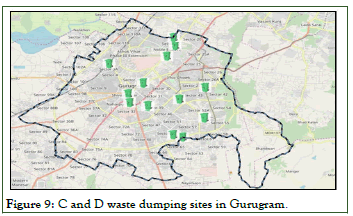
Figure 9: C and D waste dumping sites in Gurugram.
C and D waste is a big challenge for the city Gurugram, which is witnessing excessive construction and infrastructure development activities. On an average C and D waste generation in Gurugram has increased about 700 tonnes per day. There is a serious concern as the waste is dumped along the roads, water recharge bodies and Aravallis. C and D is posing a serious civic, health and traffic related problems in the millennium city. C and D waste in Gurugram is controlled by MCG. There are 13 dumping sites for C and D waste in Gurugram. The waste should be segregated in at sources only in different branches such as bricks and masonry, concrete and steel, soil sand and gravel, wool and plastic, other metals and miscellaneous. Hazardous materials/toxic waste streams, must be kept separately from other waste to avoid further contamination. And disposal must be done according to the C and D waste management rules, 2016. The major components of C and D waste generated can be recycled. The profitable use of recycled waste will reduce the landfill space required and will also save mining of natural resources and will reduce transportation cost.
Conclusion
Steps of action for water and sewage. Rain water harvesting should just be adopted in all the new and existing building. Use of pervious concrete in the pavements, sidewalks etc to recharge ground water. Recharge structures should be made along the storm water drains, to recharge aquifers and to reduce floods in the city. Legislations are already provided an administrative will is required.
Steps of action for landfill. Landfill must be covered immediately before monsoon with proper compaction to prevent infiltration in the time of monsoon. Runoff from landfill to nearby towns and villages must be prevented. Introduce landfill mining and reclamation technology. Landfill must be designed with final cover to minimise infiltration and erosion.
References
- Sivapullaiah PV, Naveen BP, Sitharam TG. Municipal solid waste landfills construction and management-a few concerns. Int J Waste Resour. 2016;6(214):2.
- Shekdar AV, Krishnaswamy KN, Tikekar VG, Bhide AD. Indian urban solid waste management systems-jaded systems in need of resource augmentation. Waste Manag. 1992;12(4):379-387.
- Hazra T, Goel S. Solid waste management in Kolkata, India: Practices and challenges. Waste Manag. 2009;29(1):470-478.
[Crossref] [Google Scholar] [PubMed]
- Kumar KN, Goel S. Characterization of Municipal Solid Waste (MSW) and a proposed management plan for Kharagpur, West Bengal, India. Resour Conserv Recy. 2009;53(3):166-174.
- Narayana T. Municipal solid waste management in India: From waste disposal to recovery of resources? Waste Manag. 2009;29(3):1163-1166.
[Crossref] [Google Scholar] [PubMed]
- Unnikrishnan S, Singh A. Energy recovery in solid waste management through CDM in India and other countries. Resour, Conserv Recycl. 2010;54(10):630-640.
- Vij D. Urbanization and solid waste management in India: Present practices and future challenges. Procedia-Soc Behav Sci. 2012;37:437-447.
- Firdaus G, Ahmad A. Management of urban solid waste pollution in developing countries. Int J Environ Res. 2010;4(4):795-806.
- Srivastava V, Ismail SA, Singh P, Singh RP. Urban solid waste management in the developing world with emphasis on India: Challenges and opportunities. Rev Environ Sci Bio. 2015;14:317-337.
- Chatterjee R. Municipal solid waste management in Kohima city-India. J Environ Health Sci Eng. 2010;7(2):173-180.
- Soni A, Das PK, Kumar P. A review on the municipal solid waste management status, challenges and potential for the future Indian cities. EnvironDev Sustain. 2023;25(12):13755-13803.
- Mani S, Singh S. Sustainable municipal solid waste management in India: A policy agenda. Procedia Environ Sci. 2016;35:150-157.
Citation: Kaur I, Kushwaha J, Khan A (2024) Gurugram: Challenges on Being a Smart City-A Review. Int J Waste Resour. 14:579.
Copyright: © 2024 Kaur I, et al. This is an open-access article distributed under the terms of the Creative Commons Attribution License, which permits unrestricted use, distribution and reproduction in any medium, provided the original author and source are credited.
