Indexed In
- Open J Gate
- RefSeek
- Hamdard University
- EBSCO A-Z
- OCLC- WorldCat
- Publons
- International Scientific Indexing
- Euro Pub
- Google Scholar
Useful Links
Share This Page
Journal Flyer

Open Access Journals
- Agri and Aquaculture
- Biochemistry
- Bioinformatics & Systems Biology
- Business & Management
- Chemistry
- Clinical Sciences
- Engineering
- Food & Nutrition
- General Science
- Genetics & Molecular Biology
- Immunology & Microbiology
- Medical Sciences
- Neuroscience & Psychology
- Nursing & Health Care
- Pharmaceutical Sciences
Research Article - (2020) Volume 9, Issue 1
Geospatial Assessment of Land Use and Land Cover Patterns in the Black Volta Basin, Ghana
Amproche AA1,2*, Antwi M1 and Kabo-Bah AT22Department of Energy and Environmental Engineering, University of Energy and Natural Resources, Ghana
Received: 12-Dec-2019 Published: 06-Jan-2020, DOI: 10.35248/2469-4134.20.9.269
Abstract
The Black Volta Basin in Ghana has experienced some losses in its productive lands due to mining. This study assessed the Land use/cover (LULC) changes within the Basin for a period of eighteen years, and mapped current and potential mining hotspots in the Basin. The study used multispectral Landsat images for the years 2000, 2015 and 2018. Supervised classification method and Spectral Angle Mapper were used to classify and map the LULC types. Feature-based extraction method was then used to delineate mining sites along the River in the Basin. Six (6) LULC types were classified. Findings from the study revealed that four of the classified LULC experienced some form of decline between the years 2000 and 2018, except Bareland and settlements which consistently increased within the period, with Barelands recording the highest increase of 21% between 2000 and 2015 and 18% between 2015 and 2018, signaling a sharp increase in the three year period. From the feature-based extraction, 312 segments of an average area of 8.4 km2 of each segment were found to be mining sites from the 2018 image analysis, which is about 80% of the total Bareland in 2018. Likewise, 146 segments of an average area of 3.9 km2 of each segment were found to be potential mining sites. This implies that mining within the basin is threatening other LULC and hence, reclamation and restoration activities need to be intensified. The outcome of this research could facilitate technological strategies towards restoration projects within the Basin.
Keywords
Land use; Black volta basin; Small scale mining; Potential mining sites; Feature base extraction; Ghana
Introduction
Mining of natural resources, especially gold is a significant anthropogenic source of pollution to water bodies and vegetation cover across the world. This is because through the activities of mining, at all scales of operation, large quantities of water and vegetation have been abstracted and discharged from and to surrounding freshwater and land ecosystems polluting them [1,2]. The destruction of water bodies and vegetation has disrupted continuous water supply [3] and food security in many West African countries, especially Ghana due to the inability to sustainably manage the activities of mining [4]. This was confirmed by the World Water Council that reported that the recent water crisis across the world cannot be attributed to the fact that there is not enough available water [5], but rather the ability to manage these water resources in order to assess them. This situation is no different from mining operations along the Black Volta River stretch in Ghana which have recently increased since the influx of small scale miners in the area [6].
Parts of the Black Volta River have been silted and dammed to obstruct the flow of the river by miners, and vegetation cover removed in order to search for minerals underground and these activities raise a concern for environmental protection. Consequently, the LULC pattern within the catchment has changed variably, with the majority of the existing LULC being converted to mine sites. For instance, deforestation, in the Western part of Ghana, has been reported to be 58%, with 45% loss in farmlands due to gold mining [7]. Hence this requires assessment for decision making.
The mining sector is normally under-resourced, unorganized, under-regulated, and short-lived and these factors contribute to the unlawful transitions of other LULC to mining sites [8]. Therefore these miners and policy makers mostly do not assess the extent of land being used for their activities, and the threats they pose to other LULC in the catchment of their operation areas. Meanwhile, reports indicate that about 25 million people are employed in this sector globally [9,10]. In the Northern Region of Ghana specifically, where this study is situated, more than 10,000 miners have emerged by the year 2012 from a population of a few dozen farmers in 2010 [9], and the reports across the country about the mining effect on the natural vegetation are alarming [11-13]. Even though the mining sector contributes to about 15% of Ghana’s GDP, land use such as agriculture contributes 41% to the country ’ s GDP while providing employment to about 60% of the population who are in active work. Nevertheless, mining is gradually claiming and destroying the majority of the farmlands, with the farmlands also spreading into adjacent forests [14].
The application of geospatial technologies in the field of LULC assessment, whereby Remote sensing and Geographic Information Systems (GIS) techniques are used to study and distinguish between features on the earth surface have proven to be effective in quantifying and monitoring earth resources [15]. In this way, the extent and severity of the small scale mining in the Black Volta Basin in terms of spatial distribution, temporal changes and severity of degradation could be assessed [16]. Satellite images of both past and present land uses at the basin could help characterize land use of interest. In the field of mining, for instance, satellite images have played important roles in the assessment and monitoring of the impacts that these mining activities have on the environment [17,18]. Studies conducted by Telmer and Stapper [19] in Indonesia and Brazil, Zoheir and Emam [20] in Egypt and Lobo [21] in the Amazonian waters all used satellite imageries to assess the environmental implications of mining. In the study by Basommi [17], analyses of the satellite imageries indicated that vegetation indices of the Wa West District of Ghana have decreased from 48% to 11% between 1991 and 2014, and the major driver for this decrease was mining.
This study aims to use remote sensing and GIS techniques to (i) assess the LULC changes and patterns within the Black Volta River Basin as well as to (ii) delineate and map current and potential small-scale mining sites to assist policy makers on environmental protection interventions within the Basin.
Materials and Methods
Study area description
The Black Volta Basin forms part of the North-Western River System of Ghana, and is geographically located between latitudes 7° 21′ 0″ and 11° 0′ 0″ North and longitudes 3° 0′ 0″ and 1° 0′ 0″ West (Figure 1). The basin covers an area of about 18, 384 km2 constituting 14% of the basin and six (6) sub-catchments. Administratively, the basin covers 26 districts (out of the 216 District demarcations) in Ghana. The host of the basin is the Upper West Region and covers a portion of about 8,370 km2 (6%) of the basin in Ghana, out of the total portion of 42% of the Volta basin in West Africa [21,22]. The basin is characterized by extreme drought conditions due to climate change [23], which is driven by vegetation cover losses. The predominant land use of the Black Volta basin is Agriculture. However, with the resurfacing and intensification of small scale surface mining, which was mildly done in the 17th and 18th centuries [24], lots of the agricultural lands are being lost to mining.
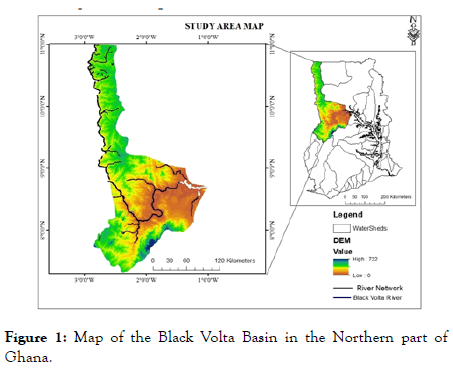
Figure 1. Map of the Black Volta Basin in the Northern part of Ghana.
Spatial data collection and source
Satellite imageries were obtained from Landsat archives of the U.S Geological Survey (USGS) and Earth Observation database. The spatial dataset considered were four different Landsat scene images of 30 m resolution for the years 2000, 2015 and 2018. The study employed ground-truthing procedures to validate the obtained spatial datasets using ground observations obtained from Google earth imagery. Table 1 presents a summary of the source and date of acquisition of the images. These imageries were selected based on their significance to the study in terms of year differences and availability to download from the internet which is relatively cheaper. To avoid bias in the image analysis, the images of the same season (dry season), free from cloud cover and having the same identifiable features were selected. The dry season images were to better distinguish the spectral signatures of the different LULC types in the basin. The selected images also provided uniform radiometric and spectral characteristics which reduced seasonal variation in the spectral reflectance of the land cover data-sets for the three different years [25]. The images were georeferenced to the coordinate system of the study area i.e. WGS 84, projection; UTM Zone 30°N.
| Landsat imagery | Satellite Sensor | WRS Path/Row | Date of Acquisition | Spatial Resolution | Spectral Resolution | Source |
|---|---|---|---|---|---|---|
| 1 | Landsat 7 ETM+ | 194/054 | 01-11-2000 | 30 m | 8 bands | Earth explorer |
| 195/055 | ||||||
| 2 | 195/054 | 1/18/2000 | ||||
| 195/053 | ||||||
| 3 | Landsat 8 OLI | 195/053 | 1/18/2015 | 30 m | 11 bands | |
| 02-11-2018 | ||||||
| 4 | 195/054 | 1/18/2015 | ||||
| 02-11-2018 | ||||||
| 5 | 195/055 | 1/18/2015 | ||||
| 01-10-2018 | ||||||
| 6 | 194/054 | 1/27/2015 | ||||
| 1/19/2018 |
Table 1: Landsat Images Used in the Analysis of Land-Cover Change; OLI – Operational Landsat Imager.
Data analysis
The acquired Landsat imageries were analysed using ArcGIS 10.5, ENVI 5.3, MS Excel software and Google earth. Figure 2 provides a summary of the analysis procedures for the images.
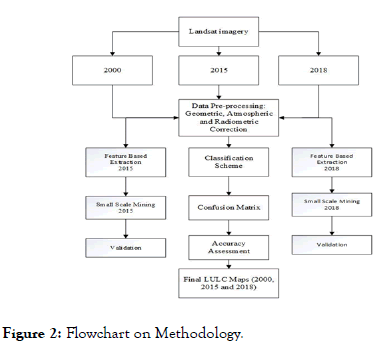
Figure 2. Flowchart on Methodology.
Image classification
The different LULC of the Black Volta Basin were classified and mapped from digital Landsat image through the process of supervised digital image classification as described by Shalaby and Tateishi [26]. The overall objective of the image classification procedure was to categorize all image pixels into LULC classes. The Spectral Angle Mapper (SAM) supervised classification algorithm in ENVI 5.3 was then used to classify the images into different LULC based on the spectral signatures of the features. A stratified random sample of approximately 372 representative training points were collected from the image subset for facilitating the implementation of the classification of the LULC from the imagery. The problem of mixed pixels was addressed through visual interpretation of the imagery [27]. Each spectrum derived by the SAM was treated as a vector in Ndimensional space, where N is equal to the number of bands in the image [28-30]. The resulting angle varied between 0° and 90°. The formula for the Spectral Angle Mapper classification [31,32] is detailed in Figure 3.
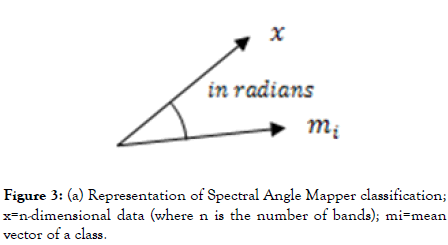
Figure 3. (a) Representation of Spectral Angle Mapper classification; x=n-dimensional data (where n is the number of bands); mi=mean vector of a class.

Mathematically, SAM classifies the spectral signatures of features as:
α=angle formed between reference spectrum and image spectrum
X=image spectrum
Y=reference spectrum [33]
Classification of the various LULC at the study area was based on prior knowledge of the study area. The derived major LULC classes were six (6) namely: Closed Savannah, Open Savannah, Agriculture, Water bodies, Settlements and Bareland. These classes were based on the Ghana LULC classification scheme for visual classification of remote sensing data as described for the catchment [18] and presented and described in Table 2.
| LULC Categories | Description |
|---|---|
| Closed Savannah | These include areas that closely resemble a forest cover and reserved areas; gazette forest reserves/protected areas and natural growths. It has a tree population density of more than 150 trees per hectare. |
| Open Savannah | Sacred groves/planted woodlots/thick shrubs. This class has less tree cover than the close Savannah. It has a tree population density between 75 and 150 trees per hectare. |
| Cropland | These include areas with agriculture crops. |
| Water bodies | Rivers, pool of water or dams |
| Settlements | Towns, farm house and huts. |
| Bareland | Areas of land with no forest and vegetation cover including mining surfaces. |
Table 2: Description of Land Use/Cover Types in Catchment of the Black Volta Basin in Ghana.
Assessment of the validity and accuracy of the classification ascertained the percentage of correctly classified pixels in the image. The accuracy assessment was performed using 97 points, based on ground truth data and visual interpretation. The comparison of reference data and classification results was carried out statistically using confusion matrices which evaluated the user’s and the producer’s accuracy. The accuracy of the 97 ground truth points was tested using a stratified random sample. Table 3 presents the overall accuracy values and the Kappa Statistics of the classified image. Kappa coefficient (K), gives a discrete multivariate technique used in accuracy assessment, thus K>0.80 gives a strong accuracy or agreement of the class assessed, 0.40-0.80 is average and <0.40 is poor [33].
| Classes | 2000 | 2015 | 2018 | |||
|---|---|---|---|---|---|---|
| Area | ||||||
| (km2) | (%) | (km2) | (%) | (km2) | (%) | |
| Closed Savannah | 11086 | 34 | 10198 | 31 | 9537.1 | 29 |
| Open Savannah | 16093 | 49 | 11504 | 35 | 9707.6 | 30 |
| Agriculture | 4773.1 | 15 | 6090.7 | 19 | 6285.5 | 19 |
| Water bodies | 202 | 0.6 | 397 | 1.2 | 361.8 | 1.1 |
| Settlements | 364.2 | 1.1 | 3146.6 | 9.6 | 3488 | 11 |
| Barelands | 151.5 | 0.5 | 1333.9 | 4.1 | 3289.5 | 10 |
| Total | 32669 | 100 | 32669 | 100 | 32669 | 100 |
Table 3: Area Coverage of Land Use/Cover Classes of the Years 2000, 2015 and 2018.
The formulae given below were used to determine the kappa coefficient (K) and overall accuracy respectively;

Where; N is the total number of observations in the matrix, r is the number of rows in the matrix,  is the number of observations in row i and column i,
  is the total for row i and
  is the total for column I [34].

Mining sites extraction with rule-based classification
Rule-based classification process groups segmented images into similar pixel clusters. This process was used to extract mining sites into segments and further grouped into mining hotspot and potential mining sites based on similar spectral signatures from the satellite image. Spectral characteristics were computed on each band of the input image. The characteristic value for a particular pixel cluster was computed from an input data band where the segmentation label image had the same value implying that all pixels in the same pixel cluster contributed to the attribute calculation. The calculations were based on minimum, maximum, mean, and standard deviation value of the pixels comprising the region in bands. Spatial characteristics of the area were computed from the polygon defining the boundary of the pixel cluster. The computations were based on area, compactness, and length. And finally, textural characteristics were also computed on each band of the input image. Texture characteristic computation is a two-step process where the first pass applies a square kernel of pre-defined size to the input image band. The characteristics were calculated for all pixels in the kernel window and the result is referenced to the center kernel pixel. Next, the characteristic results were averaged across each pixel in the pixel cluster to create the characteristic value for that band ’ s segmentation label, and were finally characterized into their respective mining and potential mining sites based on the identified spatial characteristics.
Results and Discussion
The proportion of derived major LULC classes which dominated the catchment of the Black Volta Basin (Figures 4-6) for the three different years (2000, 2015 and 2018) have been presented in Table 3. The estimations of the generated maps for the different LULC categories fall within the lower and upper bound of the true areas at the 95% confidence level. Quantitative analysis of areal coverage and extent of the LULC classes indicated that Open Savannah is the major LULC, followed by Closed Savannah, Agriculture, Settlements, Barelands and Water bodies, respectively. This pattern remained same for all the years selected, except that their coverage changed over the years. Open Savannah consistently decreased in all the years from 16,093.1 km2 in 2000 to 9,707.6 km2 in 2018. Closed Savannah also followed a similar pattern. The other land uses however experienced gains in the area coverage, with Barelands obtaining a coverage of 3289.5 km2 in 2018 from a coverage of 1333.9 km2 in 2015, representing a 6% gain in area extent coverage, which was the highest land use gain in three-year intervals (Tables 3 and 4)
| Year | Classified Image | Overall Accuracy (%) | Kappa Coefficient (k) |
|---|---|---|---|
| 2000 | Landsat ETM | 88.1 | 0.79 |
| 2015 | Landsat 8 OLI | 90 | 0.81 |
| 2018 | Landsat 8 OLI | 76.3 | 0.68 |
Table 4: Summary of Overall Accuracy and Kappa coefficient (k) based on 97 ground truth data points at the 95% confidence level.
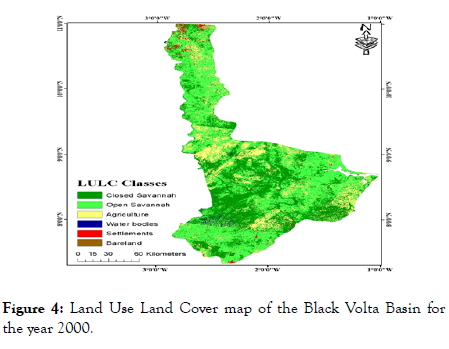
Figure 4. Land Use Land Cover map of the Black Volta Basin for the year 2000.
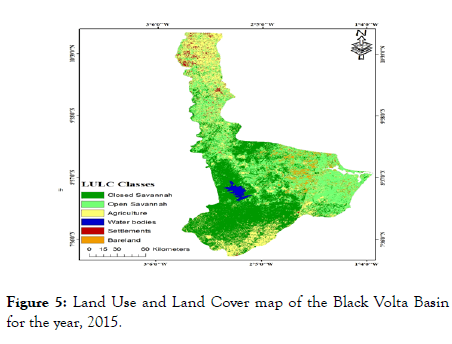
Figure 5. Land Use and Land Cover map of the Black Volta Basin for the year, 2015.
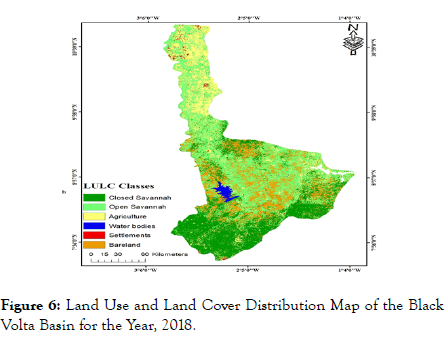
Figure 6. Land Use and Land Cover Distribution Map of the Black Volta Basin for the Year, 2018.
The spatial distribution of the derived LULC classes of the study area in the year 2000 with Barelands having less coverage. Closed and open Savannah dispersed across the landscape with fewer agricultural lands and settlement.
Figure 5 also shows the dispersal of open Savannah across the landscape in the year 2015. These were frequently associated with settlements, which were concentrated in the upper portion of the Basin. Water bodies and Barelands also expanded in area extent in the central portion. The expansion of the water bodies in 2015 (from 202 km2 in 2000 to 397 km2 in 2015) resulted mainly from the construction of the Bui dam along the Black Volta River in the year 2009 [17], as shown in the 2015 and 2018 images. Notwithstanding, the presence of the Bui Dam could not increase the space occupied by water in the year 2018 as the water coverage declined to 361 km2.
In the year 2018, Closed Savannah was mainly in the South- Western part of the study area, whiles Open Savannah decreased across the entire landscape (Figure 6). Settlements and Barelands increased in their area extent while water bodies decreased and were mostly in the East and Western portion. Barelands increased in the central portion within the basin along the main Black Volta River and the increase in barelands could be attributed to the activities of small scale mining [35]. The increase in barelands and decrease in vegetation occurred mostly around the Dam site in the 2015 and 2018 satellite imageries. This results confirms the study by Akrasi [36] which reports that illegal mining contributes to deforestation within basins in Ghana. According to the Water Resources Commission of Ghana, illegal mining is the major challenge and threat facing the Black Volta Basin with its associated challenges such as deforestation, siltation of water bodies, lack of information data covering the site, among others [37].
Obtained results for the areas and proportions of change from one thematic class to another between the periods explained the magnitudes and directions of the LULC transitions from the year 2000 to 2015 and from 2015 to 2018 (Table 5). From the fifteen (15) years period, an area of 12065 km2 representing 37% of the total area remained unchanged, while Closed Savannah lost 7301 km2 (22%) to other land uses. Open Savannah lost 8592 km2 (26%) to other land use, Agriculture loss to other land uses was 4150 km2 (13%), and Water Bodies lost 188 km2 (0.6%) to other land uses. Settlements and Bareland both lost a total of 374 km2 (1%) land cover to other land uses. From the transition, Bareland gained an area of 6850 km2 (21%) from other land cover between 2000 and 2015.
| Transition from land use | Transition to other land uses | Area | (2000-2015) | Area | (2015-2018) |
|---|---|---|---|---|---|
| km2 | (%) | km2 | (%) | ||
| Areas of no change | 12065 | 36.9 | 14900 | 45.6 | |
| Closed Savannah | Open Savannah | 2945.6 | 9 | 3122.3 | 9.6 |
| Agriculture | 785.3 | 2.4 | 387.1 | 1.2 | |
| Water bodies | 243 | 0.7 | 2.1 | 0.01 | |
| Settlements | 100.1 | 0.3 | 2.3 | 0.01 | |
| Bareland | 3226.8 | 9.9 | 3300 | 10.1 | |
| Open Savannah | Closed Savannah | 2503.3 | 7.7 | 1512.8 | 4.6 |
| Agriculture | 2009.4 | 6.2 | 2458.9 | 7.5 | |
| Water bodies | 93.9 | 0.3 | 0.3 | 0 | |
| Settlements | 657.7 | 2 | 19.9 | 0.1 | |
| Bareland | 3327.5 | 10.2 | 2460.9 | 7.5 | |
| Agriculture | Closed Savannah | 1718.8 | 5.3 | 2053.5 | 6.3 |
| Open Savannah | 1897.4 | 5.8 | 950.77 | 2.9 | |
| Water bodies | 3.4 | 0.01 | 0.3 | 0 | |
| Settlements | 247.5 | 0.8 | 54.2 | 0.2 | |
| Bareland | 282.6 | 0.9 | 198.1 | 0.6 | |
| Water bodies | Closed Savannah | 124.3 | 0.4 | 8.54 | 0.03 |
| Open Savannah | 14.3 | 0.04 | 14.31 | 0.04 | |
| Agriculture | 10.3 | 0.03 | 1.24 | 0 | |
| Settlements | 39 | 0.1 | 0.4 | 0 | |
| Bareland | 0.1 | 0 | 13 | 0.04 | |
| Settlements | Closed Savannah | 14.8 | 0.1 | 2.78 | 0.01 |
| Open Savannah | 67.2 | 0.2 | 99.25 | 0.3 | |
| Agriculture | 143.2 | 0.4 | 356.42 | 1.09 | |
| Water bodies | 0 | 0 | 0.02 | 0 | |
| Bareland | 13.4 | 0.04 | 13.45 | 0.04 | |
| Bareland | Closed Savannah | 35.9 | 0.1 | 0 | 0 |
| Open Savannah | 78 | 0.2 | 423.2 | 1.3 | |
| Agriculture | 12.2 | 0.04 | 248.6 | 0.8 | |
| Water bodies | 1.5 | 0 | 0.04 | 0 | |
| Settlements | 8.1 | 0.02 | 8.6 | 0.2 |
Table 5: Thematic Change Analysis of Land Use/Cover Transitions to Other Uses for the Eighteen Years Period from 2000 to 2015 and from 2015 to 2018.
Thematic change analysis from the year 2015 to 2018 showed that an area of 14900 km2 (46%) during the three-year period witnessed no change. Closed Savannah lost 21% of its total area to other land uses. Bareland gained an area of 18% from other land uses and lost only 2% to other land uses between 2015 and 2018. Comparatively, the loss of other LULC to Barelands between 2015 and 2018 was more intense and rapid than between 2000 and 2015. The loss of 2% Bareland to other land uses indicate that conversion of the degraded lands to other land uses was a great challenge during the three years period due to severe environmental pollution from the mining activities [38]. This is because pollutants from mining operations as well as intensification of small scale mining hinder reclamation efforts [7]. In addition, reclamation and restoration efforts within the Basin could be considered as marginal as reported by Ghanash [39] who studied the spatial changes in Lake Volta in Ghana.
Based on the feature base rule extraction, small scale and potential mining sites were delineated and mapped to show areas of mining or where mining is likely to take place. Figure 7 shows a map of mining hotspots and potential mining sites along the Black Volta River in Ghana. Spectral features provide information about the spectral response of objects, as captured by the sensors [40]. Results from the feature-based extraction presented 312 segments of areas with average of 8.4 km2 of each segment to be mining sites from the 2018 satellite images.
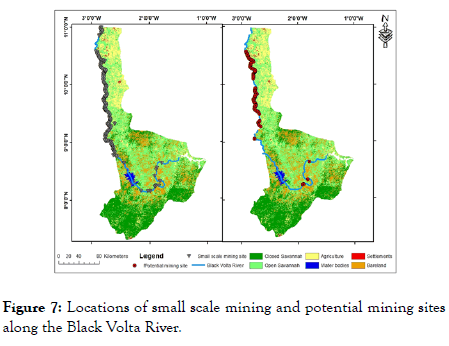
Figure 7. Locations of small scale mining and potential mining sites along the Black Volta River.
Potential mining sites were found to be 146 segments of areas with an average of 3.9 km2 for each segment. Feature base extraction analysis revealed that the small-scale mining make up about 80% of the Bareland coverage (3289.5 km2) (Table 5) in the 2018 image. This finding confirms the study by Adanu and his team [41] who reported that small scale mining is a direct driver of land degradation in the Savannahs of Northern Ghana where this study is situated. And similarities in spatial characteristics of other LULC indicate that an area of about 569.4 km2 has a potential of being mined. This requires stringent measures to avoid further destruction of the other useful LULC in the Black Volta Basin.
Conclusion
Remote sensing and GIS techniques were used to analyse and map the LULC dynamics in the Black Volta River Basin in Ghana with Landsat imageries. Analysis of the change dynamics within an 18 years period exposed transitions of one LULC to another. The dominant LULC change pattern observed in the basin was the conversion of Closed Savannah to Bareland (10%) and Open Savannah to Bareland (10%). Bareland which occupied 151.5 km2 (0.5%) of the total basin area in 2000 advanced to 3298.1 km2 (10%) in 2018. Even though Open Savannah remained the major LULC within the basin, its coverage continuously declined from the year 2000 to 2018, with Bareland benefitting continuously in all these years thereby increasing its coverage. This observation corresponded to the remarkable degraded patches that were found in the 2015 and 2018 satellite images when small scale mining became intensive within the basin.
Generally, the direct drivers of deforestation in the Black Volta River basin have been identified as Fuel wood, agriculture expansion, small scale mining and infrastructure development. However, results from the LULC classification and the featurebased extraction of mining sites showed that small scale mining was the dominant driver of deforestation in the Black Volta Basin between the years 2000 and 2018, responsible for about 80% of the Barelands in 2018. The findings indicated that the mining activities in the basin sharply increased from 2015 to 2018, when Barelands gained 18% area coverage from other land uses as compared to the 21% gain between 2000 and 2015, resulting in vegetation and water coverage decline. The study recommends that the mining commission and Environmental Protection Agency of Ghana should reinforce the need to regulate land concession and mining activities within the Basin. Reclamation and restoration projects should be intensified in order to manage degraded mine sites.
REFERENCES
- Gritzner ML, Marcus WA, Aspinall R, Custer SG. Assessing landslide potential using GIS, soil wetness modeling and topographic attributes, Payette River, Idaho. Geomorphology. 2001:37;149-165.
- Kusimi JM. Assessing land use and land cover change in the Wassa West District of Ghana using remote sensing. GeoJournal. 2008;71;249-259.
- Macdonald KF. Impacts of artisanal and large scale gold mining on tropical rivers in West Africa: A case study from the Brong Ahafo Region of Ghana. 2016.
- Paganini M, Petiteville I, Ward S, Dyke G, Steventon M, et al. Satellite Earth Observations in Support of the Sustainable Development Goals. Euorpean Space Agency. 2018.
- Bagchi D, Bussa R. Application of Remote Sensing in Water Quality and Water Resources Management An Overview. Silver Jubilee Publication-II. 2016;25:39.
- Prosper L, Guan Q. Analysis of land use and land cover change in Nadowli District, Ghana. In: 2015 23rd International Conference on Geoinformatics. 2015.
- Schueler V, Kuemmerle T, Schroder H. Impacts of surface gold mining on land use systems in Western Ghana. Ambio. 2011;40: 528-539.
- Bridge G. Contested terrain: mining and the environment. Annu Rev Environ Resour. 2004;29:205-259.
- Ferring D, Hausermann H, Effah E. Site specific: Heterogeneity of small-scale gold mining in Ghana. The Extractive Industries and Society. 2016;3:171-184.
- Hruschka F, Echavarria C. Rock-solid chances for responsible artisanal mining. Arm Series on Responsible ASM 3. 2011.
- Aryee BN. Ghana's mining sector: its contribution to the national economy. Resources Policy. 2001;27:61-75.
- Hilson G, Yakovleva N. Strained relations: A critical analysis of the mining conflict in Prestea, Ghana. Political Geography. 2007; 26:98-119.
- Hilson GM. Structural adjustment in Ghana: Assessing the impacts of mining-sector reform. Africa Today. 2004;53-77.
- IBP. Mining laws and regulations handbook: Strategic information and basic laws. International Business Publications, USA. 2015.
- EL-kawy ORA, Ismail HA, Yehia HM, Allam MA. Temporal detection and prediction of agricultural land consumption by urbanization using remote sensing. The Egyptian Journal of Remote Sensing and Space Science. 2019.
- Dwivedi R. Geospatial Technologies for Land Degradation Assessment and Management. CRC Press. 2018.
- Basommi PL, Guan Q, Cheng D. Exploring Land use and Land cover change in the mining areas of Wa East District, Ghana using Satellite Imagery. Open Geosciences 7. 2015.
- Snapir B, Simms DM, Waine TW. Mapping the expansion of galamsey gold mines in the cocoa growing area of Ghana using optical remote sensing. International journal of applied earth observation and geoinformation. 2017;58:225-233.
- Telmer K, Stapper D. Evaluating and monitoring small scale gold mining and mercury use: Building a knowledge-base with satellite imagery and field work. United Nations Industrial Development Organization: Victoria, BC, Canada. 2007.
- Zoheir B, Emam A. Integrating geologic and satellite imagery data for high-resolution mapping and gold exploration targets in the South Eastern Desert, Egypt. Journal of African Earth Sciences. 2012;66:22-34.
- Lobo FL, Costa MP, Novo EM. Time-series analysis of Landsat-MSS/TM/OLI images over Amazonian waters impacted by gold mining activities. Remote Sensing of Environment. 2015;157:170-184.
- Shaibu S, Odai SN, Adjei KA, Osei EM, Annor FO. Simulation of runoff for the Black Volta Basin using satellite observation data. International journal of river basin management. 2012;10:245-254.
- Kasei R, Diekkruger B, Leemhuis C. Drought frequency in the Volta basin of West Africa. Sustainability science. 2010;5:89.
- Andah WE, Giesen NVD, Biney CA. Water, climate, food, and environment in the Volta Basin. Contribution to the project ADAPT. Adaptation strategies to changing environments. 2003.
- Nzunda HP. Impacts of mining activities on land cover and forest stock in Mbozi district, Mbeya region, Tanzania. 2013.
- Shalaby A, Tateishi R. Remote sensing and GIS for mapping and monitoring land cover and land-use changes in the Northwestern coastal zone of Egypt. Applied Geography. 2007;27:28-41.
- Butt A, Shabbir R, Ahmad SS, Aziz N. Land use change mapping and analysis using Remote Sensing and GIS: A case study of Simly watershed, Islamabad, Pakistan. The Egyptian Journal of Remote Sensing and Space Science. 2015;18:251-259.
- Kuching S. The performance of maximum likelihood, spectral angle mapper, neural network and decision tree classifiers in hyperspectral image analysis. Journal of Computer Science. 2007;3:419-423.
- Mohamed MM, Elmahdy S. Land Use/Land Cover Changes Monitoring and Analysis of Dubai Emirate, UAE Using Multi-Temporal Remote Sensing Data. EPic Series in Engineering. 2018;3:1435-1443.
- Petropoulos GP, Vadrevu KP, Xanthopoulos G, Karantounias G, Scholze M. A comparison of spectral angle mapper and artificial neural network classifiers combined with Landsat TM imagery analysis for obtaining burnt area mapping. Sensors. 2010;10:1967-1985.
- Kruse FA, Lefkoff A, Boardman J, Heidebrecht K, Shapiro A, et al. The spectral image processing system (SIPS)—interactive visualization and analysis of imaging spectrometer data. Remote sensing of environment. 1993;44:145-163.
- Yuhas RH, Goetz AF, Boardman JW. Discrimination among semi-arid landscape end members using the spectral angle mapper (SAM) algorithm. 1992.
- De Carvalho Jr O A, Meneses P R. Spectral Correlation Mapper : An improvement on the Spectral Angle Mapper. Summaries of the 9th Airborne Earth Science Workshop. 2000.
- Kraemer HC. Kappa coefficient. Wiley StatsRef: Statistics Reference Online. 2014;1-4.
- Akrasi S, Ansa-Asare O. Assessing sediment and nutrient transport in the Pra Basin of Ghana. West African Journal of Applied Ecology. 2008;13:45-54.
- Akrasi S. Sediment discharges from Ghanaian rivers into the sea. West African Journal of Applied Ecology. 2011;18:1-13.
- WRC. Annual Report of the Water Resources Commission of Ghana.
- Plieninger T, Gaertner M. Harnessing degraded lands for biodiversity conservation. Journal for Nature Conservation. 2011;19: 18-23.
- Ghansah B, Asare YM, Tchao ET, Forkuo EK. Mapping the spatial changes in Lake Volta using multitemporal remote sensing approach. Lakes & Reservoirs: Research & Management. 2016;21:206-215.
- Pena-Barragan JM, Ngugi MK, Plant RE, Six J. Object-based crop identification using multiple vegetation indices, textural features and crop phenology. Remote Sensing of Environment. 2011;115:1301-1316.
- Adanu SK, Mensah FK, Adanu SK. Enhancing Environmental Integrity in the Northern Savanna Zone of Ghana: A Remote Sensing and GIS Approach. J Environ Earth Sci. 2013;3:67-77.
Citation: Amproche AA, Antwi M, Kabo-Bah AT (2020) Geospatial Assessment of Land Use and Land Cover Patterns in the Black Volta Basin, Ghana. J Remote Sens GIS. 9:269. DOI: 10.35248/2469-4134.20.9.269
Copyright: ©2020 Amproche AA, et al. This is an open-access article distributed under the terms of the Creative Commons Attribution License, which permits unrestricted use, distribution, and reproduction in any medium, provided the original author and source are credited.
