Indexed In
- Open J Gate
- RefSeek
- Hamdard University
- EBSCO A-Z
- OCLC- WorldCat
- Publons
- International Scientific Indexing
- Euro Pub
- Google Scholar
Useful Links
Share This Page
Journal Flyer

Open Access Journals
- Agri and Aquaculture
- Biochemistry
- Bioinformatics & Systems Biology
- Business & Management
- Chemistry
- Clinical Sciences
- Engineering
- Food & Nutrition
- General Science
- Genetics & Molecular Biology
- Immunology & Microbiology
- Medical Sciences
- Neuroscience & Psychology
- Nursing & Health Care
- Pharmaceutical Sciences
Research Article - (2024) Volume 13, Issue 1
Geospatial Analysis of Fuel and Gas Station Distribution: Evaluating the Compliance and Impact of Station Siting on Public Health and Safety in Kumasi, Ghana
Richard Boadu Antwi1*, Stephen Okai2, Jonathan Quaye-Ballard3 and Eren Erman Ozguven12Department of Geomatic Engineer, Lands Commission, Accra, Ghana
3Department of Geomatic Engineering, Kwame Nkrumah University of Science and Technology, Kumasi, Ghana
Received: 22-Jan-2024, Manuscript No. JGRS-24-24674; Editor assigned: 25-Jan-2024, Pre QC No. JGRS-24-24674 (PQ); Reviewed: 08-Feb-2024, QC No. JGRS-24-24674; Revised: 15-Feb-2024, Manuscript No. JGRS-24-24674 (R); Published: 22-Feb-2024, DOI: 10.35248/2469-4134.24.13.330
Abstract
In this paper, locations of the various fuel and gas stations in the Kumasi Metropolis, Ghana were geospatially analysed against the standards set by Environmental Protection Agency (EPA), and Kumasi Metropolitan Assembly and Town and Country Planning Department. Global Positioning System Garmin 62S was used to capture the location of the fuel and gas stations whereas the boundary shapefile, road shapefile and Digital Elevation Model (DEM) of Kumasi were obtained from the Kumasi Metropolitan Assembly and Survey and Mapping Division of Lands Commission. Spatial locations of the gas and fuel stations were integrated into the map of Kumasi in ArcMap environment of ArcGIS 10.3.1 in WGS84 coordinate system. All the analyses were performed in ArcMap environment using spatial statistics, spatial analyst, and proximity tools available in the software. Findings revealed that out of the 153 fuels and gas stations in the study area, 86% are owned by independent marketers and 14% owned by the Government. 69% of the fuel stations and 36% of the gas stations did not meet the criteria of 500 m and 1,000 m minimum distance to other stations located either on same side of the road or across the road. In addition, 14% of the stations did not meet the 100 m minimum distance requirement to roads. 39% of the fuel stations and 67% of the gas stations were built at critical areas that harmfully affect public institutions in the city. Generally, 18% of the fuel/gas stations met all EPA requirements, 51% disobeyed only one requirement, 24% disobeyed two, and 7% disobeyed all three requirements. 16% of them are located at areas with very low elevations and will be affected by runoff water and possibly can be flooded. 21% out of the 41 recorded health centres were affected by improper siting of fuel/gas stations. 37 out of the 41 health centres and 3 out of the 4 recorded fire service stations are in close proximity to these stations and are in the position to respond to emergency cases. The findings of this research clearly indicate that regulatory agencies need to look into the station siting and how they follow up EPA requirements more critically and react accordingly.
Keywords
Gas Stations; Geographic Information Science (GIS); Remote sensing; Database; Environmental Protection Agency (EPA); Spatial analysis; ArcMap; Kumasi
Introduction
Background information
A gas station is any land, building or equipment used for the sale or dispensing of petrol or oils for vehicles or incidental there to and includes the whole of the land, building or equipment whether or not the use as a petrol station is the predominant use or is only a part there [1,2]. It is a facility which sells fuel and lubricants for motor vehicles [3]. A fuel station in Ghana is defined as an establishment that renders the services of petrol, diesel, kerosene, and engine lubricants to motor vehicles. Though gas is a fuel but in Ghana it is separated from the other fuels due to its delicate nature and the special attention it demands, hence the name Fuel/Gas stations. A person who owns or runs a business that sell petrol/gas to retailers is a petrol/gas retailer.
There is high demand of land for socio-economic services in most large urban areas and this high land search often leads to jumbling of land and unlawful changeover of the use of land, leading to random and scattered development and the people knowingly locating petrol filling stations in poor areas that are very prone to hazard [4]. The Kumasi metropolis in Ghana, due to increase in population and issues that are related to development and planning, faces challenges in the distribution of service centres. As a result, the rapid population growth has led to the construction of many fuel and gas stations to attend to the needs of the population. Owners briskly build these stations and skip the necessary processes and requirements fuel and gas stations have to meet before they can be built. Traffic congestion is a common feature at these stations situated very close to each other, near a marketplace or next to a road intersection or junction. Also, traffic congestion occurs during loading and unloading of passengers and goods around the premises of petrol stations [5]. Hence, it is significant to study the spatial analysis of the distribution and location of fuel and gas stations in Kumasi metropolis as well as their relation to health centres and fire service stations using Geographic Information System (GIS) techniques to produce a suitable and esthetic environment for working and living. GIS has a wide scope of capabilities when it comes to data input, manipulation and analysis using geoprocessing tools such as nearest neighbour, buffering, route and network analysis tools etc. [6]. The representation of analysed data with maps, the task of geospatially analysing fuel and gas stations in the Kumasi metropolis especially against Environmental Protection Agency (EPA) and Kumasi Metropolitan Assembly (KMA) standards as well as their relation to health centres and fire service can easily be accomplished using GIS [7].
On the basis of the challenges stated above, this research seeks to use GIS to make a spatial analysis pertaining to the location of fuel and gas stations in the Kumasi metropolis against the physical planning and environmental standards by considering their relation to health centers and fire service stations. This will help identify the locations of the various stations available at the various parts of the metropolis and determine the kinds of services offered by these stations with the attribute inventory created in the database. It will also help identify various locations of the health centers and fire service stations in the metropolis, providing a link between the former and the latter. Consequently, the populace will know where to go for any specific service they need and how to navigate easily to a health facility or react and respond to emergency cases.
Research motivation
Kumasi is an established town in Ghana with a development plan by KMA and suffers problems like traffic congestion, air pollution, explosion and fire outbreaks, encroachment on right of way of the road network, owing to refusal to conform to planning laws by the residents. According to Boateng et al. filling station is a major contributor to road traffic problems in a highly builtup environment like Kumasi. The levels of these problems rest on conditions such as location, size and holdup from roads, and others. The areas near to filling stations witness noise, congestion, and other road traffic related problems, specifically when there is a shortage of fuel which leads to vehicles forming long queues at where the fuel and gas stations do not conform to planning standards. Haphazard parking leads to a decrease in width of roads which is meant for the well-organized movement of vehicles and pedestrians. Hence, it tends to become a significant problem in cities and especially in the Central Business District (CBD) such as Kumasi, where multi-story buildings are common, and the land is dedicated mostly to commercial purposes.
Since most people do not obey planning regulations and comply firmly to planning laws and regulations with respects to the location of fuel and gas filling stations, a lot of these known problems caused by filling stations still exist in Kumasi. In order to achieve the desired goal, this work identifies and locates petrol stations and their level of conformance with EPA and KMA standards. It also identifies health centers located around these petrol stations and considers its effects on them in terms of the response of health centers and fire service stations to emergency cases.
Research problem
The spatial analysis of the location and circulation of fuel and gas stations in Kumasi will help in the improvement of the urban environment for living, working, and recreation. The problem of haphazard siting of petrol stations is taking place at disturbing rate in almost all Ghanaian cities with Kumasi metropolis all encompassing [7]. This study will also enable determine the spatial relationship between health centers and fuel and gas stations thereby providing spatial decision support system in preventing adverse effects on patients and health workers in the metropolis. There have been fire explosions in Accra causing death and displacement of inhabitants. Therefore, the spatial analysis of the location of fire service stations and health centers in close proximity to these fuel and gas stations will also provide a means for easy, quick and effective response to emergency cases in the Kumasi metropolis. For example, the recent fire purportedly caused by a fuel leak that occurred at Goil (Ghana oil) filling station in Accra in 2015, at Kwame Nkrumah Circle after a severe flood caused a death toll of 154. This incident in the year 2015 caused the crude death rate to rise above the average, which is nine (9) per thousand (1000) people (Figure 1).
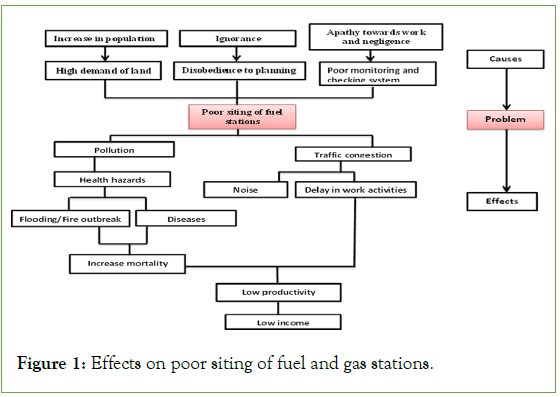
Figure 1: Effects on poor siting of fuel and gas stations.
This study therefore is applicable to Kumasi Metropolis as a structure for the state government, and investors. It will directly involve individuals, and other developers. It will also serve as a structure for further research work and reference material for researchers who anticipate carrying out similar research in the near future.
Aim and objectives
The aim of study is to analyse the spatial distribution of fuel and gas stations in Kumasi Metropolis. The specific objectives of the research are to:
• Update the existing geodatabase of fuel and gas stations in Kumasi Metropolis.
• Identify and locate health centers and fire service stations located close to fuel and gas stations.
• Determine the conformity of updated fuel and gas stations geodatabase with Kumasi Metropolitan Assembly and Environmental Protection Agency standards (Table 1).
| Research objectives | Research questions | Research methods |
|---|---|---|
| To update the existing geo database of fuel and gas stations in Kumasi Metropolis | How to locate (spatial information) fuel and gas stations, health centers and fire service stations in Kumasi? | The petrol stations, health centers and fire service stations will be visited and their ground coordinates (Eastings and Northings) picked with the GPS. |
| How to obtain attribute information such as pictorial description, type of lubricants, and other services provided (pharmacy, washing bay etc.) of fuel and gas stations in Kumasi? | The attribute information about the respective fuel and gas stations will be obtained by field records and photographs will also be taken using a Canon Power Shot SX410IS (20.0 mega pixel) camera. | |
| To identify and locate health centers and fire service stations located close to fuel and gas stations. | Which area has the most gas stations, health centers and which area is fire service stations located in Kumasi? | This will be identified using point density analysis in ArcGIS and also by querying the database created in MS Access and Excel. |
| Which health centers and fire service stations are located close to fuel and gas stations and which health centers are affected by the fuel and gas stations in Kumasi? | This will be achieved by using geo processing tools in the GIS software to determine proximity and also buffer out desired regions. | |
| To determine the conformity of updated fuel and gas stations geo database with Kumasi Metropolitan Assembly and Environmental Protection Agency standards | How can fuel and gas stations be classified based on its conformity to the EPA standards? | Buffering with the required distances provided by EPA in the ArcGIS software. |
| At what terrain slopes are the fuel and gas stations in Kumasi located and are these locations prone to heavy pour and susceptible to flooding? | DEM map or a contour map of Kumasi will be superimposed on the points of the stations and the elevations of these locations will be extracted and analyzed. |
Table 1: A summary of the methods and techniques used in answering the formulated questions.
Literature Review
Applications of GIS and GPS in fuel/gas stations
A GIS is an information system that is designed to work with data referenced by spatial or geographic coordinates [8]. It is both a database system with specific capabilities for spatially referenced data as well as set of operations for working with data. In geospatial analyses of fuel and gas stations in the Kumasi Metropolis, GIS helped in data capture, which is input of the coordinates of the various fuel and gas stations. Data storage which deals with the organization and management of the recorded data, GIS enables the performance of the various data analyses on the captured data. Data visualization and output of information queried can be made possible using GIS. The ground coordinates of the various fuel/ gas stations in the Kumasi Metropolis were picked with the help of handheld GPS. ArcGIS is much preferred in terms of data analysis and visualization and interpretation of the analysis output since it has more complex data analysis tools compared to QGIS. ArcMap allows for analysis such as buffer, point density, extraction (heights of stations from a DEM), overlay, kriging, neighbourhood among others on fuel/gas stations. Based on the outputs of the analyses the various fuel/gas stations can be classified according to EPA and KMA standards.
Database Management System (DBMS) for fuel/gas stations
Database Management Software is a computer application that interacts with the user, other applications and the database itself to capture and analyse data. A general-purpose DBMS is designed to allow the definition, creation, querying, update and administration of databases like data entry, data checking, sorting and classification. It also provides a means by which the stored data can be extracted, reproduced, modified, transferred, and displayed. Database management system is created for most fuel/gas stations to reduce human intervention. For faster system of record keeping that is easy to handle, reduce amount of paper used and chance of human error, to update records easily when needed, retrieve records faster and to have a backup mechanism for transactions to avoid loss of records at the various fuel/gas stations, DBMS is employed. Making a proper system for stock registry and payroll at fuel/gas stations also uses DBMS. Though the use of DBMS is not common at the fuel/gas stations in Ghana but it works perfectly in most advanced countries. Database management system is not only used at the various fuel/gas stations but also at the metropolitan level to keep records of all the fuel/gas stations and the services they render [9].
Maps
Maps have had many definitions over the years. Vasiliev defines it as a conventional representation of spatial phenomena on a plane surface [10]. A map is a graphic representation that facilitates a spatial understanding of things, concepts, conditions, processes or events in human world [11]. Digital maps covering the study area were obtained from the survey department, Kumasi. The maps contained shape files of both settlement and roads. The accuracy of the map was authenticated by locating and picking the ground coordinates of some prominent features with GPS. Distances apart between features on the ground also matched with distances apart on the map. With the help of GIS and GPS, a map in digital form is made showing all the fuel/gas stations in the Kumasi Metropolis including the services they provide. New fuel/gas stations can be added easily and the map can be updated regularly. This help individuals and businesses to access fuel/gas stations within their surroundings.
Town and country planning standards for siting fuel/gas stations
The town and country planning department standards for siting fuel and gas stations are outlined below (Town and Country Planning Department, 2011) [12].
1. Standard for LPG and petroleum products filling outlets: It is advised that petrol filling stations should serve approximately 250-500 vehicles per day.
2. Building infrastructure and minimum plot requirements: An office block shall not be provided at the outlet. The building shall be a simple and attractive sandcrete, concrete, burnt brick structure or other fire resistant building material with aluminium, galvanized or tiled roof and should incorporate a store, salesroom, toilet and change room. Table 2, shows minimum plot requirements of fuel and gas stations (Table 2).
| Location | Dimension(ft.) | Dimension(m) |
|---|---|---|
| Along trunk roads (Highways) | 150 × 70 | 45 × 21 |
| Along major roads(other than trunk roads) | 100 × 70 | 30 × 21 |
| Other roads (Minor Roads) | 80 × 70 | 24 × 21 |
Table 2: Minimum plot requirements.
EPA highway design manual for fuel/gas stations
Vehicles leaving or entering petrol filling station, not only reduce the effective capacity of the roadway, they also are likely to cause accidents. The minimum distance between two (2) installations should be 90 m it is desirable to space filling stations at 500 m apart. Table 3, gives overview of the minimum requirements concerning the design of cellars roadway and the location of installation (Table 3).
| No | Parameter | Fuel service station | LPG station |
|---|---|---|---|
| 1 | Distance from next Station on same side of Road | 500 m | 1,000 m (1 km) |
| 2 | Staggered distance from next Station (Across Road) | 500 m | 1,000 m (1 km) |
| 3 | Distance from the nearest Public Institution/Installations e.g. School, Hospital, Hotel, Church, Market, Lorry Park | 200 m | 500 m |
| 4 | Distance from nearest junction | 100 m | 100 m |
| 5 | Distance from nearest Road bend | 100 m | 100 m |
| 6 | Distance from Hot Works. e.g. Welding Shops etc. | 200 m | 500 m |
| 7 | Distance from Environmentally Sensitive Areas such as Wetlands, Dumpsites, Streams, Rivers, etc. | 200 m | 200 m |
| 8 | Distance from 11KV-33KV | 10 m from the Centre of the Transmission lines | 10 m |
| 9 | Distance from 69KV-161KV line | 15 m from the Centre of the Transmission lines | 15 m |
| 10 | Distance from 225KV-330KV | 20m from the Centre of the Transmission lines | 20 m |
| 11 | Distance from Mast | Height of mast +15%of height of Mast | Height of Mast +15% of height of Mast |
| 12 | Residential/commercial Or industrial areas | A fuel station should be sited for every 4000-5000 people. | A gas station should be sited for every 4000-5000 people. |
| Fuel station should be sited 50 m away in all angles of the build-up areas to create a buffer zone for the residential houses. The buffer zone can be devoted to any non-residential use. | Gas station should be sited 50 m away in all angles of the build-up areas to create a buffer zone for the residential houses-The buffer zone can be devoted to any non-residential use. | ||
| 13 | Distance from the center of a road | The minimum distance from center of the road to the dispensing pump on single carriage way should be 20 m. | The minimum distance from center of the road to the dispensing pump on single carriage way should be 20 m. |
| The minimum distance from center of the dispensing pump on dual carriageway should be 50 m. | The minimum distance from center of the dispensing pump on dual carriageway should be 50 m. | ||
| 14 | Land requirements | Fuel stations should not be sited on areas prone to erosion or flooding. A fuel station should not be sited near endangered plant and animal species. | Gas stations should not be sited on areas prone to erosion or flooding. A gas station should not be sited near endangered plant and animal species. |
| The size of the fuel station shall not be less than | |||
| 31 × 17 M in the case of fuel station with kiosk without service bay. | |||
| 37 × 31 M in the case of fuel station with service bay. |
Table 3: Environmental Protection Agency (EPA) standards on minimum distances for siting gas/fuels stations (EPA, 2016).
The following are the processes to go through before siting a fuel and gas station:
• Application for approval to construct a fuel and gas filling station for retailing petroleum products to the public should be taken to the head of Petroleum Director, giving details of the proposals and any information that may be relevant for the paper. In addition, the following document must accompany the application.
• Three copies of a plan showing the building existing proposed on the site and the relation of the site, the roadway and adjoining land use.
• A certificate signed by the head of the fire officer that he is satisfied that the arrangement proposed for the prevention of fire are satisfying.
• A letter approved from the town and country planning authority of the area for the construction of a fuel and gas station on the proposed site.
• A certificate signed by a state police commissioner or a supervisor police in charge of police motor traffic division that he is satisfied that the site and layout of the proposed fuel and gas station do not constitute an unnecessary traffic hazard.
• Evidence that the ministry has given the go ahead to deal in petroleum products duly registered by the company applying.
• Tax receipt or clearance certificate for the proceeding years would be inspected. After the above listed documents have been submitted, inspection of the site will be arranged.
• The inspectorate will grant approval, if the proposed site fulfils the necessary conditions stipulated in the regulations.
Also, a standard fuel and gas station must have the certifications below:
• Certificate from the Ghana Fire Service Department.
• Receipt of trade fee from the local authority.
• Clearance from the traffic management and road safety unit (Road and Transport Authority).
• Clearance from the ministry of Environmental Protection Agency [13].
Materials and Methods
Study area
Kumasi is a city found in the temporary forest zone and is about 270 km north of the national capital, Accra. It is between latitude 6.35˚N–6.40˚N and longitude 1.30˚W–1.35˚W. The land area of the metropolis is about 254 sq/km and approximately ten (10) kilometres in radius. There are 119 communities. The Kumasi Metropolis is the most populated district in the Ashanti Region. It has a Population of 2,035,064 (2010 census) with an annual growth rate of 4.8%. In 2013, the population of Kumasi is estimated to be around 2,396,458. The scope of this research is to analyse the spatial distribution of fuel and gas stations in Kumasi Metropolis (Figure 2).
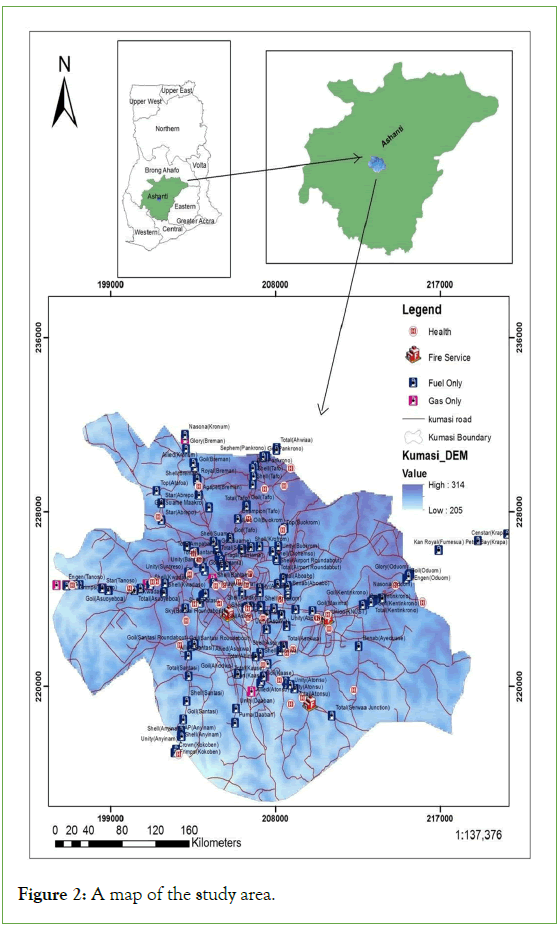
Figure 2: A map of the study area.
Materials
The materials we used include both hardware and software components:
Garmin GPS map 62s: This is used in obtaining the spatial locations (ground coordinates) of the fuel and gas stations, hospitals and fire service stations.
20.0 mega pixel canon powershot camera: This is used in taking pictures (spatial attributes) of the fuel and gas stations, hospitals and fire service stations.
Maps: Physical land use map from town and country planning for knowledge on how land has been distributed or apportioned for various uses (in this case land areas reserved for siting fuel and gas stations.
• Topographic map from the Survey Department for knowledge on the terrain of the Kumasi metropolis and to show distribution of fuel/gas stations along the road networks.
• Digital Elevation Model (DEM) of the Kumasi metropolis to extract and analyse the elevations of the fuel/gas stations.
• Ancillary Datasets: EPA laws/rules and regulations for the siting of fuel and gas stations
Software’s: ArcGIS for the analysing, manipulation, design and display of data acquired to be displayed in a more representational form.
1. MS Excel for entering and organization of spatial data and non-spatial attribute information acquired.
2. MS Access for creating a database for the spatial and nonspatial attributes information acquired.
Methodology
In other to meet the goals of this research, some processes and methods were adopted. Field data together with already existing data were imported into excel and access to create a database. Queries were performed on the database and exported into excel. The excel files were converted into CSV formats and imported into the ArcGIS software together with the boundary and road shapefiles of the metropolis. Several analyses were performed and results were obtained (Figure 3).
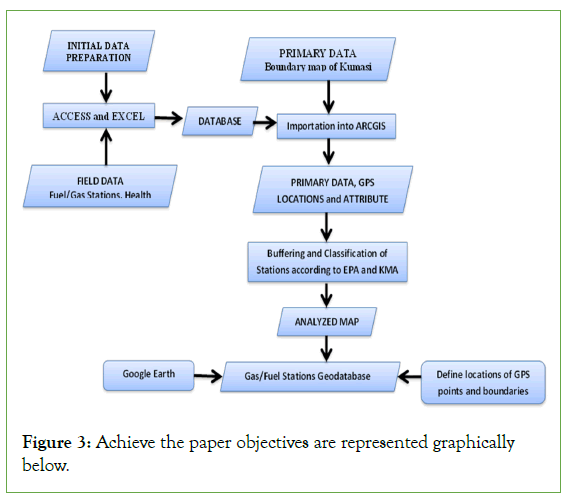
Figure 3: Achieve the paper objectives are represented graphically below.
Results and Discussion
Spatial location of fuel/gas stations
The fuel and gas stations were assessed based on the following requirements are:
i) A minimum distance requirement between successive stations
ii) A minimum distance requirement between stations and roads
iii) Minimum distance requirement between stations and public institutions
iv) How they will be affected by runoff water and heavy rain taking into consideration their elevations.
The results from the techniques we used are discussed and conclusions are made from them in this section. Some of the deductions are also represented in tables and charts. The outputs of the processed data are also discussed. With the help of the GPS, the ground coordinates of the respective stations were obtained. It was observed that the gas and fuel stations in the Kumasi Metropolis are scattered and unevenly distributed. This was the case for almost all the gas and fuel stations along the trunk roads in study area. Secondly, the overall conformance of the gas and fuel stations in the metropolis with respect to the minimum spacing distances between successive stations and stations to public institutions are poorly observed in the metropolis. A lot of them were built in and around the city centre; these are places that are known to contain the greater number of the population in the metropolis. Some of the fuel/gas stations were built close to streams, dumpsites and in waterlogged areas. Our map work in ArcGIS (Figure 3), was converted to Keyhole Markup Language (KML) and viewed in Google earth software for more realistic/visual representation of the analysis.
A total number of one hundred and fifty three (153) gas and fuel stations were covered from the research carried out in the study area, most of which were located along the major roads that pass though the centre of the towns, and roundabouts. From our study, it was observed that 140 stations (92%) sold fuel only, 11 (7%) sold gas only, and 2 (1%) sold both fuel and gas. It was also observed that, SHELL filling stations recorded the highest number in the metropolis with a total number of 31 stations (20%); followed by TOTAL which recorded 29 stations (19%). GOIL (government owned) was the next including 21 stations (14%) (Figure 4).
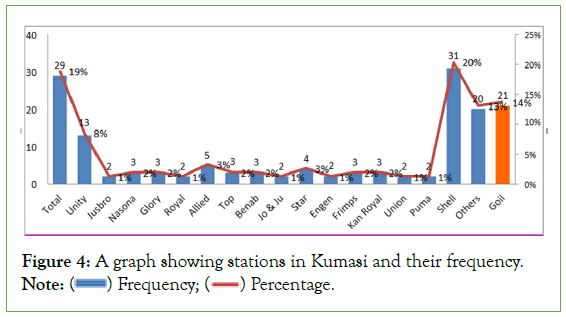
Figure 4: A graph showing stations in Kumasi and their frequency.
Note:  Percentage.
It was also observed that even though GOIL, was the third most frequent station in the metropolis and recorded 14% of the total number of stations. A lot of the fuel and gas stations in the metropolis are private owned, which is 86% of the total number. A density map was created in ArcGIS to identify the distribution of fuel and gas stations, as well as health centers in the metropolis. It was discovered that fuel and gas stations were dense in areas like Abrepo junction, Airport roundabout, Suame roundabout, Kentinkrono, Bantama, Ahinsan and Amakom. Health centers were also dense in areas like Abrepo, Asafo, Asuoyeboa, Bantama and Ahinsan (Figure 5).
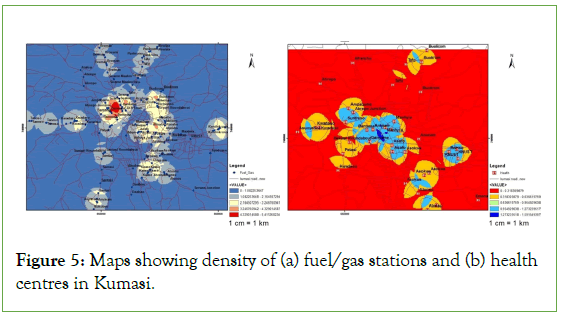
Figure 5: Maps showing density of (a) fuel/gas stations and (b) health centres in Kumasi.
Attribute information
It was observed that most of the stations did not keep their surroundings clean enough, with some having choked drains and spoilt vehicles left at sensitive joints. Some of the stations had old structures and were in poor state. Unfortunately some resistance from certain fuel stations led to taking pictures from distant locations. It was also observed that most of the fuel stations had mini markets and also provided automobile services. A number of them also had washing bays, with a few performing banking activities. Figures 6a and 6b, are example pictures added to the attribute information. The form view in Access made it very easy to display and identify fuel/gas stations (Figure 6c). The hyperlinks which were created in ArcGIS served a similar purpose, by easing identification of fuel/gas stations in the metropolis (Figure 6).
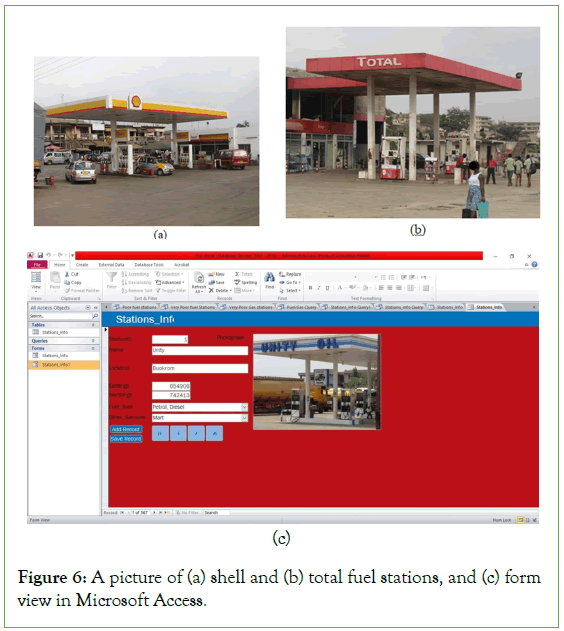
Figure 6: A picture of (a) shell and (b) total fuel stations, and (c) form view in Microsoft Access.
Easing the search of fuel and gas stations in the metropolis
A map of Kumasi Metropolis showing the fuel and gas stations in the metropolis was created using the road, boundary shape file, the GPS coordinates of the points picked and attributes of these stations (Figure 7). This map displayed the distribution of the fuel/gas in the city. The map can be used to query or search for stations in a particular locality, the type of fuel sold, the kinds of services provided, their frequency, etc. The map can be used to navigate to fuel/gas stations of choice in the city.
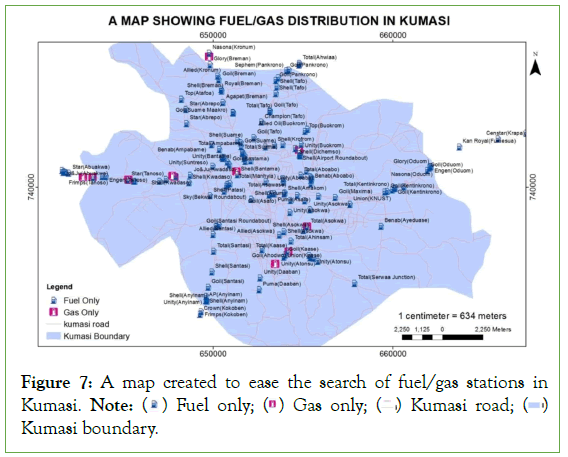
Figure 7: A map created to ease the search of fuel/gas stations in Kumasi. Note:  Kumasi boundary.
Geospatial analysis of fuel and gas stations in Kumasi based on its conformity to the EPA and Town and Country Planning standards
The analysis was carried out based on asserted laws of the EPA and Town and Country Planning Department laws governing the siting of fuel and gas stations. It focused on the following laws governing the distances:
• Between successive fuel and gas stations
• Between a fuel and gas station and a road bend or road junction
• Between a fuel and gas station and public institutions
The main techniques used to determine these distance requirements in the ArcGIS software were the Buffering and Selection techniques. According to the Environmental Protection Agency’s laws on siting of fuel and gas stations.
It requires a minimum distance of 500 m between successive fuel stations and 1,000 m between successive gas stations. In order to prevent the work from being clumsy and confusing, 250 m buffer for fuel stations and 500 m for gas stations were performed instead of the 500 m (fuel) and 1,000 m (gas) which was stated. This was done with the assertion that, the buffer polygons (having 250 m and 500 m radii respectively) when they intersect shows the distance between the two stations is less than 500 m for fuel and 1000 m for gas and vice versa if the buffer polygons do not intersect. The stations with the intersecting buffer polygons were chosen to be the ones that did not meet the distance requirements.
In this study it was observed that:
• Out of the 140 fuel stations 97 of them, which is 69% of their total number, did not meet the 500 m away from the next station requirement.
• 4 out of the 11 gas stations, which are 36% of their total number, did not meet the 1,000 m away from the next station requirement (Figure 8).
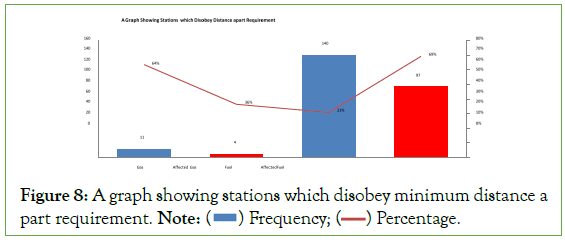
Figure 8: A graph showing stations which disobey minimum distance a part requirement. Note:  Percentage.
It requires a minimum distance of 200 m for fuel stations and 500 m for gas stations, from the nearest Public Institution/Installations e.g. School, Hospital, Hotel, Church, Market, and Lorry Park, etc. A total number of 175 public institutions were recorded in this paper, out of which 22 were churches, 41 were health centers, 14 were hostels, 25 were hotels, 8 were markets, 3 were mosques, 2 were public parks and 60 were schools. We also recorded 4 fire service stations. It was observed that a lot of schools were affected as a result of poor siting of fuel and gas stations, not forgetting markets, health centers and churches. Out of the 175 public institutions recorded in the study, 62 of them were affected as a result of the poor siting of the gas and fuel stations: representing 35% of their total number. It requires a minimum distance of 100 m between both gas and fuel stations and nearest road bends and road junctions. A total of 35 road junctions were recorded for the analysis. After buffering with this minimum distance requirement of 100 m between stations and road junction, 21 stations did not meet the 100 m criteria.
Obtaining health centers that are affected by 200 m and 500 m distance from fuel and gas stations respectively
Since one of our main focuses was on the health centers located close to these stations, an analysis was performed on the health centers only. A total number of 41 health centers were recorded in our study. After buffering with the desired distances in ArcGIS, it was discovered that 11 (27%) out of the 41 health centers were affected by poor siting of gas and fuel stations in the metropolis.
Obtaining fuel and gas stations which affect public institutions in the metropolis
A 200 m and 500 m buffer was performed on the public institutions which were recorded for our study. The fuel and gas stations which fell within these buffer regions were 62 in all. The analysis which was performed on the fuel and gas stations alone showed that:
1. 21 (representing 14%) out of the 153 stations did not meet the 100 m away from road junction EPA requirement.
2. 55 fuel stations (representing 39% of their total number) and
3. 7 gas stations (representing 64% of their total number) were not sited well and hence affected the public institutions in the metropolis (Figure 9).
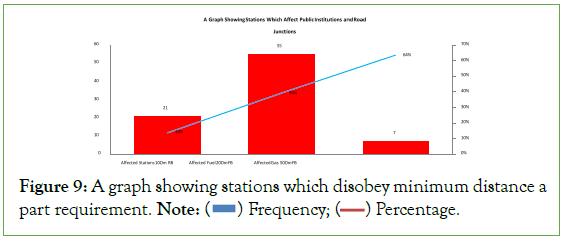
Figure 9: A graph showing stations which disobey minimum distance a part requirement. Note:  Percentage.
Obtaining distances between successive gas and fuel stations
Distances between stations were obtained and recorded against each gas and fuel station. The minimum distance obtained for fuel stations was 36 m and the maximum was 2,770 m whereas minimum distance obtained for gas stations was 130 m with 6,578 m maximum distance recorded.
Classification based on distances between fuel and gas stations: This analysis was based on the EPA and physical planning standards or laws that states that: All fuel and gas stations should observe a minimum spacing distance of 500 m and 1,000 m between them respectively. The analysis was done by measuring the distances between successive stations in the manner: station 1 to station 2, station 2 to station 3, 3 to 4, etc. After performing the analysis and obtaining the results, it was observed that fuel stations which were located at some parts of Bantama, Asafo, Abuakwa, Buokrom, Ahwiaa, Kokoben, Aboabo, Kaase, Oduom, Asokwa, and Airport roundabout were sited very close (less than 300 m) to each other (Figure 10). Also, gas stations which were located at Asuoyeboa were sited very close to each other (Figure 11). A distance grouping (distance class) was formulated in order to rate or classify the results of the individual spacing between them. The classification was performed in the order of distance class or range a gas or fuel station found itself or qualified under. The stations were grouped into classes namely, excellent, average, poor and very poor. The analysis showed that:
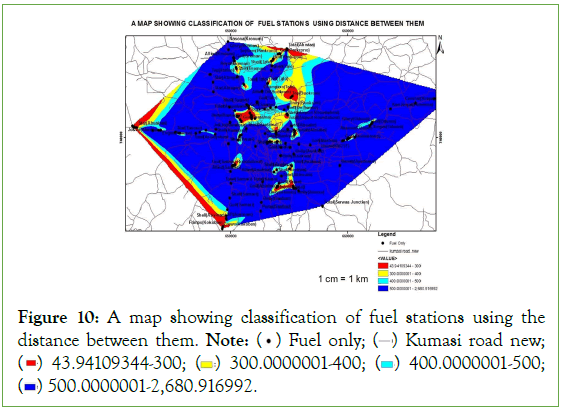
Figure 10: A map showing classification of fuel stations using the distance between them. Note:  Kumasi road new;
  400.0000001-500;
  500.0000001-2,680.916992.
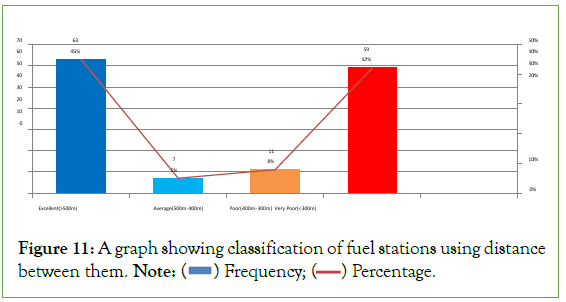
Figure 11: A graph showing classification of fuel stations using distance between them. Note:  Percentage.
• 63 fuel stations (45%) had a distance greater than 500 m between them,
• 7 fuel stations (5%) had a distance of 400 m to 500 m between them,
• 11 fuel stations (8%) had a distance of 300 m to 400 m between them,
• 59 fuel stations (42%) had a distance less than 300 m between them (Figure 12),
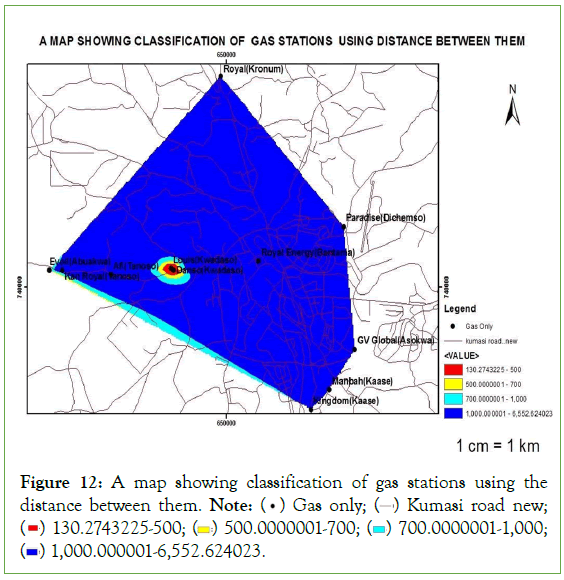
Figure 12: A map showing classification of gas stations using the distance between them. Note:  Kumasi road new;
  700.0000001-1,000;
  1,000.000001-6,552.624023.
• 8 gas stations (73%) had a distance greater than 1000 m between them,
• 0 gas stations (0%) had a distance of 700 m to 1000 m between them,
• 1 gas stations (9%) had a distance of 500 m to 700 m between them, and
• 2 gas stations (18%) had a distance less than 500 m between them (Figures 10-13).
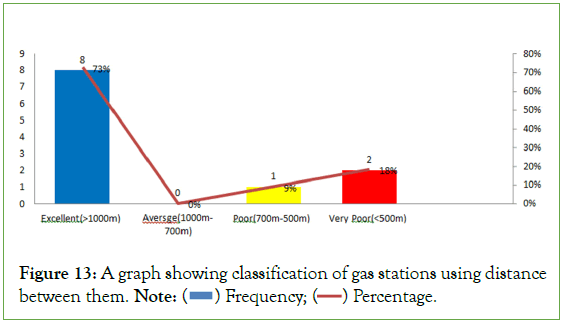
Figure 13: A graph showing classification of gas stations using distance between them. Note:  Percentage.
Classification based on elevation of fuel and gas stations: This analysis was performed after superimposing the elevation map of Kumasi metropolis on the gas and fuel station points in ArcGIS. It was discovered that a Shell station at Anyinam around Santasi recorded the lowest elevation of 223 m whereas a Goil station at Pankrono around Tafo recorded the highest elevation of 311 m. It was observed that the stations in Abuakwa, Anyinam, Kokoben and another station at Daaban were the stations that are likely to be affected by runoff water and possibly be flooded in case there is a heavy rain. In all, 24 stations (16%) were located at areas with very low elevations and are susceptible to flooding (Figure 14).
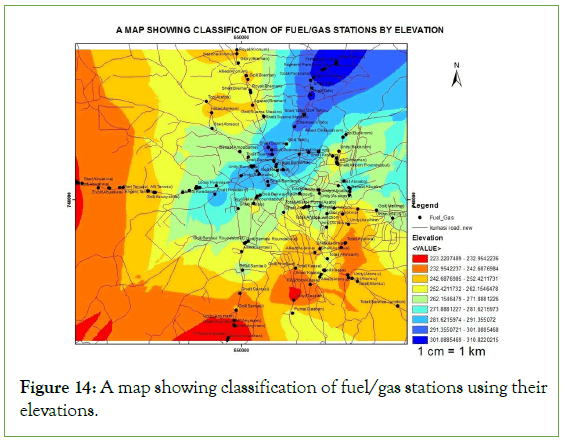
Figure 14: A map showing classification of fuel/gas stations using their elevations.
Obtaining gas and fuel stations which disobey only one, two or all three EPA standards
Fuel and gas stations which disobey only two of the EPA and KMA were obtained. Fuel stations which did not meet all three requirements thus, 100 m away from road junctions, 200 m away from public institutions and were not 500 m apart were 10 (7%) in number. Fuel stations which did not meet the 100 m away from road junction and 200 m away from public institutions EPA requirements were 12. Fuel stations which did not meet the 100 m away from road junction and 500 m from each other requirements were 17. Fuel stations which did not meet the 200 m away from public institutions and 500 m apart requirements were 35. Gas stations which did not meet the 500 m away from public institutions requirement and were not 1000 m apart were 3. After removing all duplicates, it was discovered that 78 stations (51%) disobeyed a single requirement, 37 stations (24%) did not meet two of the requirements, 10 stations (7%) did not meet all three requirements and only 28 stations (18%) met all three requirements.
Classification of stations based on their conformance with EPA standards: After our analysis on the conformance of gas and fuel stations with EPA standards, it was discovered that:
• 28 stations (18%) met all three requirements
• 78 stations (51%) did not meet only one requirement
• 37 stations (24%) did not meet two requirements
• 10 stations (7%) did not meet all three requirements
A classification was made based on this observation. The stations were grouped into classes namely; excellent, average, poor and very poor (Figure 15).
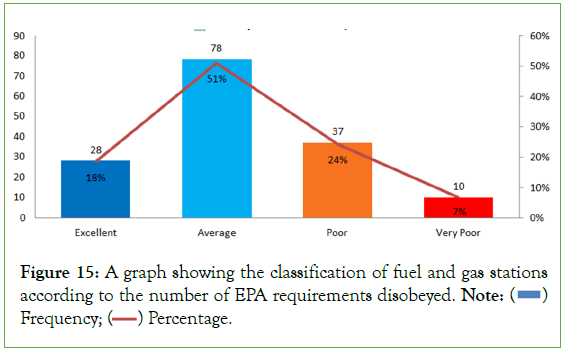
Figure 15: A graph showing the classification of fuel and gas stations
according to the number of EPA requirements disobeyed. Note:  Percentage.
Obtaining fire service stations and health centers which are located in close proximity to gas and fuel stations
Our research aimed at obtaining fire service stations and health centers which are located in close proximity, say 1000 m to gas and fuel stations in other to offer emergency response in case of emergency. The number of fire service stations recorded in our study was 4, but 3 of them were located in close proximity to gas and fuel stations. Also, 37 health centers were discovered to be in close proximity to gas and fuel stations. The analysis performed to obtain the fire service stations and health centers in close proximity showed that:
• 3 out of the 4 fire service stations (KNUST fire service stations, Ghana fire service station Ejisu and Fire service station Adum) were the ones that were in close proximity and will give a quick response to emergency cases should the need be. The one left is located along the road stretch between Atonsu and Dompoase.
• 37 out of the 41 health centers, representing 90% of their total number, are located in close proximity to the gas and fuel stations in the metropolis, out of which 18 offer response to emergency cases (Figure 16).
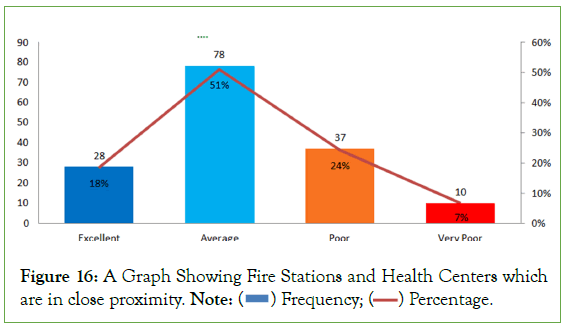
Figure 16: A Graph Showing Fire Stations and Health Centers which
are in close proximity. Note:  Percentage.
A database for the fuel and gas stations
A Database for all the fuel and gas stations in the metropolis was created. The spatial and non-spatial or attribute data of the fuel and gas stations such as names, coordinates, services provided, other services provided and pictures were entered into the form view in the database created with Microsoft Access 2010. This view enables one to display the pictures of the fuel/gas stations and make identification easy. The attribute data in the database was queried to identify specific stations and specific services provided by the stations. This will provide help to any individual or tourist who visits the city and requires similar services.
Limitations of the research
Certain difficulties were encountered in the process of executing our duties, one of which was the acquisition of a GPS device. It was also very hectic obtaining the GPS points since there was no proper mode of transportation; however, the main difficulty lied in the postponement in the acquisition of data and laws from EPA and Town and Country Planning. It made it very difficult to know the particular points and areas to pick, observe and record for analysis to be made.
Recommendations
Filling stations in the Kumasi metropolis are more concentrated along the trunk routes (high ways) which pass through the towns. The places they are located can increase the number of casualties should there be any accident. Hence, measures should be put in place to place their sittings farther away from the populace. Only four fire service stations were recorded in the city, this is not the best solution. Extra fire service stations should be built at vantage points in the city. Also, the distribution of fuel and gas stations in the Kumasi metropolis is uneven and scattered. Measures should be put in place to properly map out areas which are best to build fuel/ gas stations. All though most of the gas and fuel stations did not comply to the requirement of 1000 m and 500 m distance between them, and a few failed to meet the 100 m minimum distance requirement to roads. It was common to see stations situated very close to dumpsites, streams and roads, especially major roads in the area. The paper concludes with the following recommendations:
• Laws should be enacted to make the gas and fuel stations, which affect individuals and societies in which they are located, pay royalties to the affected.
• There is a need for more studies on gas and fuel stations especially issues related to site selection and their conformance to standards.
• Inconsistencies were observed with regard to the compliance with EPA standards and regulatory agencies. As such, there is a need to look into the issue and act appropriately.
• The database should be constantly updated to incorporate locational and attribute information of new fuel and gas stations.
Conclusion
In this paper, the topographic map of the study area and geographic positions of the gas and fuel stations as well as pictures and other relational attributes have been integrated and linked with ArcGIS environment for a better visual representation. The distribution of the individual stations in the area study area have been critically examined and analysed according to Environmental Protection Agency and Town and Country Planning requirements/standards. A database of the gas and fuel stations (i.e., locational and attribute) have been created in Microsoft Access. Necessary queries can be made and required information can be obtained from it. It can also be updated anytime when the need arises. After making analysis to identify fire service stations and health centers in close proximity to fuel/gas stations in the city, 3 out of the 4 fire service stations (KNUST fire service stations, Ghana fire service station Ejisu and Fire service station Adum) were the ones that were in close proximity and will give a quick response to emergency cases should the need be. The one left is located along the road stretch between Atonsu and Dompoase. 37 out of the 41 health centers recorded, representing 90% of their total number, are located in close proximity to the gas and fuel stations in the metropolis. 18 out of them offer response to emergency cases. After performing the analysis based on the conformity of the fuel/gas stations in the city, it was realized that only 28 stations met all the EPA requirements, 10 stations disobeyed all three requirements, 37 stations disobeyed two requirements, and 78 stations disobeyed only one requirement. From the study. It was observed that some fuel/gas stations were built very close to streams, big drains and refuse dumpsites. It was also realized that 16% of the fuel/gas stations have their elevations less than 242 m. This means they have been built at low level areas and will be easily affected by runoff water and possibly be flooded especially the ones built close to or in waterlogged areas. Refuse dumps on the other hand, produce a lot of heat because of the presence of biogas. This can catch fire and therefore makes it very risky and unsafe to build fuel/gas stations close to them. In conclusion, GIS is a proper tool for important decision making in the organization and management of location related issues, provided it is built on a well-designed database.
References
- KayodeOO, Oluwafemi IA,Tubosun JO. Vulnerability assessment of buildings around gas stations in parts of ilorin nigeria. Fig Working Week Resource Handouts. 2015:2.
- Friedman E. Encyclopedia of real estate appraising. 1978.
- Mahmood FH, Shaban AH, Numan SA. Optimal spatial distribution of gasoline stations in Baghdad province utilizing gis techniques. Iraqi J Sci. 2015;56(1C):853-865.
- Arokoyu SB, Ogoro M, Jochebed O. Petrol filling stations' location and minimum environmental safety requirements in ObioAkpor LGA, Nigeria. Int J Sci Res Innov Technol. 2015;2(11):19.
- Sangotola TM, Fasanmade PA, Ayanrinde WA, Olatinwo IO, Olaniran HF. On the effects of petrol stations in Nigeria. Int J Sci Res Eng Technol. 2015;4(4):947-954.
- Tomlinson RF. Thinking about GIS: Geographic Information System planning for managers. ESRI, Inc.; 2007.
- Boateng EK, Ofosu M. Geospatial analysis of fuel and gas stations in the Kumasi Metropolis. 2016.
- Shayya WH. An introduction to ArcView GIS. Morrisville: Agriculture and natural resources. 2004:28
- Muhammad UN. Database for shell petrol station (Zahid Petroleum), Pakistan. 2017.
- Vasiliev I, Freundschuh S, Mark DM, Theisen GD, McAvoy J. What is a map?. Cartogr J. 1990;27(2):119-123.
- Andrews JH. Reflections on the Harley‐Woodward definition of ‘maps’. Irish Geography. 2007;40(2):200-205.
- Vulnerability assessment of buildings around gas stations in parts of ilorin nigeria
- Environmental Protection Agency Guideline for the Establishment of Fuel/LP Gas Station 2016. EPA Headquaters, Accra, Ghana. 2016.
Citation: Antwi RB, Okai S, Quaye-Ballard J, Ozguven EE (2024) Geospatial Analysis of Fuel and Gas Station Distribution: Evaluating the Compliance and Impact of Station Siting on Public Health and Safety in Kumasi, Ghana. J Remote Sens GIS. 13:330.
Copyright: © 2024 Antwi RB, et al. This is an open access article distributed under the terms of the Creative Commons Attribution License, which permits unrestricted use, distribution, and reproduction in any medium, provided the original author and source are credited.
