Indexed In
- Genamics JournalSeek
- Academic Keys
- JournalTOCs
- China National Knowledge Infrastructure (CNKI)
- Access to Global Online Research in Agriculture (AGORA)
- Centre for Agriculture and Biosciences International (CABI)
- RefSeek
- Directory of Research Journal Indexing (DRJI)
- Hamdard University
- EBSCO A-Z
- OCLC- WorldCat
- Scholarsteer
- SWB online catalog
- Publons
- Euro Pub
- Google Scholar
Useful Links
Share This Page
Journal Flyer

Open Access Journals
- Agri and Aquaculture
- Biochemistry
- Bioinformatics & Systems Biology
- Business & Management
- Chemistry
- Clinical Sciences
- Engineering
- Food & Nutrition
- General Science
- Genetics & Molecular Biology
- Immunology & Microbiology
- Medical Sciences
- Neuroscience & Psychology
- Nursing & Health Care
- Pharmaceutical Sciences
Research Article - (2019) Volume 10, Issue 9
Formulation and Sensory Acceptability of Flat Bread from Kocho with Broad Bean (Vicia faba L.) and Quality Protein Maize (Zea mays) Flours
Simegn Serka1*, Dereje Getahun2 and Kebede Abegaz22School of Nutrition and Food Science, Hawassa University, Ethiopia
Received: 17-Aug-2019 Published: 23-Sep-2019, DOI: 10.35248/2157-7110.19.10.812
Abstract
Kocho, a nutritionally poor food product of enset, is prepared from the bulk of starch obtained from a mixture of decorticated leaf sheaths and grated corm of enset. This study was intended to formulate flat bread from kocho blended with broad bean and Quality Protein Maize (QPM) and evaluate its nutritional and sensory quality. Flat bread samples were prepared from blends of kocho, broad bean and quality protein maize flours at different ratios: 50:35:15, 50:30:20, 50:25:25 and 50:20:30 respectively. Control flat bread was prepared from 100% kocho. Consumer-oriented sensory evaluation of the formulated flat breads was conducted using 5 point hedonic scale. Proximate composition, selected minerals’ and anti-nutrients’ contents were analyzed. It was found that crude protein content was increased from 1.72% (control flat bread) to 11.35% (flat bread prepared from blends of 50:35:15 kocho, broad bean and QPM respectively); the crude fat content was increased from 0.83% to 3.06%. All of the formulated flat breads were accepted for the sensory attributes; the 50%:25%:25% blending ratio showed the highest overall acceptability, 3.92. It was concluded that blending kocho with broad bean and QPM could improve the nutritional value of flat bread with acceptable sensory quality.Keywords
Kocho; Broad bean; Quality Protein Maize; Blending; Flat bread
Introduction
Kocho is the bulk of starch obtained from the mixture of the decorticated (scrapped) leaf sheaths and grated corm of Enset and fermented underground for long periods of time without spoiling [1]. Nowadays, it is estimated that about 20 million people in Ethiopia depend on Ensetproducts such as kochoas staple or co-staple food [2]. Enset (Enseteventricosum (Welw.), Cheesman) is endemic to Ethiopia and cultivated as a food crop in southern, southwestern and central parts of the country [3]. Enset is a perennial herbaceous monocot banana-like large (grow 4 to 11 m in height) plant belonging to the family Musaceae, genus of banana [4]. Enset has the potential to improve nutrition and boost food security [5]. It is a major crop for peoples indigenous to southern Ethiopia and mainly consumed as kocho, bulla, and amicho [6].
Broad bean (Vicia faba L.) is one of the important legumes. It can be used as a dietary item alone or can serve as potential supplement to cereal diets, especially for the preparation of inexpensive proteinrich food. There has been a renewed interest in broad bean (Vicia faba L.) throughout the world, which is connected with its high protein content, rising costs of protein-rich food, health benefits, and feed, national desires for greater self-sufficiency in food production and perhaps most importantly, the rapidly increasing human populations. Dry grain legumes, however, contain anti-nutritional factor such as phytates [7].
Quality Protein Maize (QPM) is nutritionally superior cereals grain that has a higher proportion of two key amino acids, lysine, and tryptophan, than which is found in normal maize. It contains nearly twice as much usable proteinthan other maize (or corn) grown in the tropics and yields 10% more grain than traditional varieties of maize [8,9]. In Africa, several hundred million people rely on maize as their principal daily food, for weaning babies, and for feeding livestock. Unfortunately, maize (corn) has two significant flaws; it lacks the full range of amino acids, which are lysine and tryptophan, needed to produce proteins, and has its niacin (vitamin B3) bound in an indigestible complex. QPM is relatively cheap and an excellent source of lysine and other essential amino acids such as tryptophan, since the quantity of the maize is very high in the ration. Thus most of the benefits of using QPM are likely to be economic savings, in addition to being superior in protein quality. This research intended to formulate flat bread from kocho blended with broad bean and QPM flours and evaluate its nutritional and sensory quality.
Materials and Methods
Kocho flour preparation
Kocho samples were thoroughly hand-mixed. Extra water was drained off by squeezing using muslin cloth. Then, it was chopped. Finally, it was sieved to remove rest of the fiber, dried in the oven and packed in plastic bags (Figure 1).
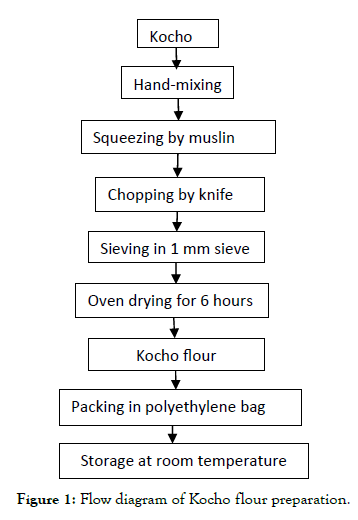
Figure 1. Flow diagram of Kocho flour preparation.
Broad bean flour preparation
The broad bean was cleaned and sorted to eliminate dirt, damaged grains, and foreign materials. Then soaked in tap water for overnight with bean to water ratio of 1:10 (w/v) in order to suppress beany and grassy flavor development and to reduce anti-nutritional factor at some level [10]. After soaking, the excess water was drained off and beans were dried in oven at 60℃ using forced air dry oven. Then it was dehulled manually using mechanical laboratory dehuller. The dehulled beans were winnowed to separate the hulls and milled using a Thomas -Wiley Laboratory Mill (Model 4 U.S.A.) and sieved in 1mm sieve size. Finally, the flour was packed in polyethylene bags and stored at room temperature (Figure 2) [11].
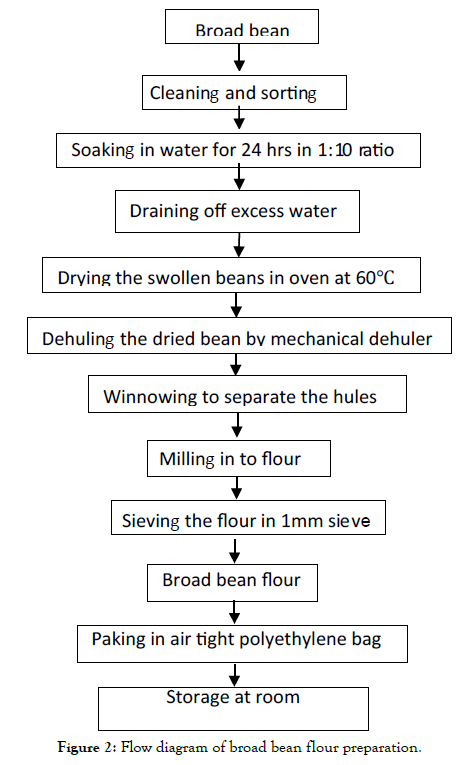
Figure 2. Flow diagram of broad bean flour preparation.
Quality protein maize flour preparation
The QPM was sorted and washed in tap water to remove any dust particles present in maize and excess water was drained off, then sun-dried and finally milled using a Thomas-Wiley Laboratory Mill (Model 4 USA) and sieved to pass 1 mm mesh size; finally, packed in air-tight polyethylene bag (Figure 3).
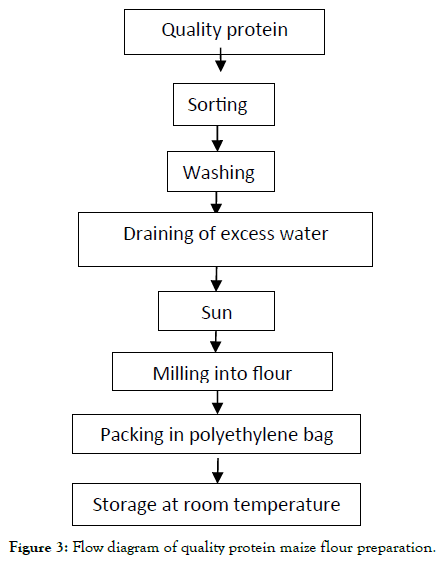
Figure 3. Flow diagram of quality protein maize flour preparation.
Blending experiment
Flours of kocho, broad bean and QPM were blended in different ratios (Table 1) [12].
| Bread Samples | Kocho flour (%) | Broad bean flour (%) | QPM flour (%) |
|---|---|---|---|
| 50K:35B:15Q | 50 | 35 | 15 |
| 50K:30B:20Q | 50 | 30 | 20 |
| 50K:25B:25Q | 50 | 25 | 25 |
| 50K:20B:30Q | 50 | 20 | 30 |
| 100 Koch (Control) | 100 | 0 | 0 |
Table 1: Blending kocho, broad bean and QPM flour in different ratio.
Bread preparation
Experimental bread was baked from composite flours mixed with water, kneaded thoroughly and baked using metal grid covered with enset leaf [13] (Figure 4). Finely powdered kocho was also baked in the same way with that of experimental bread.
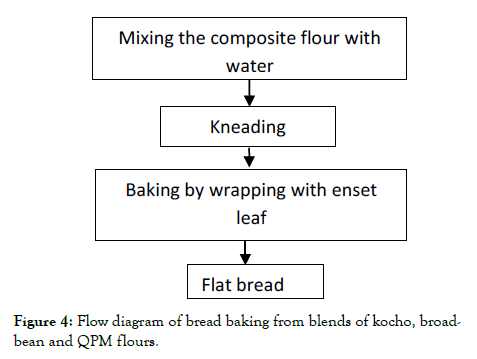
Figure 4. Flow diagram of bread baking from blends of kocho, broadbean and QPM flours.
Sample analysis
Sensory evaluation: Consumer-oriented sensory evaluation was conducted with 25-panel members and the samples were served in duplicate. The sensory attributes: texture, color, taste, flavour and overall acceptability of flat bread samples were evaluated using a 5-point hedonic scale (5=like extremely; 4=like moderately; 3=neither like nor dislike; 2=dislike moderately; and 1=dislike extremely). Samples were arranged in a random order with white plates coded with three-digit random numbers and served to the sensory judges. Before each taste, orientation was given on the procedure of sensory evaluation.
Proximate composition, selected minerals, and phytic acid analysis: Analysis of each processed food constituent sample was done using standard AOAC methods. The moisture content was determined using forced air-oven drying at 105℃ overnight [14] method; Crude protein contents by Kjeldahl method (% protein=N × 6.25). The fat content was determined using diethyl ether in ANKOM XT10 2000 Extractor and crude fiber content by dilute acid and alkali hydrolysis using ANKOM 2000 Fiber Analyzer. Ash was determined by incineration of 1 g weights of the samples in a muffle furnace at 550℃ until gray-white ash was obtained by AOAC [14] method; Carbohydrate contents were calculated by the difference of total contents from 100. Gross energy was determined by calculation from fat, carbohydrate and protein content using the Atwater’s conversion factor; 16.7 kJ/g for protein, 37.4 kJ/g for fat and 16.7 kJ/g for carbohydrate. Flame Atomic Absorption Spectrometry (FAAS) was used for the determination of iron, calcium and zinc contents of the samples using the procedure developed by AOAC [14]. Phytate content of the flat breads developed was determined using the method of Latta and Eskin [15] as modified by Vantraub and Lapteva [16].
Determination of the molar ratio of phytate/mineral: The mole of phytate and minerals was determined by dividing the weight of phytate and minerals with its atomic weight (phytate: 660 g/ mol; Fe: 56 g/mol; Zn: 65 g/ mol; Ca: 40 g/mol). The molar ratio between phytate and mineral was obtained after dividing the mole of phytate with the mole of minerals [17].
Data analysis: Means and standard deviations of means were calculated and the data was subjected to analysis of variance (ANOVA). Sensory evaluation, proximate composition, mineral, and phytic acid data were analyzed using SAS version 9.1. SPSS version 16.0 was used to compute descriptive statistics. Fisher’s LSD was employed for comparison of means. p-value<0.05 was taken as a cut-off point for significance testing. Results were displayed using tables.
Result and Discussion
Sensory evaluation
The bread with blending ratio 50K:25B:25Q scored highest in overall acceptability, 3.92, next to 50K:20B:30Q. The highest score was observed in color, 4.08, in blending ratio of 50K:20B:30Q. This is due to the addition of high amount of yellow-colored QPM. None of the products was not acceptable (Table 2). This finding agrees with that of Kalekristos [12].
| Bread Samples | Color | Taste | Flavor | Texture | Overall Acceptability |
|---|---|---|---|---|---|
| 50K:35B:15Q | 3.34 ± 1.14c | 3.32 ± 0.94b | 3.24 ± 1.00b | 3.80 ± 0.88ab | 3.36 ± 0.85b |
| 50K:30B:20Q | 3.62 ± 0.92cb | 3.26 ± 0.88b | 3.32 ± 0.82b | 3.66 ± 0.87b | 3.42 ± 0.86b |
| 50K:25B:25Q | 3.92 ± 0.83ab | 3.70 ± 0.89a | 3.82 ± 0.72a | 3.96 ± 0.75ab | 3.92 ± 0.72a |
| 50K:20B:30Q | 4.08 ± 0.69a | 3.70 ± 0.71a | 3.66 ± 0.77a | 4.04 ± 0.90a | 3.90 ± 0.74a |
| 100K Control | 2.60 ± 1.12d | 3.24 ± 1.17b | 3.12 ± 1.08b | 3.70 ± 1.02b | 3.28 ± 1.28b |
Table 2: The sensory score of bread developed from kocho blended with broad bean and QPM.
Proximate compositions
Moisture content: As depicted in Table 3, the moisture content was increased sequentially from blending ratio 50K:35B:15Q to control. It was significantly different with all other blends but there was no significant difference among the blending ratios 50K:35B:15Q, 50K:30B:20Q and 50K:25B:25Q. Even if, it is in dry matter base the pure kocho bread exhibited highest value of moisture content. This may be because naturally, kocho contains high amount of moisture content [18].
| Samples | Crude protein (%) | Crude fat (%) | Fiber (%) | Ash (%) | Moisture (%) | Carbohydrate (%) | Energy (Kcal) |
|---|---|---|---|---|---|---|---|
| 50K:35B:15Q | 11.35 ± 0.31a | 1.90 ± 0.08d | 10.11 ± 0.21a | 2.42 ± 0.21ab | 3.20 ± 0.05c | 71.02 ± 0.02e | 346.60 ± 1.91d |
| 50K:30B:20Q | 10.42 ± 0.26b | 2.33 ± 0.18c | 9.49 ± 0.24b | 2.34 ± 0.17cb | 3.31 ± 0.23c | 72.10 ± 0.68d | 351.08 ± 1.39c |
| 50K:25B:25Q | 9.89 ± 0.14b | 2.70 ± 0.06b | 7.29 ± 0.22c | 2.24 ± 0.09cb | 3.48 ± 0.23bc | 74.39 ± 0.44c | 361.49 ± 1.36b |
| 50K:20B:30Q | 8.21 ± 0.50c | 3.06 ± 0.17a | 5.65 ± 0.19d | 2.08 ± 0.25c | 3.71 ± 0.23b | 77.29 ± 0.48b | 369.56 ± 1.81a |
| 100K (Control) | 1.72 ± 0.16d | 0.83 ± 0.07e | 4.32 ± 0.25e | 2.68 ± 0.09a | 4.08 ± 0.12a | 86.36 ± 0.31a | 359.83 ± 1.54b |
Table 3: The proximate composition of bread developed from kocho blended with broad bean and QPM per 100 g.
Crude protein content: As shown in Table 3, the mean values varied among different blending ratios. The highest protein content was observed in 50K:35B:15Q (11.35 ± 0.31) and followed by 50K:30B:20Q (10.42 ± 0.26). There was a significant difference among 50K:35B:15Q, 50K:20B:30Q and control. The crude protein increased with increase in amount of broad bean proportion. This may be because legumes and cereals have higher protein contents than other root and tuber crops [19]. The control, whole kocho flat bread, exhibited lowest amount of protein value (1.72 ± 0.16). This is true for all food products from enset due to its low protein content (4–22) g kg-1 [18]. The finding is consistent with what was reported by Kalekristos [12].
Crude fat content: As indicated in Table 3, the mean crude fat content varied among the flat bread samples with highest, 3.06 ± 0.17, in 50K:20B:30Q and lowest in control, 0.83, ± 0.07. This may be because of the difference in amount of ingredients added in blends, for example, 50K:20B:30Q contains high amount of QPM than 50K:35B:15Q, 50K:30B:20Q and 50K:25B:25Q. With increase in QPM in blends, the fat content showed an increase while the pure kocho flat bread, control, showed the lowest fat content. This may be because the low-fat content in kocho [20]. The finding is in agreement with Kebebu et al. [21].
Crude ash content: The mean ash content showed variation in different blending (Table 3). There was no significant difference between 50K:35B:15Q and whole kocho flat bread samples. The blends show decrease in ash value from 50K:35B:15Q to 50K:20B:30Q, this indicates that as the inclusion rate of broad bean increased, ash content also increased. The highest amount of ash was observed in whole kocho flat bread (2.68 ± 0.09). This value was in agreement with that of Kalekristos [12] findings. The whole kocho flat bread containing high amount of ash indicates that it contains more mineral.
Crude fiber content: As shown in Table 3, there was a significant difference between all flat bread samples. The highest fiber content was observed in blending ratio 50K:35B:15Q (10.11 ± 0.21) and the lowest was observed in whole kocho flat bread sample (4.32 ± 0.25). This may be because kochom has long fibers that cannot pass through 1 mm sieve due to this most fibers were taken out before bread sample preparation. Therefore, another process was conducted in locally available material to shred the fibers to finer form (Figure 1). This in turn decreases the availability of crude fiber in the whole kochom flat bread sample. As the proportion of broad bean increased fiber content was also showed to increase and reverse way as the inclusion of QPM increased fiber content was decreased. From this, one can see that the crude fiber content of broad bean was higher than quality protein maize as well as kocho. There is epidemiological evidence that population groups which consume reasonable amounts of dietary fiber (20 g-35 g/day) have lower risk of a number of chronic diet-related diseases such as obesity, coronary heart disease, type 2 diabetes mellitus, gall stone, constipation, hemorrhoids and irritable bowel syndrome [22]. Therefore, blending of the high fibrous broad bean with kocho makes it more advantageous, not only in increasing the protein values of the bread samples also, for health by reduction of dietrelated risks. It was also shown in Kebebu et al. [21] findings.
Total carbohydrate content: From the result showed in Table 3, all bread samples were significantly different at p<0.05. The whole kocho flat bread sample showed highest amount of carbohydrate content (86.36 ± 0.3%). This was due to the nature of kocho, it is whole starch food. As the proportion of QPM increases the blends show a remarkable increase in carbohydrate which is between 71.02% and 77.29%. This implies that the carbohydrate content of kocho is greater than quality protein maize and it is greater than the broad bean. This result is in agreement with the findings of Kalekristos [12].
Energy content: As indicated in Table 3, highest energy was observed in 50K:20B:30Q (369.56 ± 1.81 Kcal/g). This is due to the highest amount of fat in 50K:20B:30Q bread sample and highest inclusion of QPM in this flat blend. The lowest was observed in 50K:35B:15Q (346.60 ± 1.91 Kcal/g) because this blend has lowest carbohydrate content due to highest inclusion of broad bean. There is no significant difference between 50K:25B:25Q and control flat bread sample but there is a significant difference within 50K:35B:15Q, 50K:30B:20Q and 50K:20B:30Q. As shown in Table 3, all products have high energy content with small variation that maximum was 369.56 and minimum was 346.6. This is due to the high carbohydrate content of kocho. Blending legumes in kocho have a great role in increasing protein value but it did not have role in energy, rather adding cereal grain like maize played role to increase the energy content of the products.
Selected minerals (Iron, Zinc and Calcium) contents: As the results are shown in Table 4, the amount of Fe and Ca are higher in whole kocho flat bread sample than other blends. This is because Kocho naturally contains higher amount of these minerals and due to the higher amount of ash in the whole kocho bread Table 4, i.e. the amount of ash found in the flat breads is directly proportional to the mineral contents found in the flat breads. This makes the Kocho and broad bean application in the meal formula reduces the risk of mineral deficiency and malnutrition problems in Ethiopia.
| Samples | Fe (mg/100 g) | Ca (mg/100 g) | Zn (mg/100 g) |
|---|---|---|---|
| 50K:35B:15Q | 5.43 ± 0.19c | 134.33 ± 5.17b | 1.97 ± 0.04b |
| 50K:30B:20Q | 5.46 ± 0.01c | 131.21 ± 13.04bc | 1.91 ± 0.04b |
| 50K:25B:25Q | 6.95 ± 0.80b | 114.51 ± 7.41c | 2.32 ± 0.47ab |
| 50K:20B:30Q | 7.28 ± 0.07b | 122.17 ± 0.34bc | 2.57 ± 0.002a |
| 100K (Control) | 8.67 ± 0.38a | 167.15 ± 2.03a | 2.05 ± 0.004ab |
Table 4: Mineral contents of the blended breads.
There was no significant difference between 50K:30B:20Q and 50K:20B:30Q but whole kocho flat bread sample exhibited significant difference with all the rest blends. It also exhibited the highest value of calcium (167.15 mg/100 g) than others. This may be due to the presence of the high amount of ash in kocho.
Mean value of iron in whole kocho bread sample (8.67 ± 0.38 mg/100 g) showed significant difference with all blending ratios. This indicates that the whole kocho bread contains highest amount of iron. Therefore, blending kocho with other supplementary food items can enhance the iron content of the blends. This value is nearly agreed with the value indicated in Pijls et al. [18].
Regarding calcium content of the formulated flat breads, there is no significant difference between 50K:30B:20Q and 50K:20B:30Q but whole kocho flat bread sample exhibited significant difference with all blending ratios. It also scores the highest value (167.15 mg/100 g) than others. This may be due to the presence of a high amount of minerals in kocho. This finding is agreed with that of Albert et al. [23].
As indicated in Table 4, the Zn value varies with the amount of QPM. This may be because QPM is a good source of Zn [24]. Due to this reason the highest content of Zn is observed in 50K:20B:30Q (2.57 ± 0.002 mg/100 g) which contains high percent of QPM. The zinc value obtained for whole kocho flat bread (2.05 ± 0.004 mg/100 g) is 5.86 times greater than that observed in Kalekristos [12] finding which was (0.35 ± 0.00 mg/100 g). This may be due to difference in sampling area and method of bread sample preparation. But it is in agreement with that indicated in Minaleshewa [25].
Phytic acid content: We appreciate all medical students of Shaheed Beheshti University of Medical Sciences who have provided the opportunity to conduct this study.
Anti-nutrient phytic acid reduces the bioavailability of minerals [26]. It chelates divalent cations such as calcium, zinc, and iron, thereby also reducing their bioavailability [27]. Therefore, determination of phytic acid in the flat bread samples was necessary because of its toxicity, negative effects on mineral bioavailability and its health effects. It is found in high concentrations in the cereals and legumes and in lesser amounts in tubers and garden produce [28].
As depicted in Table 5, the mean value of control showed a significant difference with the rest of flat bread samples. It also showed the highest value (168.25 ± 4.25 mg/100 g) of phytic acid than other blends. It seems as it is contradicting the literature written by Muahamad et al. [28] but it may be due to treatments like soaking, mild roasting and dehulling undergone during broad bean sample preparation. These treatment mechanisms of broad bean may have decreased phytic acid contents [23].
| Samples | Phytic acid (mg/100 g) |
|---|---|
| 50K:35B:15Q | 149.77 ± 1.19b |
| 50K:30B:20Q | 149.75 ± 0.00b |
| 50K:25B:25Q | 148.37 ± 2.36b |
| 50K:20B:30Q | 144.34 ± 1.77b |
| 100K (Control) | 168.25 ± 4.25a |
Table 5: Phytic acid content for breads from composite flours.
Molar ratios of phytic acid to calcium, iron and zinc: In order to predict the inhibitory effect of phytate on calcium, iron andzinc bioavailability from bread samples, phytate/calcium, phytate/iron, phytate/zinc and [Ca][Phytate]/[Zn] molar ratios were calculated (Table 6).
| Bread Samples | PA/Ca | PA/Fe | PA/Zn | [Ca][Phytate]/[Zn] |
|---|---|---|---|---|
| 50K:35B:15Q | 0.068 | 2.34 | 7.49 | 0.251 |
| 50K:30B:20Q | 0.069 | 2.33 | 7.72 | 0.252 |
| 50K:25B:25Q | 0.078 | 1.81 | 6.29 | 0.18 |
| 50K:20B:30Q | 0.072 | 1.68 | 5.53 | 0.169 |
| 100Koch (Control) | 0.061 | 1.65 | 8.08 | 0.338 |
Table 6: The molar ratio of phytic acid to Ca, Fe and Zn.
Bioavailability is the degree to which a nutrient is absorbed and becomes available at the site of action in the body. The critical molar ratio, above which ion absorption may be impaired, has been determined at PA: Ca>1.56, PA: Fe>14, PA: Zn>10 and [Ca] [Phytate]/[Zn]>0.5mol/kg [17].
As shown in Table 6, for all flat bread samples phytate to iron molar ratio is greater than 1 and it indicated that there is poor iron bioavailability. Ideally, the molar ratio of phytate to iron should be decreased to <0.4 to attain adequate iron bioavailability [29]. Phytate to zinc molar ratio exhibited good zinc bioavailability whereas phytate to calcium molar ratio showed smaller value which indicated that there is good calcium bioavailability. The calculated [Ca][Phytate]/[Zn] molar ratio is considered a better index for predicting zinc bioavailability compared with the PA:Zn ratio [30]. The calculated [Ca][Phytate]/[Zn] molar ratio (0.169-0.338) mol/ kg are below the critical level (0.5 mol/kg), are an indication of bioavailability of dietary zinc [31]. However, the molar ratios of phytate to calcium, phytate to iron, phytate to zinc and [Ca] [Phytate]/[Zn] are below the critical molar ratio. This may be due to the techniques undergone during broad bean flour sample preparation like soaking, mild roasting and dehulling which are able to decrease the phytic acid content of the samples.
Conclusion and Recommendation
This study has demonstrated that broad bean could be used to substitute kocho up to 35% level. It also proved that blending kocho with broad bean and QPM improves nutritional value of bread without reducing the sensory quality of the flat bread. It was shown that the more the broad bean flour in blends, the more the protein, fiber and ash content of the breads. This study also revealed that zinc and iron content increases with the increase in amount of broad bean and QPM in proportion. It also observed that techniques employed in broad bean flour preparation: soaking, mild roasting and dehulling reduced phytic acid content in final product improving the bioavailability of the minerals.
The researchers recommend up to 35% broad bean incorporation to improve the protein and mineral contents of the flat breads without reducing the sensory quality. 50%K:25%B:25%Q is recommended for best nutritional and sensory quality. Further studies should be done to eliminate the beany flavour of broad bean which may affect the sensory acceptability and mineral bioavailability of the bread.
Acknowledgement
The authors acknowledge Hawassa University and Ethiopian Public Health Institute (HU) for permission of their laboratories for sample analysis and Women and Food Science (WFS) project at Mekele University for providing the financial support.
REFERENCES
- Seifu GM, Tsedeke A, Clifton H, Steven AB. Enset Research in Ethiopia. Proceedings from the International workshop on Enset based sustainable agriculture in Ethiopia, Addis Ababa, Ethiopia. 1996:204-220.
- AsnaketchW. The ecology and production of enset in Ethiopia; PhD thesis, Department of Soil Science, Swedish University of Agricultural Science, Uppsula, Sweden. 1997.
- Spring AB, Haile S, Tesfaye A, Yewelsew A, Amaldegen A, Michael EW, et al. Enset farming systems in southern region, Ethiopia. Report on a rapid rural appraisal in Gurage, Hadiya, and Sidama Zones, Addis Ababa, GTZ, Mimeo. 1996:315.
- Randy C, Ploetz KA, Jeff D, Nelson CS. Banana and plantain- an overview with emphasis on Pacific island cultivars. Musaceae (banana family). Species profiles for Pacific island agro forestry. 2007.
- NRC (National Research Council). "Enset"-lost crops of Africa: Vegetables. Lost crops of Africa. National Academies Press. 2006:2.
- Kanshie KT. Five thousand years of sustainability: A case study on Gedeo land use. PhD Dissertation. 2002:19.
- Vidal V, Frias C, Valverde JS. Effect of processing on the soluble carbohydrate content of lentils. J Food Process. 1992;55:301 -304.
- Showemimo FA, Onyibe JE, Ajibade SR, Danbaba A, Adepoju A. Potentials of Quality Protein Maize (QPM) development and seed delivery system, Kumasi, Ghana. 2005.
- Babu R. Quality protein maize in north western India: Full of protein and potential. India Council for Agricultural Research (ICAR). 2005;3:45-52.
- Liener IE, Lucas EW, Erikson DR, Nip W. Control of anti- nutritional and toxic factors in oil seeds and legumes. In: food uses of whole oil and protein seed. 1989.
- Edema MO, Sanni LO, A Sanni. Evaluation of maize-soyabean flour blends for sour maize bread production in Nigeria. Afr J Biotechnol. 2005;4(9):911-918.
- Kalekristos Y. Influence of baking time and temperature on the quality of kocho biscuit enriched with Faba Bean and wheat. Addis Ababa University, Addis Ababa. 2010.
- Seifu HW. A study on Enset as a means of existence, social organization, and ethnical identification for the Gurage people, Institute of Social Anthropology, Faculty of Social Science, University of Tromsø spring, Norway. 2009.
- AOAC (Association of Official Analytical Chemists). Official methods of Analysis, 17th ed., Arlington, Virginia, USA. 2003.
- Latta M, Eskin M. Simple and rapid colorimetric method for phytate determination. J Agric Food Chem. 1980;28:1315-1317.
- Vaintraub IA, Lapteva NA. Colorimetric determination of phytate in unpurified extracts of seeds and the products of their processing. Analytic Biochem. 1988;175:227-230.
- Sonia T, Sayma P, Sanjay K, Alak K D, Aysha F, Siddiquee MA, et al. Content of some minerals and their bioavailability in selected popular rice varieties from Bangladesh. Int J Curr Microbiol App Sci. 2013;2(7):35-43.
- Pijls LT, Timmer AM, Wolde-Gebriel Z, West CE. Review on Cultivation, preparation and consumption of Ensete (EnseteVentricosum) in Ethiopia. J Sci Food Agri. 2006;67:1-11.
- Dioguardi FS, Shaish A. Adverse Effects associated with protein intake above the recommended dietary allowance for adults. ISRN Nutri Vol. 2013:1-6.
- Aune J, Made T. Advancing human nutrition without degrading land resources through modeling cropping systems in the Ethiopian Highlands. UN Univ Food Nutr Bulletin. 2004;25:1-12.
- Kebebu A, Whiting SJ, Dahl WJ, Henry CJ, Kebede A. Formulation of a complementary food fortified with broad beans (Viciafaba) in Southern Ethiopia. Afr Agric For J. 2013;13:7789-7803.
- Adegoke OA, Fadupin GT, Ketiku AO. An assessment of the dietary fiber intake of selected students in the University of Ibadan, Ibadan. Nigeria J Biomed. 2006;9:157-162.
- Albert L, Klanarong S, Tzou-chi H. Proximate composition, mineral contents, hydrogen cyanide and phytic acid of 5 cassava genotypes. J Sci Food Chem. 2005;92(4):615-620.
- Brown KH, Wessells KR, Hess SY. Zinc bioavailability from zinc fortified foods. Int J Vitam Nutr Res. 2007;77(3):174-181.
- Minaleshewa A. Studies on commercially available Enset, Enseteventricosum (Welw.), Cheesman) food Products (Kocho and Bulla) for Major, Minor and Trace Elements. 2007.
- Lestienne I, Rivier CM, Verniere CI, Rochette I, Treche S. The effects of soaking of whole, dehulled and ground millet and soybean seeds on phytate degradation and Phy/Fe and Phy/Zn molar ratios. Int J Food Sci Tech. 2005;40(4):391-399.
- Sandberg AS. Bioavailability of minerals in legumes. Br J Nutr. 2002;88(3):S281-S285.
- Muahamad N, Faqir MA, Rai MA, Moazzam R, Shahzad H, Muhammad S. An overview of anti-nutritional factors in cereal grains with special reference to wheat- A review. Pak J Food Sci. 2010;20(1-4):54-61.
- Hurrell RF, Lynch S, Bothwell T, Cori H, Glahn R, Hertrampf E, et al. Enhancing the absorption of fortification iron a sustain task force report. Inter J Vitam Nutr Res. 2004;74:387-401.
- Akindahunsi AA, Oboh G. Effect of some postharvest treatments on the bioavailability of zinc from some selected tropical vegetables. La RivistaItaliana Delle Grasse. 1999;76:285-287.
- Davies NT, Warrington S. The phytic acid, mineral, trace element, protein and moisture content of UK Asian immigrant foods. Human Nutr App Nutr.1986;40:49-59.
Citation: Serka S, Getahun D, Abegaz K (2019) Formulation and Sensory Acceptability of Flat Bread from Kocho with Broad Bean (Vicia faba L.) and Quality Protein Maize (Zea mays) Flours. J Food Process Technol 10:812. doi:10.35248/2157-7110.19.10.812
Copyright: © 2019 Serka S, et al. This is an open-access article distributed under the terms of the Creative Commons Attribution License, which permits unrestricted use, distribution, and reproduction in any medium, provided the original author and source are credited.
