Indexed In
- Open J Gate
- RefSeek
- Hamdard University
- EBSCO A-Z
- OCLC- WorldCat
- Publons
- International Scientific Indexing
- Euro Pub
- Google Scholar
Useful Links
Share This Page
Journal Flyer

Open Access Journals
- Agri and Aquaculture
- Biochemistry
- Bioinformatics & Systems Biology
- Business & Management
- Chemistry
- Clinical Sciences
- Engineering
- Food & Nutrition
- General Science
- Genetics & Molecular Biology
- Immunology & Microbiology
- Medical Sciences
- Neuroscience & Psychology
- Nursing & Health Care
- Pharmaceutical Sciences
Research Article - (2024) Volume 13, Issue 2
Evaluation of Reservoir Water-Spread Area by Various Image Classification Techniques Using Remote Sensing-A Study on Vaigai Reservoir
Navindiran B*Received: 27-Feb-2020, Manuscript No. JGRS-24-3503; Editor assigned: 03-Mar-2020, Pre QC No. JGRS-24-3503 (PQ); Reviewed: 17-Mar-2020, QC No. JGRS-24-3503; Revised: 01-Jul-2024, Manuscript No. JGRS-24-3503 (R); Published: 29-Jul-2024
Abstract
This study outlines the estimation of reservoir water spread area of the Vaigai reservoir using remote sensing technique. The multi-purpose reservoirs when conducted periodical capacity surveys helps in determining the rate of sedimentation and reduction in the storage capacity. The conventional methods are hydrographic surveys wherein the water spread area is estimated and is input into the trapezoidal formula to estimate the storage capacity of a reservoir. Such methods are however time consuming, cumbersome and expensive. As an alternative, multi-date satellite remote sensing provides the water-spread area of a reservoir at different water levels in a time and cost effective manner, which can then be input into the trapezoidal formula. Traditional approaches of water spread area estimation from satellite image data include the maximum likelihood, minimum distance to mean, Mahalanobis distance and neutral net which implements per-pixel based methodology and allocate a pixel to a single land cover type. One of the restrictions of these approaches is the pixels present in the peripheral portion of the reservoir contains a mixture of soil, vegetation and water, which are entirely classified as water which results to inaccurate estimates of the waterspread area. In this study, landsat 8-oli and sentinel 2 satellite data of thirteen dates pertaining the years 2017 and 2018 were used and per-pixel classification approach was adopted to extract the water-spread area of the reservoir. The aim of this paper is to examine the per-pixel classification approach on the multispectral data of the reservoir. The water spread area and water levels of the corresponding dates were collected from the Vaigai reservoir authority and were compared with the water spread area of the respective dates derived through per pixel classification.
Keywords
Reservoir; Water spread area; Image classification
Introduction
The importance of mapping the earth surface features using satellite imagery has increased in the recent past. For sustainable management of natural resources in earth surface which are introduced to intense exploitation requires monitoring at regular intervals. For sustainable and socio-economic development, human survival and healthy eco-system water plays a major role. Managing the water bodies is necessary as it helps to determine future irrigation expectations, planning, developing, distributing and managing the optimum use of water resources. Mapping of water bodies in spatiotemporal domain helps in analysis and assess the extent and rate of their disappearance and degradation.
Earth surface is a heterogeneous terrain, to map this geospatial tools seem to be advantageous for impact assessment and conservation measures. Scientists across the world have used different satellite data differing in spatial, spectral and temporal aspects to generate thematic maps of land use and land cover with special importance on water bodies [1].
A reservoir is an artificial or natural place where water is collected and stored for use, especially water for supplying a community, irrigating land, generating power, recreation, fish and wildlife etc. The common method of estimating the waterspread area at different water level of the reservoir is by regular field survey.
But estimation of water spread area through field survey is expensive, tedious, time consuming and involves more man power. Hence such surveys cannot be carried out regularly. As a preference to the conventional methods remote sensing technique provides time and cost efficient estimation of water spread area of reservoirs. The extraction of water spread area from satellite images is performed using image analysis process which is done to derive the information from the remote sensing image. The information extraction is done by two methods such as visual interpretation using interpretation keys and digital image classification. In digital image classification the per-pixel techniques such maximum likelihood, minimum distance mean, Mahalanobis distance and neural net classification are performed. These techniques assign a pixel to a single land cover type, but a single pixel may contain more than one type of land cover known as mixed pixel. In the boundaries of two or more discrete classes these mixed pixels are very common, hence results in over and under estimation of water spread area. These errors can affect the estimation of water spread area which in turn causes problems in irrigation scheduling [2].
The need for this study is to absolutely calculate the water spread area of the Vaigai reservoir to the maximum possible extent using per-pixel classification approach. The main objective of the study is to extract the water spread area using per-pixel classification and make a comparative analysis between the water spread areas extracted through sub-pixel classification and with field collected data.
The Vaigai reservoir lies in the middle of the Vaigai river basin, occupying an arc shaped area which extends from the western ghat mountain of Kerala in the west to the Bay of Bengal in the east, with a general gradient towards northeast, initially upto Theni and then towards south east direction up to the sea. The river Vaigai originates in the eastern slope of the western ghat mountainous offshoot in the Varushanad area and flows northwards through Gandamanayakkanur. The river is joined by several tributaries over a length of 43 Km and reaches the plain area. The Vaigai basin has a typical tropical climate. The river basin consists of hard crystalline rock masses of archean age for the most part (74%) on the western portion and sedimentary rocks of the upper gondwana, terriary and quarternary age on the eastern portion (26%).
In the basin area it is found to be there are six types of soil. The upper Vaigai basin is marked with deep red soil to thin red soil along with foam loamy soil and aeolian soil in pockets. The central basin area is marked with thin red sandy soil and red soil. In lower Vaigai basin area, alluvial soil is met with most part boarded nearby laterite soil cover. Vaigai basin is about 7031 sq.km. and its catchment area covers the Theni, Madurai and Ramanathapuram districts of Tamilnadu. It lies between the geographic coordinates of 9°15’ N to 10°20’N latitude and 77°10’E to 79°15’E longitude and falls within the survey of India toposheets 58 G, 58 F and 58 K.
The FRL of the reservoir is 279.197 m and catchment area of 2255.127 sq.km. The live storage of the reservoir ranges between RL257.556 m and RL279.2 m. The dead storage capacity ranges between RL249.93 m and RL257.56 m. The capacity of the reservoir at maximum water level is 194.8 mm3 (Figure 1) [3].
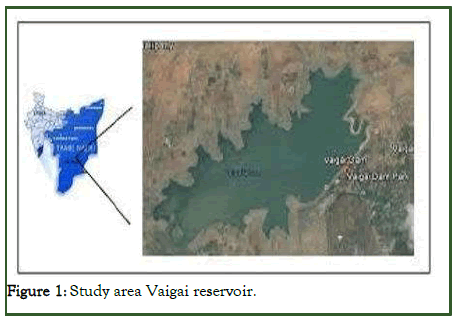
Figure 1: Study area Vaigai reservoir.
Data used
Thirteen different dates of satellite pass are acquired by Sentinel-2 with spatial resolution of 10 m and landsat 8-oli with spatial resolution of 30 m are used in this study. The different dates of satellite pass along with their respective water spread areas were collected from the Vaigai reservoir authority (field data).
Materials and Methods
The changes in the water spread area could be accurately estimated by analyzing the satellite image data over a period of time. Per-pixel classification approaches have been used in this study to extract the water spread of the reservoir. The work has been carried out using digital image processing software. Image classification is the most probably used technique for deriving information from the remotely sensed data. This image classification is performed by using either visual interpretation and digital processing.
Here in this study digital image classification is performed by spectral information represented by the digital number in one or more spectral bands. This attempt to classify each individual pixel (per-pixel) based on this spectral information. A number of commonly used per pixel based classifiers exist including the maximum likelihood, minimum distance mean, Mahalanobis distance and neural net classification [4].
The requirement of per-pixel classification technique is that the user/analyst has sufficient pixels (training sets) available for which the true class is known. From these pixels, representative signatures can be developed for those classes for subsequent classification.
The following are the steps involved in supervised classification which includes (i) identification and decisions relating to the set of cover/classes types into which the image is to be segmented, (ii) choice of the representative pixels for each of the desired set of classes (i.e., construct the training data), (iii) estimation of the parameters (e,g. class signatures) of the classification algorithm from the training data, (iv) use of the classifier to label (or classify)every pixel in the image into one of the predetermined/ desired cover type, (v) production of thematic maps which contain the results of the classification and (vi) determination of the accuracy of the classification by comparing the output with ground truth data. Choice of the number of training pixels is an important aspect of per-pixel classification. The bigger the better that is more number of training set gives better results. By adopting the per-pixel classification approaches the water spread area of the reservoir is estimated (Figure 2).
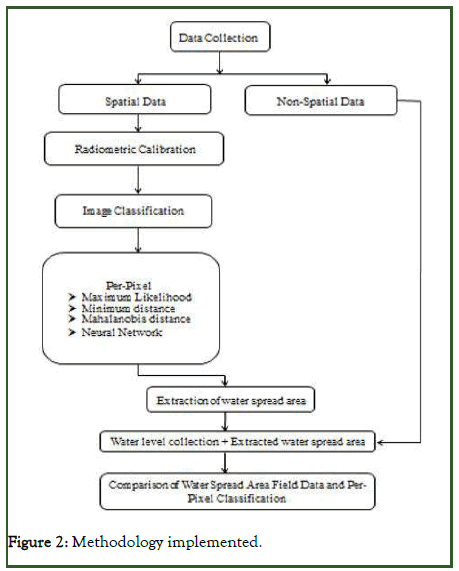
Figure 2: Methodology implemented.
Results and Discussion
The per-pixel classified images pertaining to Vaigai reservoir for thirteen different dates with different water levels are shown in Figures 3-7. In these images the water-spread area is presented in blue colour, while the vegetation classes are presented in green colour and the soil classes are presented in brown colours respectively. Thus three types of land cover classes have been clearly chosen for the images which represents a higher water level in the reservoir. In a close observation.
In a close observation of the classified output further reveals that, the water spread area allotted erroneously to pixels that represents soil or vegetation classes in image corresponding to low water level of the reservoir, especially for pixels representing the periphery of the reservoir [5].
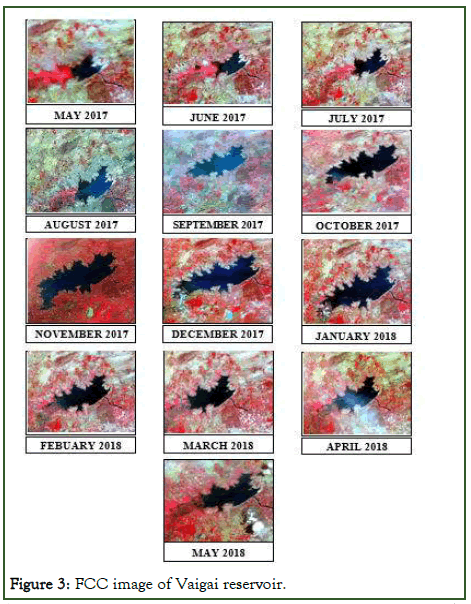
Figure 3: FCC image of Vaigai reservoir.
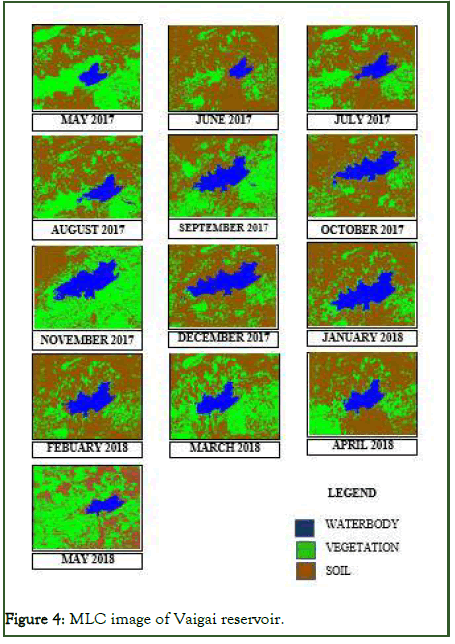
Figure 4: MLC image of Vaigai reservoir.
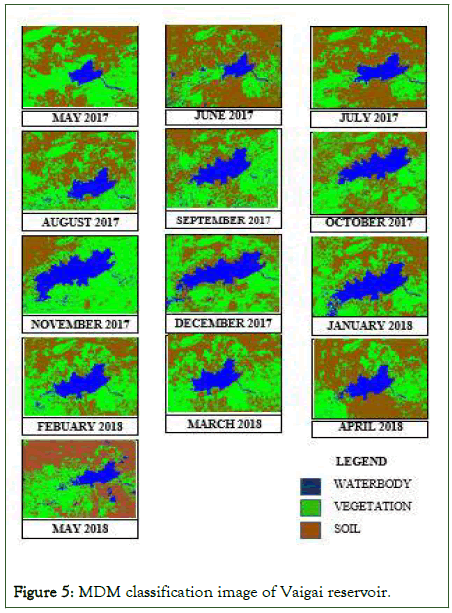
Figure 5: MDM classification image of Vaigai reservoir.
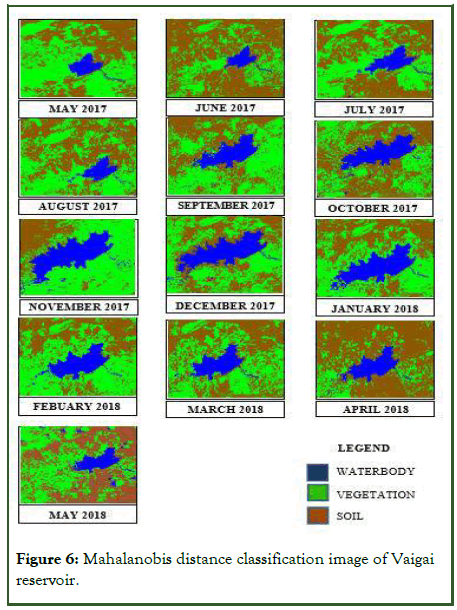
Figure 6: Mahalanobis distance classification image of Vaigai reservoir.
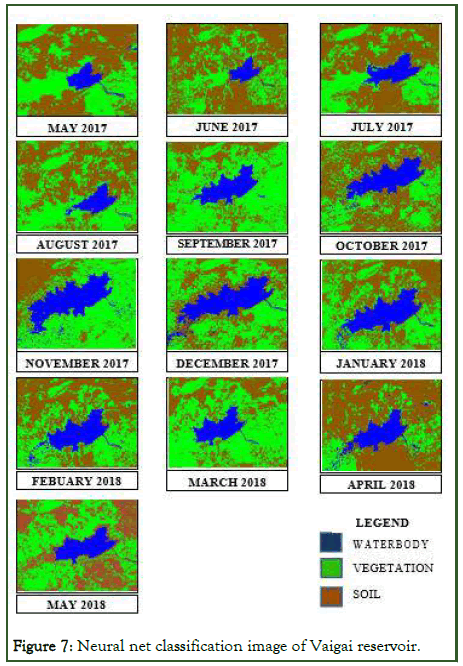
Figure 7: Neural net classification image of Vaigai reservoir.
With the aim of extracting as much information about land cover classes as possible, supervised classification was performed in this study. The supervised classification were performed by using training sets generated for the different land cover classes in and around the reservoir. Since this involves the estimation of pixels that are occupied by water, it is essential that the training set generation should involve careful selection of water pixels. It may be noted that the image subset of the study area contains vegetation and soil as the primary land cover classes in addition to the water class. Therefore, only three feature/land cover classes were considered to generate training sets for classification [6].
Training sets were selected from the center of the reservoir, periphery of the reservoir, from the agricultural fields, shrubs in the peripheral areas and from barren lands representing the soil class. This procedure was followed carefully for all the 13 images representing the Vaigai reservoir.
Thus the per-pixel classification is carried out for Vaigai reservoir and various classes such as waterbody, vegetation and soil are classified using the per-pixel classifiers.
Estimation of water-spread area
Water-spread area of the reservoir at a particular water level was calculated by multiplying the number of pixels that has been extracted using the methodology mentioned, with the area (30 m × 30 m) of a pixel. The Table 1 shows the water spread area estimated from the classified image over thirteen satellite pass dates.
| S.No. | Date of satellite pass | Estimated water spread area (Sq.km) | ||||
|---|---|---|---|---|---|---|
| Field data | MLC | MDM | MAH | NN | ||
| 1 | 17.05.2017 | 4.697 | 1.553 | 2.628 | 2.131 | 2.158 |
| 2 | 04.06.2017 | 4.521 | 1.656 | 3.503 | 2.401 | 2.195 |
| 3 | 17.07.2017 | 5.431 | 2.331 | 3.762 | 3.133 | 3.497 |
| 4 | 02.08.2017 | 5.833 | 3.024 | 4.924 | 2.836 | 3.026 |
| 5 | 26.09.2017 | 10.024 | 8.244 | 11.674 | 8.517 | 8.193 |
| 6 | 10.10.2017 | 12.771 | 9.695 | 12.026 | 12.811 | 12.607 |
| 7 | 10.11.2017 | 16.861 | 11.451 | 16.7 | 16.758 | 16.448 |
| 8 | 29.12.2017 | 10.847 | 8.483 | 11.628 | 11.949 | 11.521 |
| 9 | 14.01.2018 | 9.949 | 7.769 | 10.279 | 10.225 | 9.451 |
| 10 | 15.02.2018 | 8.309 | 5.523 | 7.582 | 7.639 | 7.821 |
| 11 | 19.03.2018 | 6.193 | 4.125 | 5.195 | 5.459 | 4.989 |
| 12 | 20.04.2018 | 7.437 | 4.707 | 6.214 | 6.239 | 7.188 |
| 13 | 06.05.2018 | 6.477 | 3.63 | 6.932 | 6.219 | 4.118 |
Table 1: Estimation of water spread area.
The Figures 8-12 represents the bar graph which shows the estimated water spread area in y axis with corresponding satellite pass dates in x axis.
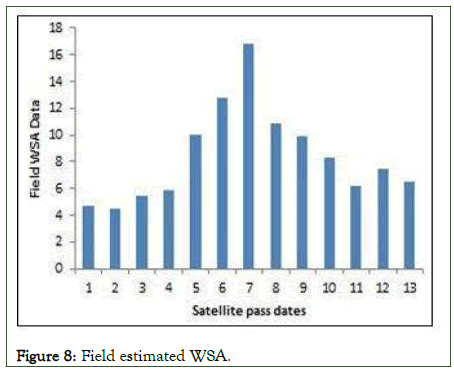
Figure 8: Field estimated WSA.
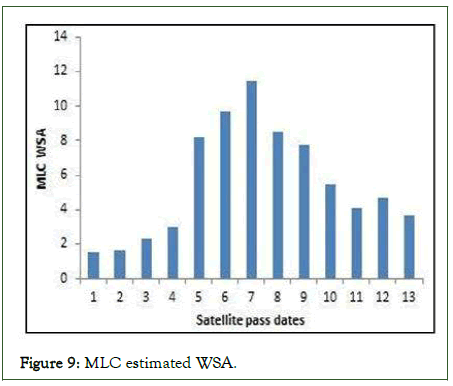
Figure 9: MLC estimated WSA.
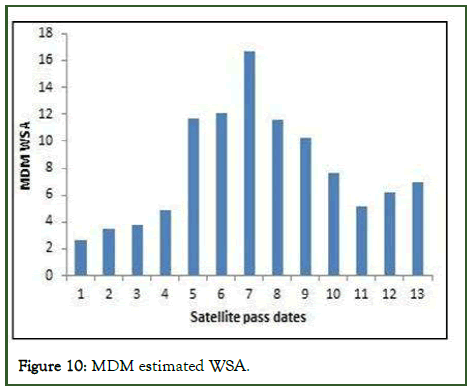
Figure 10: MDM estimated WSA.
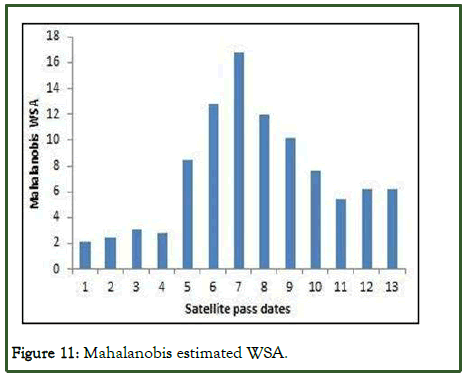
Figure 11: Mahalanobis estimated WSA.
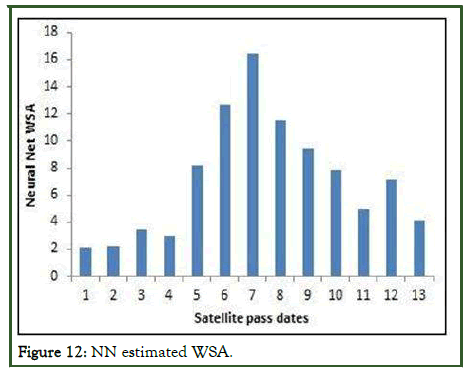
Figure 12: NN estimated WSA.
The Figures 13-16 represents the graph which compares the field collected water spread area with the supervised classifier performed [7]. The results of coefficient of determination showed 0.948 for maximum likelihood classification, 0.953 for minimum distance mean classification, 0.9587 for Mahalanobis distance classification and 0.9656 for neural net classification.
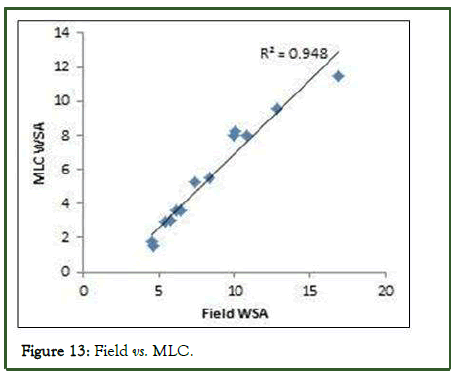
Figure 13: Field vs. MLC.
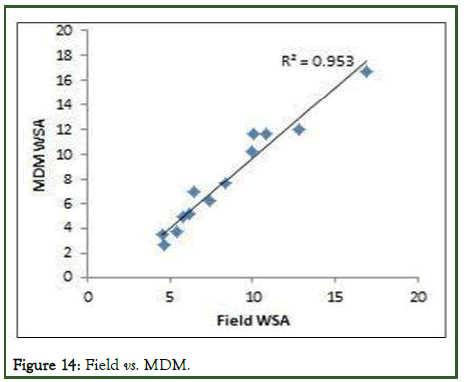
Figure 14: Field vs. MDM.
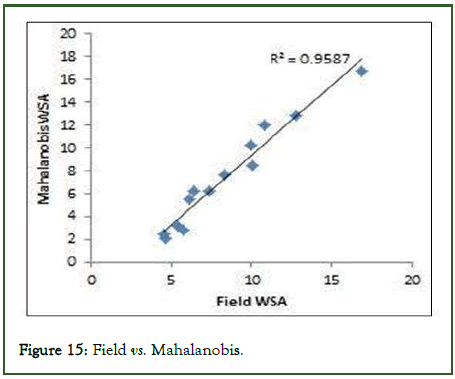
Figure 15: Field vs. Mahalanobis.
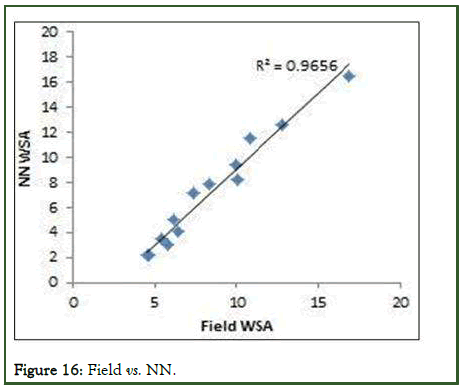
Figure 16: Field vs. NN.
From the above results it is seen that neural net classification performed well compared to other classifiers. But at the same time the coefficient of determination with higher values are not necessarily good and small values are not always a problem. Hence it is observed that the maximum likelihood classifier delineated the water spread area when visually interpreted [8-11].
Conclusion
The adequate information about the spectral characteristics of the reservoir water and water in the peripheral areas, in the visible and NIR wavelengths are obtained from the multi temporal image data sets pertaining to different water levels of the reservoir. While water in the central portions of the reservoir have strong absorption in the visible and NIR wavelengths, the water in the peripheral pixels of the reservoir have moderate to high spectral response in the visible and NIR wavelengths. This leads to conclude that the peripheral pixels and pixels in the central portion of the reservoir can be discriminated by using the visible and NIR bands. However due to the moderate to high response in VNIR band, the water peripheral pixels implies that there could be in accuracies while classifying these pixels as water.
Therefore, it is suggested that use of an image data, where spectral overlap exists, might result in inaccuracies while computing water spread area, perhaps due to per-pixel allocation by the classifiers and due to the coarse resolution of the image data. To overcome the limitation offered by the phenomena of spectral overlap and coarse resolution, it was thought that the landsat and sentinel series images may yield more accurate information if a sub pixel approach to the classification is adopted.
References
- Pandey A, Chaube UC, Mishra SK, Kumar D. Assessment of reservoir sedimentation using remote sensing and recommendations for desilting Patratu reservoir, India. Hydrol Sci J. 2016;61(4):711-718.
- Durbude DG, Purandara BK. Assessment of sedimentation in the Linganmakki reservoir using remote sensing. J Indian Soc Remote Sen. 2005;33(4):503-509.
- Foody GM, Cox DP. Sub-pixel land cover composition estimation using a linear mixture model and fuzzy membership functions. Remote Sen. 1994;15(3):619-631.
- Goel MK, Jain SK, Agarwal PK. Assessment of sediment deposition rate in Bargi reservoir using digital image processing. Hydrol Sci J. 2002;47(S1):S81-S92.
- Jeyakanthan VS, Sanjeevi S. Reservoir capacity estimation of Singoor reservoir, India, by per-pixel and sub-pixel processing of multi-date satellite images. Geocarto Int. 2011;26(4):305-320.
- Manavalan P, Sathyanath P, Rajegowda GL. Digital image analysis techniques to estimate waterspread for capacity evaluations of reservoirs. Photogramm Eng Remote Sensing. 1993;59(9):1389-1395.
- Mas JF. Monitoring land-cover changes: A comparison of change detection techniques. Int J Remote Sensing. 1999;20(1):139-152.
- Mani P, Chakravorty B. Remote sensing based sedimentation study of Maithon reservoir. J Indian Soc Remote Sen. 2007;35:117-120.
- Peng D, Guo S, Liu P, Liu T. Reservoir storage curve estimation based on remote sensing data. J Hydrol Eng. 2006;11(2):165-172.
- Mishra SP, Kumar C, Mishra A, Mishra S, Patel A. Estimation of sediments in Rengali reservoir, Odisha (India) using remote sensing. Int J Environ Clim. 2021;11(12):205-225.
- Jain SK, Agarwal PK, Singh VP, Jain SK, Agarwal PK, Singh VP. Reservoirs and Lakes. Hydrol Water Res India. 2007:937-996.
Citation: Navindiran B (2024) Evaluation of Reservoir Water-Spread Area by Various Image Classification Techniques Using Remote Sensing-A Case Study on Vaigai Reservoir. J Remote Sens GIS. 13:348.
Copyright: © 2024 Navindiran B. This is an open-access article distributed under the terms of the Creative Commons Attribution License, which permits unrestricted use, distribution and reproduction in any medium, provided the originalauthor and soure
