Indexed In
- Open J Gate
- The Global Impact Factor (GIF)
- Open Archive Initiative
- VieSearch
- International Society of Universal Research in Sciences
- China National Knowledge Infrastructure (CNKI)
- CiteFactor
- Scimago
- Ulrich's Periodicals Directory
- Electronic Journals Library
- RefSeek
- Directory of Research Journal Indexing (DRJI)
- Hamdard University
- EBSCO A-Z
- Publons
- Google Scholar
Useful Links
Share This Page
Journal Flyer
Open Access Journals
- Agri and Aquaculture
- Biochemistry
- Bioinformatics & Systems Biology
- Business & Management
- Chemistry
- Clinical Sciences
- Engineering
- Food & Nutrition
- General Science
- Genetics & Molecular Biology
- Immunology & Microbiology
- Medical Sciences
- Neuroscience & Psychology
- Nursing & Health Care
- Pharmaceutical Sciences
Original Research Article - (2021) Volume 11, Issue 11
Evaluation of Nutrient Removal Dynamic in Post Treatment Slow Sand Filter Unit
Samir A Afifi1*, Amany A Elfari2 and Samir Alnahhal32Faculty of Science, Environmental & Rural research center -IUG, P.O Box 108, Gaza, Gaza Strip,, Palestine
3Institute of Water and Environment, Al Azhar University – Gaza, P.O. Box 1277. Jamal Abdel Naser Street, Gaza, the State of Palestine, Palestine
Received: 17-Oct-2021 Published: 08-Nov-2021
Abstract
Using Slow Sand Filter (SSF) is a well-known approach for post wastewater treatment. The paper presents and evaluates using of SSF as post treatment unit after a secondary biological treatment in Rafah Wastewater treatment Plant (RWWTP), Gaza Palestine. Samples were collected and analyzed for the post treatment SSF unit in order to evaluate the nutrient removal.
Results show that 50% of Total Kjeldahl Nitrogen (TKN), 47% of Ammonia (NH4), and 55% ortho-phosphorous were removed from the final effluent of the whole unit. The SSF led to increase the concentration of nitrate due to high concentrations of Dissolved Oxygen (DO), which is an important factor affecting the nitrification process and the oxidation of nitrogen reduce form.
Keywords
Post treatment; Wastewater; Nutrients removal; Slow sand filter; Gaza
Introduction
Climate change and a growing population in the Mediterranean Rim are increasing the demand for water and, as a result, the pressure on both quantity and quality of water supplies. Highquality water should be used primarily for drinking, while reclaimed water can be used for other purposes [1], the human health and the environment protection, and the economy development, all gain from the use of treated wastewater in agriculture. Wastewater would provide an alternative or non-conventional water supply, particularly for agriculture that is the world's largest water user consuming over 70% of available water [2].
The given international quality standards, regulations, and guidelines try to manage the potential negative impacts, which could be generated from wastewater reuse. Developing and adopting national guidelines for reuse is a topic of great concern. The Palestinian experience with reclaimed wastewater reuse is limited, insufficient, and scattered, as infrequent projects have been attempted to reuse wastewater in the Gaza Strip during the last three decades with the support of many international institutions and donors. The key impediment issue was the poor quality of the effluents produced by the major wastewater treatment plants in addition to some administrative, governance, and socio-economic barriers.
In April 2018, a recent initiative to reclaim wastewater and reuse in agricultural irrigation in Rafah City through constructing a Post-Treatment Sand Filter Plant, (PSFP), which is basically provide additionally treatment to the effluent of Rafah Wastewater Treatment Plant WWTR. The recent evaluated of Rafah WWTP performance revealed that the plant is overloaded and the effluent quality is not fit for reuse in agriculture [3]. Therefore, the PSFP was planned and designed to provide a treated effluent with suitable quality corresponding to the Palestinian Standard institute guidelines, which is fit for agricultural reuse. The PSFP is mainly depends on Slow Sand Filtration (SSF) in the additional treatment. Through many previous studies, it can be conclude that SSF would be a promising technology for the effluent post treatment in developing countries, where treated effluent can be reused for various recreational purposes [4-7]. In the same region, another study have evaluated the performance of sand filter to improve the effluent wastewater after the secondary treatment in the Gaza WWTP. The study has revealed that the application of sand filters will significantly improve the quality of treated wastewater, particularly by increasing the retention time in the sand filter [8].
The overall objective of the PSFP is to contribute to more sustainable water and agricultural practices through strengthen integrated water resource management for reducing land-based sources of marine pollution by adopting innovative environmental and agricultural solutions in southern Gaza (Rafah and Khan Younis Governorates). The PSFP was designed with a maximum treatment capacity of 3,600 m3 daily pumped effluent to the Mediterranean Sea from Rafah WWTP with partially or secondary treatment. Therefore, a good plan of utilizing this quantity would have several benefits, including securing addition source of water for irrigation, release pressure on the groundwater – the sole resource of fresh water in the Gaza Strip – , and reduce contamination to the coastal sea water.
Methodology
The research methodology relied on a comprehensive monitoring program in which samples were collected from eight (8) defined sampling points at the SSF in the PSFP and followed by conducting field measurements and laboratory testing and analysis. The samples were collected eight times in the period from 5/1/2020 to 10/1/2021. Grab samples were collected using a clean 2-liter plastic bottles for chemical and physical parameters. The collected samples were placed in an icebox and transported to the laboratory. The related analyzes were conducted in the laboratories of the Islamic University of Gaza, Environmental and Rural Research Center (ERRC). Statistical analyses of the results were conducted using Microsoft Excel and analysis of the results carried out to evaluate the efficiency of overall supply point and different pints within the SSF system.
The PSFP is located in the southwest of the Rafah city nearby the dividing line between the Gaza Strip and Egypt. The general layout of the PSFP is presented in Figure 1.
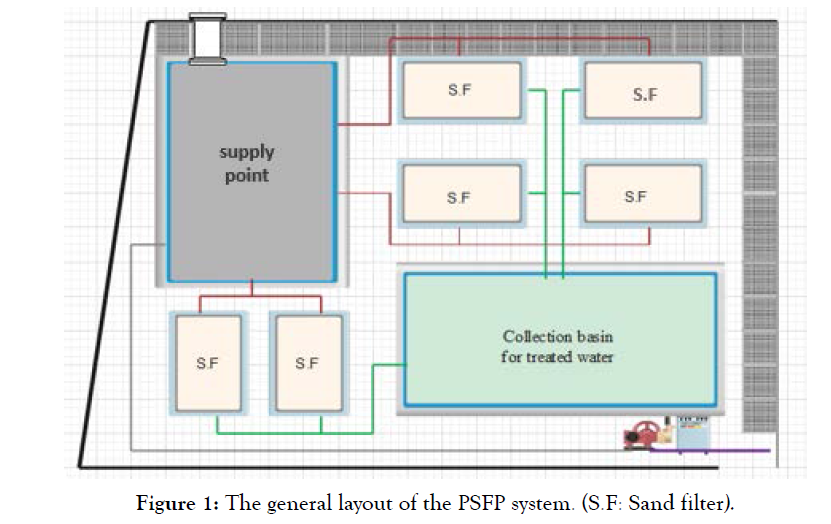
Figure 1: The general layout of the PSFP system. (S.F: Sand filter).
The PSFP consists of one supplying pond, six (6) sand filter basins and one effluent collection and storage pond. Based on PSFP system set-up, the eight (8) defined sampling locations are presented in Figure 2 and Table 1 represents the identifications of the sampling locations.
| Sampling Point | Location of sampling point | Treatment Process |
|---|---|---|
| S 1 | Inlet supplying pond | TP1 |
| S 2 | In (A), Inlet for sand filters # 4 & 5 | TP2: average of supply pond effluents |
| S 3 | In (B), Inlet for sand filters # 3 & 6 | |
| S 4 | In (C), Inlet for sand filters # 1 &2 | |
| S 5 | Out (D), Outlet for sand filters # 5 & 6 | TP3: average of SSFs effluents |
| S 6 | Out (F), Outlet for sand filters # 3 & 4 | |
| S 7 | Out (G), Outlet for sand filters # 1 & 2 | |
| S 8 | Outlet of collection and storage pond | TP4: final effluent after collection pond |
Table 1: Identification of sample location.
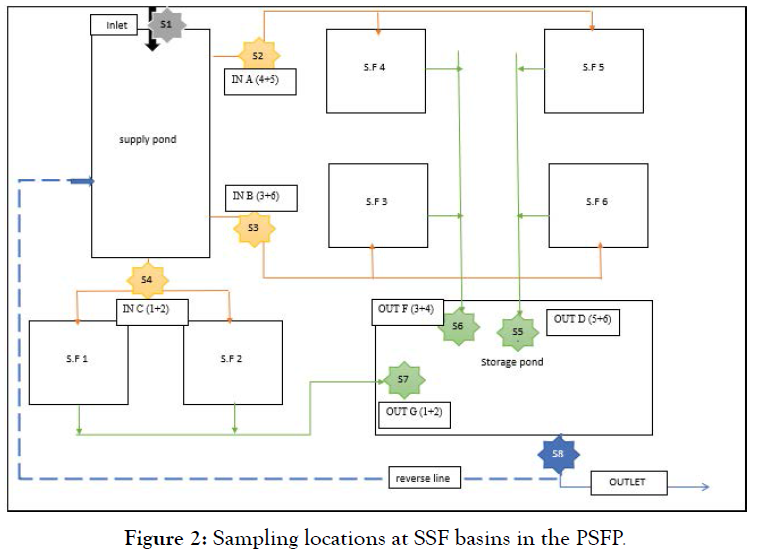
Figure 2: Sampling locations at SSF basins in the PSFP.
Results and dissection
The finding results present different performance parameters of the SSF basins, showing the removal efficiency of the system, which have been explored in the following sections.
Dissolved Oxygen (DO)
Dissolved oxygen (DO) analysis measures the amount of gaseous oxygen (O2) dissolved in an aqueous solution. Dissolved oxygen is one of the most important parameters in assessing water quality and affecting aerobic natural process and considered as the key process for biological carbon and nitrogen removal in biological wastewater treatment. Therefore, knowing the oxygen concentration is essential to interpreting both biological and chemical processes within water bodies, which is highly dependent on temperature, and atmospheric pressure. The results shown in Table 2 represent the variation of mean values of Dissolved Oxygen at different sampling locations during whole period of monitoring.
| Location | S 1 | S 2 | S 3 | S 4 | S 5 | S 6 | S 7 | S 8 |
|---|---|---|---|---|---|---|---|---|
| Max | 0.61 | 2.62 | 2.77 | 2.03 | 4.88 | 5.04 | 4.49 | 6.80 |
| Min | 0.09 | 0.16 | 0.19 | 0.70 | 1.02 | 1.51 | 1.82 | 6.01 |
| Mean | 0.42 | 1.29 | 1.05 | 1.28 | 3.38 | 3.04 | 2.92 | 6.41 |
| SD | 0.2 | 1.1 | 1.0 | 0.5 | 1.5 | 1.3 | 1.0 | 0.3 |
Table 2: Dissolved Oxygen amounts at different sampling locations during the monitoring period.
Figure 3 presents the average accumulated DO concentration in the different stages of the PSFP. A considerable increase level of DO has been achieved through the system and has reached in average of 6 mg/l in the system effluent (location 8). Both, supply pond and SSF basins contributed positively in increasing the DO.
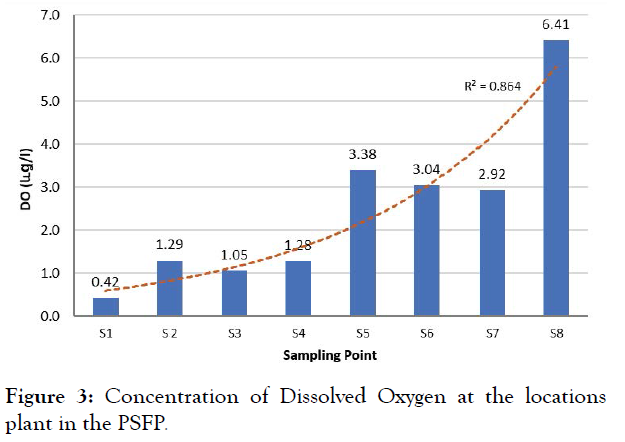
Figure 3: Concentration of Dissolved Oxygen at the locations plant in the PSFP.
Dissolved oxygen levels are maintained by surface aeration, which is assisted by wind and rain and algal photosynthetic activity. Oxygenation from photosynthesis is directly proportional to algal activity levels, which are controlled by the presence of light, temperature, availability of nutrients and other growth factors. The DO availability regulates processes, such as, microbial oxidation of carbonaceous and nitrogenous compounds. DO level is an important indicter for improving the biochemical oxidation processes of organic and inorganic (reduce form of nitrogen) in wastewater treatment process [9]. There is a large oxygen requirement for the removal of Nitrogen Oxygen Demand (NOD) as 4.2gm oxygen for1gm of ammonium nitrogen requires [10].
Nitrogen Dynamic and Removal
The results of mean Nitrate (NO3 -), Ammonium, Total Kjeldahl Nitrogen (TKN) and Total Nitrogen (TN) values within different locations during the sampling periods were shown in the following Tables 3-6, respectively.
| Location | S 1 | S 2 | S 3 | S 4 | S 5 | S 6 | S 7 | S 8 |
|---|---|---|---|---|---|---|---|---|
| Max | 1.25 | 2.47 | 1.29 | 1.16 | 29.0 | 67.3 | 39.0 | 74.3 |
| Min | 0.30 | 0.25 | 0.26 | 0.27 | 0.49 | 7.1 | 0.32 | 59.3 |
| Mean | 0.69 | 0.88 | 0.66 | 0.64 | 20.6 | 39.5 | 28.3 | 67.7 |
| SD | 0.33 | 0.74 | 0.35 | 0.33 | 13.4 | 21.6 | 18.7 | 6.3 |
Table 3: Statistical analysis of Nitrate (mg/L) in all sampling locations during monitoring period.
| Location | S 1 | S 2 | S 3 | S 4 | S 5 | S 6 | S 7 | S 8 |
|---|---|---|---|---|---|---|---|---|
| Max | 141 | 133 | 131 | 133 | 123 | 111 | 128 | 84 |
| Min | 123 | 104 | 101 | 100 | 48 | 50 | 65 | 57 |
| Mean | 133 | 119 | 119 | 117 | 84 | 80 | 99 | 71 |
| SD | 6 | 12 | 12 | 15 | 24 | 20 | 22 | 19 |
Table 4: Statistical analysis of Ammonium (mg/L) in all sampling locations during monitoring period.
| Location | S 1 | S 2 | S 3 | S 4 | S 5 | S 6 | S 7 | S 8 | |
|---|---|---|---|---|---|---|---|---|---|
| Max | 216 | 191 | 194 | 180 | 170 | 158 | 170 | 90 | |
| Min | 133 | 107 | 110 | 100 | 86 | 57 | 91 | 77 | |
| Mean | 163 | 138 | 135 | 133 | 110 | 104 | 119 | 84 | |
| SD | 31 | 27 | 28 | 27 | 31 | 31 | 29 | 9 | |
Table 5: Statistical analysis of Total Kjeldahl Nitrogen (mg/L) in all sampling locations during monitoring period.
| Location | S 1 | S 2 | S 3 | S 4 | S 5 | S 6 | S 7 | S 8 |
|---|---|---|---|---|---|---|---|---|
| Max | 216.1 | 191.1 | 194.1 | 180.1 | 170.1 | 164.1 | 170.1 | 96.6 |
| Min | 133.3 | 107.1 | 109.5 | 99.9 | 85.7 | 90.4 | 90.8 | 90.4 |
| Mean | 169.7 | 138.5 | 135.5 | 133.5 | 115.1 | 117.8 | 122.3 | 93.5 |
| SD | 45 | 27 | 28 | 27 | 29 | 23 | 28 | 4 |
Table 6: Statistical analysis of Total Nitrogen (mg/L) in all sampling locations during monitoring period.
Figure 4 presents the concentration level of NO3 and TKN; with their relations to the DO at different locations of treatment processes in the studied system, including (TP1: system inlet, TP2: supply pond effluents, TP3: average of SSFs effluents and TP4: final effluents after collection pond).
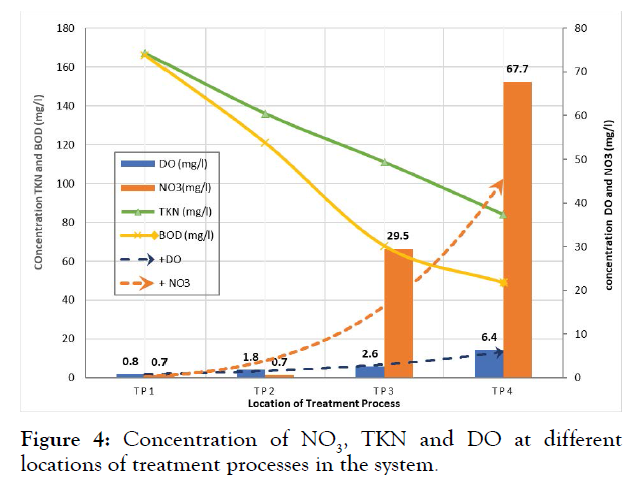
Figure 4: Concentration of NO3, TKN and DO at different locations of treatment processes in the system.
Findings have revealed that in the inlet (supply pond-location-1), DO level was low and the removal of NOD, which reflected in supply bond effluent (point 2) was expected by two processes, settling and anaerobic decomposition of organic matter with no signification level of NO3 as absence of nitrification process. In the SSF, the level of TKN decreased mainly by biological degradation and the DO increase by the percolation and direct contact with air simultaneously. While the NO3 level increased by an ammonia nitrification for SSF effluent at (point 3). These effects continued in collection pond (point4) for the same reason.
Nutrient enrichment (eutrophication) and algal blooms, as well as de-aeration of the watercourse caused by nitrifying bacteria that convert ammonia to nitrate are the main issues that sewage effluent discharges are likely to cause. When nitrification occurs and the water is used as a source for drinking, nitrate toxicity (bluebaby) is a significant health concern problem [11].
The removal efficiency of nitrogen in a treatment system can be determined by studying three major nitrogen components, including NO3, NH4 and TKN. Figure 5 showed the mean values of the three aforementioned parameters in different stages at the studied post treatment system. Organic nitrogen and ionized ammonia were measured by the TKN.
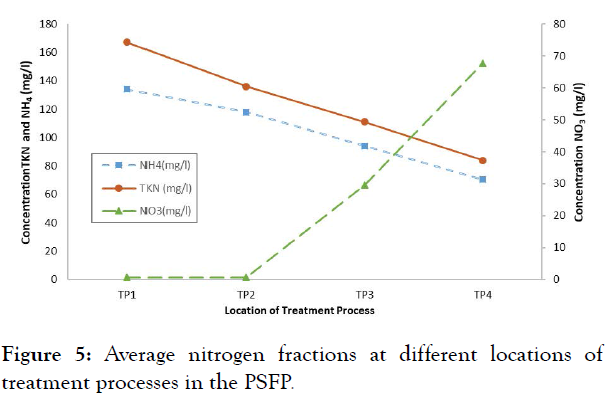
Figure 5: Average nitrogen fractions at different locations of treatment processes in the PSFP.
The findings revealed that ammonia was the mean percentage fraction of influent TKN, which was more than 77 % of the TKN, this refers to the quick mineralization of organic nitrogen, which is transformed to ionized ammonia inside sewerage networks where a highly anaerobic environment would occur. Volatilization, assimilation into algal biomass, and biological nitrification combined to denitrification are the three methods for ammonia elimination in wastewater ponds [12]. The results showed that a considerable quantity of reduced N-form (NH4 and TKN) is transferred to Oxidized N-form (NO3).
The dissolved oxygen plays a significant role for nitrogen removal in the biological treatment of wastewater, which is one of the most critical elements controlling the nitrification process. The nitrifying bacteria known as "nitrifiers" are considered as obligate aerobes; they need free dissolved oxygen for nitrogen oxidation pathways and respiration [13]. Nitrification occurs only under aerobic conditions at considerable dissolved oxygen levels. Abundance of dissolved oxygen is one of the main factors positively affect the initial oxidation of NH4 to NO3 as present in Figure 6.
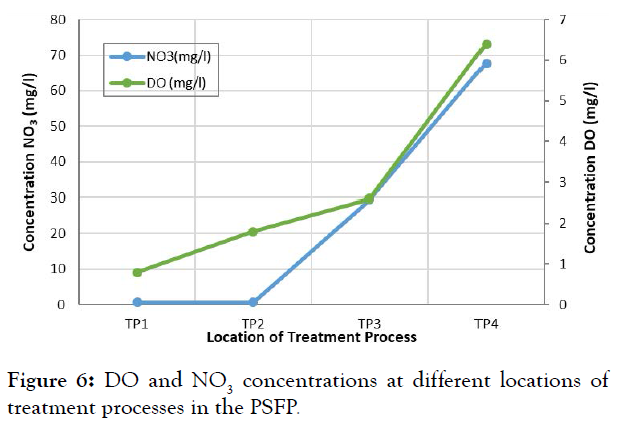
Figure 6: DO and NO3 concentrations at different locations of treatment processes in the PSFP.
The results showed that a good nitrification process was achieved in both slow sand filters and collection pond. However, the SSF showed higher removal of HN4 than TKN, which can be due to the abundance of DO at high levels of in the SSFs for achieving the NH4 nitrification as presented in Figure 7. A high nitrification process in the sand filter can be attributed to the large area of sand particles, which makes the surface of a greater adhesion available for nitrogenous microorganisms, especially in the first layers of the sand filter [14]. While a study by [15] has demonstrated that the SSF can also achieve simultaneous nitrification-denitrification, producing effluent with low concentrations of TKN and total nitrogen (TN) of 0.6 and 1.5mg/l, respectively.
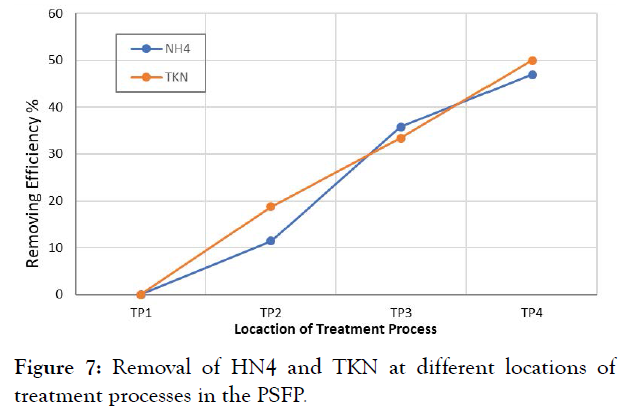
Figure 7: Removal of HN4 and TKN at different locations of treatment processes in the PSFP.
Orthophosphates Removal
The change of mean Orthophosphates (PO4-3) values within different locations during the sampling periods is presented in Table 7.
| Location | S 1 | S 2 | S 3 | S 4 | S 5 | S 6 | S 7 | S 8 |
|---|---|---|---|---|---|---|---|---|
| Max | 65.2 | 78.0 | 56.0 | 60.3 | 89.7 | 30.0 | 45.1 | 20.5 |
| Min | 25.1 | 21.4 | 24.2 | 21.1 | 4.3 | 8.0 | 17.7 | 11.3 |
| Mean | 38.6 | 37.3 | 36.3 | 39.1 | 25.5 | 20.0 | 27.1 | 15.9 |
| SD | 15 | 20 | 13 | 16 | 32 | 9 | 10 | 4 |
Table 7: Statistical analysis of Orthophosphates (mg/L) a all sampling locations during monitoring period.
Phosphorus load reduction has been approved to be one of the most efficient approaches to combat eutrophication. Therefore, several countries have a phosphorus standard for sewage effluent discharges [16]. The ortho-phosphorus concentration at different locations of treatment processes in the PSPS is shown in Figure 8.
As shown in Figure 8, the uptake and removal of phosphorus through the post treatment system of Rafah WWTP were considerable. The ortho-P decreases significantly after passing through the sand filter from around 35 mg/l to an average of 25 mg/l. The average overall reduction in the ortho-phosphorous in the whole PSTP was around 55% as presented in Figure 9.
This reduction had taken place mainly in SSF and collection pond. The consistency of effluent ortho-P concentration in treatment units inside WWTPs is an indicative of a high-complicated chemical and biological process, which would be related to saturation level of sorption sites in the soil and sediment (sludge) of the system. As generally anticipated in typical pond systems, the reduction of Ortho-P occurred by around 10% in the collection pond. Removal of dissolved phosphorus can be achieved by different processes by reoving phosphate compounds through adsorption, ion exchange, filling and absorption [17].
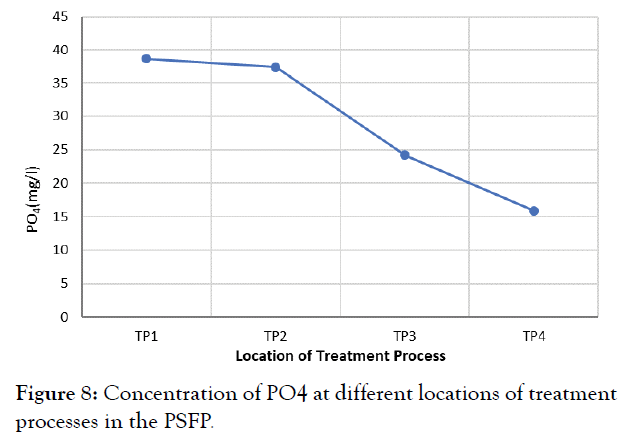
Figure 8: Concentration of PO4 at different locations of treatment processes in the PSFP.
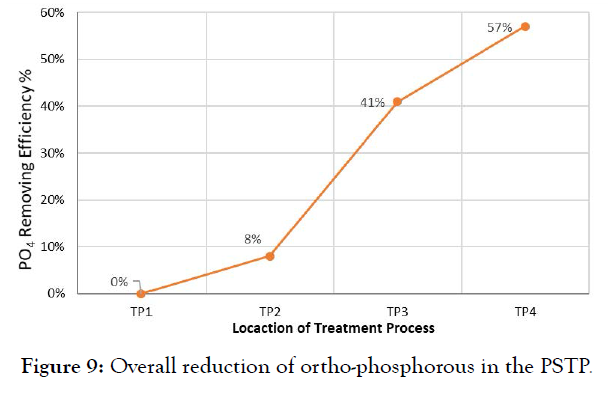
Figure 9: Overall reduction of ortho-phosphorous in the PSTP.
Conclusion
This research is considered as one of the recent studies that analyzes and evaluates the nutrient removal and dynamic of using SSF as a post wastewater treatment process after secondary treatment. The main research results can be summarized in the following points:
• Resendable removal efficiencies for TKN and orthophosphate would be achieved by using the SSF process.
• The abundance of DO is an important element affecting aerobic natural process and biological nitrogen removal in the SSF through enhance the nitrification process of NH4 to NO3.
• A good reduction of reduced Nitrogen fractions would reach up to 50% in the SSF. The ammonia was the mean percentage fraction of the influent TKN with more than 77% and a considerable quantity of reduced N-form (NH4 and TKN) is transferred to Oxidized N-form (NO3).
The overall average reduction of ortho-phosphorous in the whole PSTP was around 55% and had taken place mainly in SSF and collection pond.
The recommendations that would be drawn from this study for related institutions and future research to improve the performance of wastewater treatment processes and systems, particularly that adopting SSF as a post wastewater treatment process include:
• A continuous monitoring and performance evaluation should be implemented regularly to give a better understanding of wastewater treatment system
• Further studies are need for developing robust monitoring and performance evaluation tools for improving the slow sand filter efficiency and conducting other performance parameters, especially heavy metals, detergents and other biological contaminants.
REFERENCES
- Ait-Mouheb N, Bahri A, Thayer BB, Benyahia B, Bourrie G, Cherki B, et al. The reuse of reclaimed water for irrigation around the Mediterranean Rim: a step towards a more virtuous cycle?. Regional Environmental Change. 2018;18(3):693-705.
- FAO. Water for sustainable food and agriculture a report produced for the G20 presidency of germany. 2017.
- Afifi MS. Evaluation of Environmental Performance of Rafah City Wastewater Treatment Plant and Effluent Reuse Potential.
- Tyagi VK, Khan AA, Kazmi AA, Mehrotra I, Chopra AK. Slow sand filtration of UASB reactor effluent: A promising post treatment technique. Desalination. 2009;249(2):571-6.
- Bendida A, Tidjani AE, Badri A, Kendouci MA, Nabou M. Treatment of domestic wastewater from the town of Bechar by a sand filter (sand of Beni Abbes Bechar Algeria). Energy Procedia. 2013 ;36:825-33.
- Maharjan N, Kuroda K, Dehama K, Hatamoto M, Yamaguchi T. Development of slow sponge sand filter (SpSF) as a post-treatment of UASB-DHS reactor effluent treating municipal wastewater. Water Science and Technology. 2016;74(1):65-72.
- Verma S, Daverey A, Sharma A. Slow sand filtration for water and wastewater treatment–a review. Environmental Technology Reviews. 2017;6(1):47-58.
- El-Dahdouh O. Performance Evaluation of Sand Filter in Improvement of Effluent Wastewater from Gaza Wastewater Treatment Plant. 2014.
- Hassanin MA. Evaluation of Nitrogen Removal Dynamic in Gaza Wastewater Treatment Plant (Gwwtp). 2014.
- Horan Nigel J. Biological wastewater treatment systems: theory and operation: Chichester. New York, Wiley. 1990.
- Smith VH, Tilman GD, Nekola JC. Eutrophication: impacts of excess nutrient inputs on freshwater, marine, and terrestrial ecosystems. Environmental pollution. 1999;100(1-3):179-96.
- Pano A, Middlebrooks EJ. Ammonia nitrogen removal in facultative wastewater stabilization ponds. Journal (Water Pollution Control Federation). 1982:344-51.
- Ward BB. Nitrification in marine systems. Nitrogen in the marine environment. 2008;2:199-261.
- Tonon D, Tonetti AL, Coraucci Filho B, Bueno DA. Wastewater treatment by anaerobic filter and sand filter: Hydraulic loading rates for removing organic matter, phosphorus, pathogens and nitrogen in tropical countries. Ecological Engineering. 2015;82:583-589.
- Nakhla G, Farooq S. Simultaneous nitrification–denitrification in slow sand filters. Journal of hazardous materials. 2003;96(2-3):291-303.
- Aloe AK, Bouraoui F, Grizzetti B, Bidoglio G, Pistocchi A. Managing nitrogen and phosphorus loads to water bodies: Characterisation and solutions. Towards macro-regional integrated nutrient management. Joint Research Centre, JRC-Ispra. 2014.
- Achak M, Mandi L, Ouazzani N. Removal of organic pollutants and nutrients from olive mill wastewater by a sand filter. Journal of environmental management. 2009;90(8):2771-9
Citation: Afifi SA, Elfari AA, Alnahhal S (2021) Evaluation of Nutrient Removal Dynamic in Post Treatment Slow Sand Filter Unit. Int J Waste Resour 11: 431. doi: 10.35248/2252-5211.21.11.431
Copyright: © 2021 Afifi SA, et al. This is an open access article distributed under the terms of the Creative Commons Attribution License, which permits unrestricted use, distribution, and reproduction in any medium, provided the original work is properly cited.
