Indexed In
- Genamics JournalSeek
- Academic Keys
- JournalTOCs
- China National Knowledge Infrastructure (CNKI)
- Access to Global Online Research in Agriculture (AGORA)
- Centre for Agriculture and Biosciences International (CABI)
- RefSeek
- Directory of Research Journal Indexing (DRJI)
- Hamdard University
- EBSCO A-Z
- OCLC- WorldCat
- Scholarsteer
- SWB online catalog
- Publons
- Euro Pub
- Google Scholar
Useful Links
Share This Page
Journal Flyer
Open Access Journals
- Agri and Aquaculture
- Biochemistry
- Bioinformatics & Systems Biology
- Business & Management
- Chemistry
- Clinical Sciences
- Engineering
- Food & Nutrition
- General Science
- Genetics & Molecular Biology
- Immunology & Microbiology
- Medical Sciences
- Neuroscience & Psychology
- Nursing & Health Care
- Pharmaceutical Sciences
Research Article - (2024) Volume 15, Issue 4
Evaluation of Chemical and Microbiological Characteristics of Kombucha Tea Produced during an Extended Fermentation
Dillon Lorraine1* and Hamid B. Ghoddusi22Department of Microbiology, Metropolitan University, London, England
Received: 25-May-2020, Manuscript No. JFPT-24-4369; Editor assigned: 28-May-2020, Pre QC No. JFPT-24-4369 (PQ); Reviewed: 11-Jun-2020, QC No. JFPT-24-4369; Revised: 01-Jul-2024, Manuscript No. JFPT-24-4369 (R); Published: 29-Jul-2024, DOI: 10.35248/2157-7110.24.15.1114
Abstract
Kombucha tea is a non-alcoholic beverage, acquiring significant interest due to claimed medicinal properties. In this study, the chemical and microbial properties of kombucha cultivated on Green (GT) Black (BT) and a combination of 1:1 Green and Black Tea (GBT) at different time points up to 26 days of fermentation were evaluated. Emphasis was placed on determining health promoting organic acid contents, namely Glucuronic Acid (GlcUA), Acetic Acid (AA) and Lactic Acid (LA) and purine alkaloid caffeine in three Kombucha formulations by High- Performance Liquid Chromatography (HPLC). Furthermore, Kombucha samples were enumerated on MRS agar for Lactic Acid Bacteria (LAB). The effect of an extended fermentation was monitored for changes to sucrose content and pH values.
Organic acids were determined using the liquid chromatograph coupled to a photo-diode detector, using reversed phase (C18 column) and isocratic elution with 3% phosphoric acid 97% and methanol 3% as mobile phase. Determination of caffeine was also carried out by HPLC equipped with a UV detector under isocratic conditions with 0.5% Trifluoracetic (TFA) 83% and methanol 17% (83:17). The method validation parameters showed efficiency, coefficient of variation between 0.47% and 3.07% (n=3) for repeatability. The average concentrations of caffeine, GlcUA, AA and LA were found in the ranges of 0.24-0.30 mg/ml, 1.74-2.35 mg/ml, 6.01-8.99 mg/ml, 0.47-0.55 mg/ ml, respectively. GT as a substrate produced significantly higher amounts of GlcUA in Kombucha compared to BT and GBT (P ≤ 0.05). GT produced higher amounts of caffeine compared to BT and GBT. Maximum LAB numbers were achieved on day 13 in all samples, with GBT being the highest.
Keywords
Kombucha; Glucuronic acid; Acetic acid; Lactic acid; Caffeine; Lactic acid bacteria
Introduction
Traditionally, Kombucha fermentation substrates are black and green teas, sucrose and a consortium of bacteria and yeasts as an inoculum, referred to as the (SCOBY) “Symbiotic Colony of Bacteria and Yeast. Kombucha is composed of two portions: The first one a floating cellulose biofilm layer (pellicle) and the second is the underlying sour liquid broth tea provides the microbial culture necessary nitrogen from purine derivatives: Caffeine, theaflavin and thearubigins and the sugar provides the carbon source [1].
Production involves aerobic fermentation for around 8 to 15 days, creating bi-products including acetic and lactic acid bacteria (AAB+LAB), ethanol, yeast, various organic acids (glucuronic, citric, L-lactic, acetic and malic), phenolic acids, vitamins (B1, B2, B6, B12, C and E) enzymes, polyphenols and methylxanthine alkaloids (caffeine, theophylline and theobromine).
The possibility of obtaining a healthy Kombucha beverage containing higher amounts of healthy organic acids, enhanced beneficial bacteria and low sugar levels is determined by substrates on which Kombucha is fermented [2].
Therefore, the aim of this study was to investigate three variations of Kombucha prepared using different ratios of tea; 50:50 green and black (GBT), 70:30 green and black (GT) and 70:30 black and green (BT) during an extended period of fermentation.
Materials and Methods
Kombucha production and sampling procedures
Kombucha beverages fermented under aerobic conditions (21.5°C-22°C) were prepared using different ratios of green and black tea branded (clipper organic). Tea was prepared using teabags (2 g/bag) into 3 L of boiled water infused for 10 minutes in sterile glass vessels. Three mixtures produced were GBT (6 g green/6 g black), BT (8 g black/4 g green) and GT (8 g green/4 g black). After bag removal each batch was sweetened with white sugar (50 g/l) and cooled to 22°C before inoculation of Kombucha starter liquid 10% (v/v) plus the SCOBY (pellicle), obtained from a previously fermented batch under similar conditions. The vessels were covered tight with muslin cloth and allowed to ferment statically for 26 days. A control sample prepared using identical ingredients for GBT with the exception of starter liquid and SCOBY and labelled (N) unfermented tea. Samples were collected on day 13 and 26 by transferring the medium into PET bottles. To ensure homogeneity the Kombucha broth was stirred gently. Samples were maintained at 4°C until the experiment proceeded (Figure 1) [3].
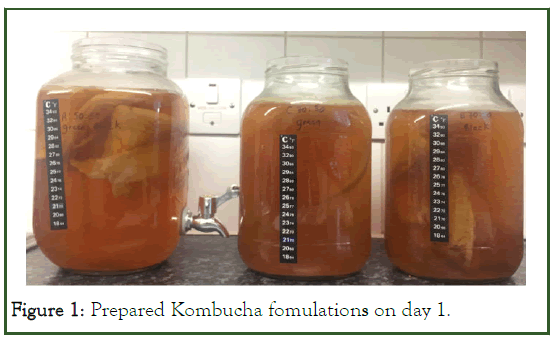
Figure 1: Prepared Kombucha fomulations on day 1.
Sample preparation for HPLC analysis
The best separation of the organic acids and sugars was achieved by a 1:5 dilution providing peaks which were not overlapping on the chromatograph. kombucha samples were degassed using a sonicator (ultrasonic bath). A 10 ml volumetric flask filled with 4 ml of HPLC grade deionised water and 1 ml of supernatant. Next, the series of dilutions were obtained which were then filtrated through a millipore filter (0.45 μm) into HPLC vials and labelled appropriately [4].
Determination of pH
The pH was measured using an electronic pH meter (VWR 3505).
Determination of sugar content
Total sugar was measured by the refractive index and BRIX percentage using the table top Abbe refractometer.
Enumeration of lactic acid bacteria
In preparation for isolation and enumeration of LAB the method described by was used with brief modifications. Kombucha samples were diluted (1:10) with ringer's solution. 1 ml Kombucha was pipetted into 9 ml Ringer's solution. A successive series of dilutions were prepared up to 10-7. Then 25 μl was pipetted from 10-1 to 10-7 and spread in duplicate on each quarter of MRS agar plates. The plates were incubated at 37°C for 5 days. The average CFU/ml of the samples was reported (Figure 2) [5].
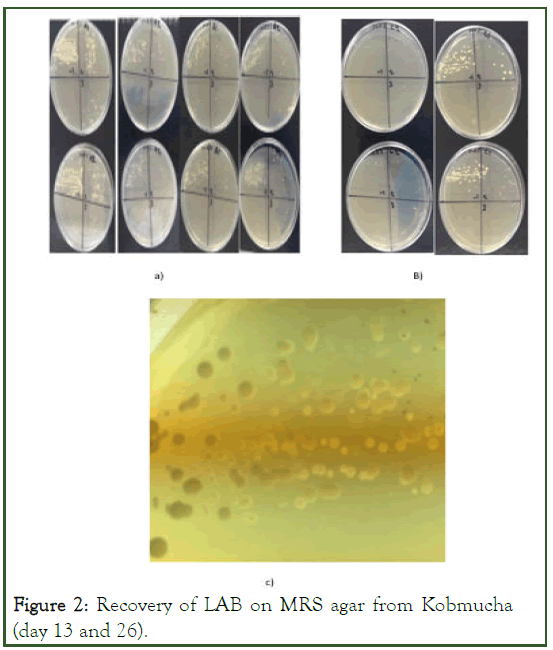
Figure 2: Recovery of LAB on MRS agar from Kobmucha (day 13 and 26).
Determination of organic acids content
The content of organic acids (glucuronic acid, acetic acid and lactic acid) in the Kombucha samples was determined according to with some modifications. A 10 ml sample of fermented Kombucha was centrifuged at 14,000 g for 10 min at 8°C. Next, a volumetric flask of 10 ml was filled with 1 ml-2 ml of supernatant and filled with redistilled water.
Prior to chromatic determination, the obtained extracts were filtered with nylon syringe filters of 0.45 μm. Assays were performed with the HPLC system equipped with UV-PDA Diode Array detector (PDA) for a reverse phase separation performed using Halo C-18 column (4.6 mm × 150 mm × 2.7 μm) at 25°C. A solution of 0.3% phosphoric acid 97% and methanol 3% (97:3) was used as eluent, using a flow of 1 ml min 1 and run time was 25 minutes. A wavelength of 210 nm identified all organic acids. The sample dosage volume was 20 μL (Table 1) [6]. Quantitative analysis of organic acids was performed using the calibration curve method. The average of three parallel assays was reported.
| Organic acids | Caffeine | |
|---|---|---|
| Column-stationary phase | Halo C-18 column (4.6 mm × 150 mm × 2.7 μm) | Poroshell 120 C-18 column (50 mm × 4.6 mm × 2.7 μm) |
| Mobile phase | Isocratic: 0.3% phosphoric acid 97%, methanol 3% (97:30) | Isocratic; trifluoracetic acid 87%, methanol 17% (87:17) |
| Flow rate | 1 ml/min | 1 ml/min |
| Run time | 25 min | 10 min |
| Oven temp | 25°C | 21.17°C |
| Detector type | Photo diode detector-PDA | Ultraviolet-UV |
| Injection volume | 20 µl | 20 µ |
| Wavelength | 220 nm | 240 nm |
Table 1: HPLC method parameters used for combined organic acid and caffeine analysis.
Determination caffeine content
Twenty μL of Kombucha and the standards were injected in the HPLC system (agilent 1260 infinity II LC) equipped with UV detector for reverse phase separation, using Poroshell C-18 column (50 mm × 4.6 mm × 2.7 μm) at 21.17°C. Flow rate was 1 ml/min and run time was 10 minutes. Detection was monitored at wavelength 240 nm. Determinations were made under isocratic conditions and mobile phase was 0.5% Trifluoracetic (TFA) 83% and methanol 17% (83:17). Quantitative analysis of organic acids was performed using the calibration curve method [7].
Statistical analysis
All statistical analysis was performed using excel and SPSS software. Significant differences were determined using independent T-tests. ANOVA analysis determined differences between samples and finally Tukey multiple comparison tests due to small sample size. A p value of <0.05 was considered statistically significant [8].
Results and Discussion
Chemical analysis
The pH of unfermented tea decreased from 6.44 to 5.08 within minutes of inoculation with starter liquid (pH 2.65). The highest value on 13th day of fermentation was 3.08, 2.96 and 2.97 in GBT, BT and GT .
The lowest value was observed in GT 2.68 on 26th day. Decreases between days 13th to 26th were 2.27, 2.41 and 2.43 units in GBT, BT and GT respectively. The control tea remained unchanged at pH 6.44 throughout [9].
pH reduction is attributed to bacteria and yeast metabolising sucrose and oxidising ethanol, producing a mixture of organic acids. Yeast produce ethanol from sucrose metabolism and AAB oxidise ethanol to produce AA which further stimulates ethanol production. Low pH affects sensory qualities, thus monitoring is an important marker in Kombucha fermentation for quality and safety.
Values were consistent with studies by demonstrating increases of organic acids coincided with pH decrease by 2 units from pH 5 to 3 within 12 days of fermentation. Also in agreement with research by reporting a drop (2.42-2.76) after 30 days fermentation. Chakravorty et al., reported pH 5.03 dropping to 2.28 after 7 days [10].
Sugar content
Total sugar content of all formulations was observed at 4.7 g/100 ml (4.7°Brix) on day 1. During the fermentation uniform sucrose degradation was observed in all formulations and measured at 2 g/100 ml (2°Brix) by day 26. No changes were recorded in the control tea.
Studies report that as sucrose concentration decreases the content of reducing sugars fructose and glucose is simultaneously increased. Additionally observations indicates as sucrose decreases, ethanol content increases.
During fermentation yeast cells hydrolyse sucrose by the enzyme invertase producing glucose and fructose and produce ethanol via glycolysis. Acetobater bacteria activities enable the synthesis of the cellulose pellicle and also converts glucose into GlcUA and fructose to produce AA. Sucrose concentration is temperature dependent and higher temperature ferments cause larger sucrose degradation, as well as higher increases in glucose and fructose. Thus, composition of Kombucha with desired qualities as low sugar beverage can be obtained through the adequate control of fermentation time and temperatures [11].
Organic acids content
The quantitative values for the analysed organic acids in kombucha at two time points was variable. The mean concentration of three injections per sample (except caffeine) are illustrated (Figure 3). The chromatographs represent the organic acids and caffeine in Kombucha standards and samples.
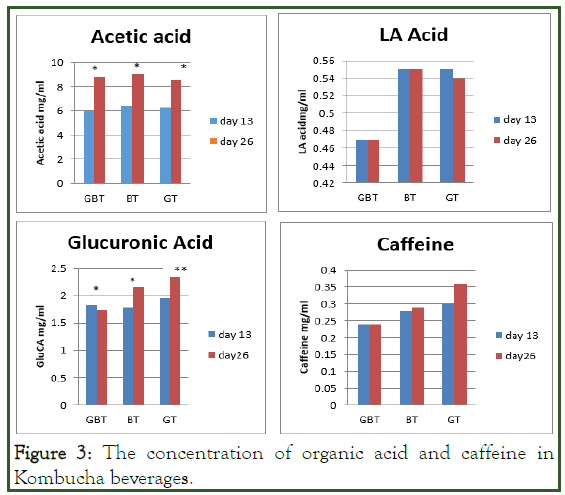
Figure 3: The concentration of organic acid and caffeine in Kombucha beverages.
AA retention time was 10.42 ± 0.32 min and produced concentrations higher than LA and GlcUA, thereby conferring AA as most dominant acid. AA was highest in BT (8.99 mg/ml) on 26th day of fermentation and significantly different on two time points. Concentration increased by 2.26 mg/ml (GT), 2.54 mg/ml (BT) and 2.8 mg/ml (GBT) during 13th day to the 26th day of fermentation. AA was produced in the range of 6.01 mg/ ml-6.45 mg/ml and 8.52 mg/ml-8.99 mg/ml (P<0.05) on the 13th and 26th day respectively. With reference to unfermented tea, no peak eluted around 10.42 min indicative of the absence of this acid [12].
Results correspond to research AA concentrations on day 15 were 6.17 mg/ml and 9.51 mg/ml in BT and GT respectively followed by a slow decrease. The AA content in own study indicates high concentrations of glucose available for ethanol metabolism, a dynamic not dissimilar to demonstrating AA increased to 16.57 mg/ml >21 days, however the presence of LA or GlcUA was not detected. Neffe-Skocinska, et al. fermented at different temperatures (20°C, 25°C and 30°C), AA produced up to 1.52 mg/ml on 10th day, The author explained by insufficient sucrose (100 g/l) for AA synthesis .
LA eluted at 9.37 ± 0.25 min and identified as least dominant acid with maximum concentrations 0.47 mg/ml, 0.55 mg/ml, 0.55 mg/ml in GBT, BT and GT respectively. No differences observed between 13th and 26th day of fermentation apart from a minimal decrease of 0.01 mg/ml in GT. Overall, no differences in concentrations of LA and acetic acids were found by ANOVA according to the tea type. Results are in agreement, GT produced 0.54 mg/ml and BT 0.44 mg/ml on day 3 which decreased thereafter. However, LA is not always produced as observed during the 10 day fermentation with initial sucrose concentration 100 g/l and previous HPLC analysis has not always detected LA in Kombucha samples. GlcUA eluted at 8.45 ± 0.04 min 13th and 2.35 mg/ml on 26th day.
Decreases of 0.09 mg/ml in GBT was observed with increases of 0.37 mg/ml and 0.39 mg/ml in BT and GT (P ≤ 0.05). GT produced significantly higher GlcUA compared to GBT (P ≤ 0.05), however no differences observed between groups GBT+BT and BT+GT. The unfermented tea did not peak at 8.45, indicating no presence of GlcUA as expected.
Significant differences were observed for GlcUA production by GT compared to GBT and BT (P ≤ 0.05). Thus, it can be conferred that green tea as a substrate enhances GlcUA production.
Interestingly, Jayabalan, et al. used similar parameters and reported Kombucha made predominantly on green tea produced (0.063 mg/ml) when prepared with 100 g/l sugar. Contrariwise, black tea produced levels 2.33 mg/ml GlcUA after 12 days compared to 1.86 mg/ml in green tea after 6 days. The effects of tea type had no impact on organic acid production (P ≥ 0.05), however research demonstrated fermentation at 30°C enhanced a diverse bacterial community favouring AAB namely gluconacetobacter optimising an increased production of GlcUA (P ≤ 0.05).
Caffeine content
Caffeine eluted at 7.72 ± 0.09 min and overall concentrations in the GBT formulation remained stable between 13th and 26th day. The highest concentration was produced by GT (0.30 mg/ ml), BT (0.29 mg/ml) and GBT (0.24 mg/ml). Unfermented tea contained the most caffeine (0.36 mg/ml). No statistical data is available for caffeine as analysis was not carried in triplicate.
Interestingly, black tea generally contains higher amounts of methyxanthines than green tea. The unfermented tea contained the highest values of caffeine at 0.36 mg/ml compared to the fermented versions perhaps an indication of compound degradation possibly related to microorganisms utilising the methyxanthines as growth substrates. Indeed, microorganisms which use caffeine as sole source of carbon and nitrogen, are reported to degrade caffeine, this has been researched in the recent years as a potential method for decaffeination, but while this may be true those species have not yet been identified in any Kombucha mediums to date.
Results concur with research caffeine content in black tea Kombucha (0.24 mg/ml) compared to green tea Kombucha (0.08 mg/ml). Biochemical properties changed during the course of fermentation over 14 days in green tea as caffeine decreased (0.17 mg/ml to 0.08 mg/ml) whilst no changes were observed in black tea (0.24 mg/ml). Caffeine concentration was 1 mg/ml on day 1 reducing by 40% to 0.63 mg/ml at day 21 of fermentation using just black tea. Miranda, et al. reported 0.039 mg/ml, however the Kombucha was prepared with significantly.
Less black tea (1.5 g/l) compared to 5 g/l and 12 g/l and 6 g/l in this own study; which would directly impact on the levels of caffeine in the end product.
It seems reasonable to compare the caffeine levels to popular carbonated beverages to get some perspective. Nour, et al. determined caffeine concentrations in common energy drinks such as red bull as 16.82 mg/100 mL to 39.48 mg/100 ml, while carbonated drinks had 9.79 mg/100 ml-14.38 mg/100 ml.
Results of this investigation indicated levels of caffeine far exceed regulated levels in soft drinks according to US Food and Drug Administration (FDA) (0.02%) or 0.21 mg/ml. It can be concluded Kombucha is a high caffeinated beverage comprising similar levels of caffeine to energy drinks such as red bull.
Enumeration of lactic acid bacteria
LAB was most abundant in all formulations on 13th day compared 26th. It is presumed LAB reduction is associated with pH reduction. LAB counts in all formulations were different and maximum growth reach was 10-7 cfu in all samples on 13th day of fermentation, decreasing on 26th day to 3 log CFU/ml (Table 2). GBT and BT as substrates effectively stimulated LAB production compared to GT.
| Sample | Day 13 | Day 26 |
|---|---|---|
| GBT | 2.7 × 10⁷ | 2.4 × 10⁴ |
| BT | 1.6 × 10⁷ | 6.4 × 10⁴ |
| GT | 1.3 × 10⁷ | 4 × 10³ |
| N | ND | ND |
Table 2: Total lactic acid bacteria (CFU/ml) in Kombucha tea on13th and 26th day.
Results indicate LAB tolerates Kombucha fermentation conditions and numbers are enhanced around the 10th-13th day mark. As fermentation proceeded the increased acidity appeared to affect LAB loads. Conceivably a reduced acid tolerance characteristic is possible which suggests optimal conditions for LAB growth in this case was ≥ pH 2.84.
The recovery of LAB is an important discovery in Kombucha and its presence has not been discussed in depth and reported in a small number of studies. Reports state limitations in culture based methods for bacterial identification and difficulties isolating LAB. Neffe-Skocinska, et al. optimised fermentation conditions in Kombucha under different temperatures and found the fermentation substrates had no impact on LAB growth. The two main differences noted were tea and sucrose content (6 g/L tea, 100 g/L sucrose), prepared to a 70:30 ratio of black and green tea. The methodology matched closest to this current experiment, however no LAB was identified. Limitations regarding the culturing diluent can impact on the recovery of LAB. Peptone water and incubation time of 48 hr did not allow the cultivation of LAB. In own study, ringers solution and incubation >5 ≤ days supported LAB growth.
Previous studies showed higher temperatures (>30°C) promoted LAB growth however abundance decreased to less than 2% as fermentation progressed (>21 days).
The most notable observation was evidence of three apparently different strains present on the media, indicative by different colonial characteristics (Figure 2). However the isolates identity at this point is beyond the scope of this report.
Conclusion
The probiotics and organic acids in kombucha are active ingredients that possess a range of beneficial effects. This study demonstrated chemical changes in organic acids and caffeine.
Lactic acid bacteria production, pH and sugar were quantified in various mixtures of green and black tea. Up to three strains of presumptions probiotic bacteria were enumerated. As the pH decreased, the LAB loads reduced in numbers whilst production of organic acids increased simultaneously. Thus, it may be feasible for optimizing production processes by discontinuing fermentation around pH 2.8 for LAB abundance and longevity. This implies fine balance is required to produce the desired product with probiotic potential and sensory qualities.
Tea type had no impact on LA and AA production, however the substrate GT produced significantly higher amounts of GlcUA compared to BT and GBT (P ≤ 0.05). Caffeine was in high concentrations in all formulations.
It is evident that the biochemistry and microbiological composition of Kombucha is varying and complex and still more research is required to fully understand fermentation processes and dynamics. It varies with environmental and geographical differences, fermentation vessels, substrate type and concentration, incubation temperature and time.
References
- Greenwalt CJ, Steinkraus KH, Ledford RA. Kombucha, the fermented tea: Microbiology, composition and claimed health effects. J Food Prot. 2000;63(7):976-981.
[Crossref] [Google Scholar] [PubMed]
- Quiao-Won ME, Teves FG. Characteristics of Kombucha fermentation from different substrates and cytotoxicity of tea broth. Sustain Food Prod. 2018;4(1):11-19.
- Murugesan GS, Sathishkumar M, Jayabalan R, Binupriya AR, Swaminathan K, Yun SE. Hepatoprotective and curative properties of Kombucha tea against carbon tetrachloride-induced toxicity. J Microbiol Biotechnol. 2009;19(4):397-402.
[Crossref] [Google Scholar] [PubMed]
- Velicanski AS, Cvetkovic DD, Markov SL, Saponjac VT, Vulic JJ. Antioxidant and antibacterial activity of the beverage obtained by fermentation of sweetened lemon balm (Melissa officinalis L.) tea with symbiotic consortium of bacteria and yeasts. Food Technol Biotechnol. 2014;52(4):420-429.
[Crossref] [Google Scholar] [PubMed]
- Malbasa RV, Loncar ES, Kolarov LA. Influence of black tea concentrate on kombucha fermentation. Acta Period Technol. 2006;37:137-143.
- Jayabalan R, Malini K, Sathishkumar M, Swaminathan K, Yun SE. Biochemical characteristics of tea fungus produced during Kombucha fermentation. Food Sci Biotechnol. 2010;19:843-847.
- de Filippis F, Troise AD, Vitaglione P, Ercolini D. Different temperatures select distinctive acetic acid bacteria species and promotes organic acids production during Kombucha tea fermentation. Food Microbiol. 2018;73:11-16.
[Crossref] [Google Scholar] [PubMed]
- Jayabalan R, Marimuthu S, Swaminathan K. Changes in content of organic acids and tea polyphenols during Kombucha tea fermentation. Food Chem. 2007;102(1):392-398.
- Chakravorty S, Bhattacharya S, Chatzinotas A, Chakraborty W, Bhattacharya D, Gachhui R. Kombucha tea fermentation: Microbial and biochemical dynamics. Int J Food Microbiol. 2016;220:63-72.
[Crossref] [Google Scholar] [PubMed]
- Neffe-Skocinska K, Sionek B, Scibisz I, Kolozyn-Krajewska D. Acid contents and the effect of fermentation condition of Kombucha tea beverages on physicochemical, microbiological and sensory properties. Cyta J Food. 2017;15(4):601-607.
- Vitas JS, Cvetanovic AD, Maskovic PZ, Svarc-Gajic JV, Malbasa RV. Chemical composition and biological activity of novel types of Kombucha beverages with yarrow. J Funct Foods. 2018;44:95-102.
- Martinez Leal J, Valenzuela Suarez L, Jayabalan R, Huerta Oros J, Escalante-Aburto A. A review on health benefits of Kombucha nutritional compounds and metabolites. Cyta J Food. 2018;16(1):390-399.
Citation: Lorraine D, Ghoddusi HB (2024) Evaluation of Chemical and Microbiological Characteristics of Kombucha Tea Produced during an Extended Fermentation. J Food Process Technol. 15:1114.
Copyright: © 2024 Lorraine D, et al. This is an open-access article distributed under the terms of the Creative Commons Attribution License, which permits unrestricted use, distribution, and reproduction in any medium, provided the original author and source are credited.
