Indexed In
- Open J Gate
- Genamics JournalSeek
- CiteFactor
- Cosmos IF
- Scimago
- Ulrich's Periodicals Directory
- Electronic Journals Library
- RefSeek
- Hamdard University
- EBSCO A-Z
- Directory of Abstract Indexing for Journals
- OCLC- WorldCat
- Proquest Summons
- Scholarsteer
- ROAD
- Virtual Library of Biology (vifabio)
- Publons
- Geneva Foundation for Medical Education and Research
- Google Scholar
Useful Links
Share This Page
Journal Flyer
Open Access Journals
- Agri and Aquaculture
- Biochemistry
- Bioinformatics & Systems Biology
- Business & Management
- Chemistry
- Clinical Sciences
- Engineering
- Food & Nutrition
- General Science
- Genetics & Molecular Biology
- Immunology & Microbiology
- Medical Sciences
- Neuroscience & Psychology
- Nursing & Health Care
- Pharmaceutical Sciences
Research Article - (2016) Volume 8, Issue 7
Estrogen-Dependent Downregulation of Hepcidin Synthesis Induces Intracellular Iron Efflux in Cancer Cells In Vitro
Abstract
It is well accepted that intracellular iron overload that associate with various forms of cancer fuels tumor mutagenesis and growth. Hence, iron chelation therapy is being increasingly used to minimize iron overload in cancer patients despite significant safety and efficacy concerns. Mounting evidence suggests that estrogen (E2) downregulates hepcidin synthesis and increases serum iron concentration. It is postulated therefore that, by downregulating hepcidin synthesis, E2 may maintain ferroportin integrity and enhance intracellular iron efflux. Here, MCF-7 and SKOV-3 cancer cells treated with increasing concentrations (5, 10 and 20 nM) of E2 were assessed for intracellular labile iron content, the expression of hepcidin, ferroportin, and transferrin receptors 1 and 2 along with cell viability at different time points post treatment. In MCF-7 cells, E2 treatment resulted in a significant reduction in hepcidin synthesis, most noticeably at the 20 nM/24 h dose, a significant increase in ferroportin expression and a marked decrease in transferrin receptors 1 and 2 expression. E2-treated cells also showed reduced intracellular labile iron content most evidently at 20 nM/48 h dose and reduced viability especially at 20 nM/72 h dose. E2-treated SKOV-3 showed slightly reduced intracellular labile iron content, reduced expression of hepcidin and significantly increased expression of TFR1 but not TFR2; FPN expression was overall similar to that of controls. The effects of E2 on intracellular iron metabolism in SKOV-3 were most evident at 5 nM/24 h dose. These findings suggest that E2 treatment induces intracellular iron efflux, which may minimize intracellular iron overload in cancer cells; disrupted expression of transferrin receptor 1 and/or 2 may help sustain a low intracellular iron environment.
Keywords: 17-β-estradiol, Hepcidin, Intracellular labile iron, Ferroportin, Transferrin receptor, MCF-7, SKOV-3
Introduction
Iron is essential for cell metabolism and growth; under aerobic conditions however, excess iron induces the generation and propagation of free radicals though Fenton chemistry. Mammalian systems have therefore evolved intricate mechanisms to tightly regulate iron absorption and release. Ferroportin (FPN) on iron-absorbing enterocytes and iron-releasing macrophages and hepatocytes effluxes iron into the circulation where it combines with transferrin for delivery to target cells though transferrin receptor 1 (TFR1; CD71). Iron efflux though FPN is negatively regulated by the hepatocyte-derived peptide hormone hepcidin, which degrades FPN [1]. Increased demand for iron downregulates hepcidin synthesis by upregulating the transcription of hypoxia inducible factor 1α (HIF-1α) [2] and the growth differentiation factor 15 (GDF15) [3] among other mechanism [4]. On the other hand, ferric-transferrin complex (holo-transferrin) in excess displaces the human hemochomatosis gene product (HFE) from TFR1 allowing it to bind to TFR2 to upregulate hepcidin synthesis [1,5]. Interleukin-1 (IL-1) and IL-6 [6,7] as well as toll-like receptor 4 (TLR-4) [8] have also been shown to upregulate hepcidin gene expression.
Besides variations in demand and inflammation, there is evidence to suggest that iron homeostasis is influenced by the sex hormone E2 (17-β estradiol or E2). In that, while ovariectomy in mammals results in decreased serum iron [9], use of oral contraceptives [10] and treatment of ovariectomized mice with E2 [11,12] results in increased serum iron levels [13]. The expression of several genes involved in iron metabolism including lactotransferrin, ceruloplasmin ferroxidase, lipocalin 2 and ferroportin [12] upregulate during uterine growth and differentiation. Furthermore, HIF-1α was reported to upregulate in ovarian cancer cell lines ES-2 and SKOV3 following treatment with E2 [14]. E2 has also been shown to downregulate hepcidin gene expression by binding to E2 response elements (EREs) in the hepcidin gene [13,15]; an effect that could be reversed by ICI 182780 (an E2 antagonist) [15]. E2 was also reported to inhibit the synthesis of IL-1 and IL-6 [16]; both of which are known to upregulate hepcidin gene expression as noted previously [6,7]. Collectively, these observations suggest that exposure to E2 may maintain FPN integrity and hence enhance intracellular iron efflux.
Several forms of cancer including lung [17,18], pancreatic [19] colon [20-23], and breast cancer [20,24-27] have been reported to exhibit significant levels of iron overload. Breast cancer cells have been shown to exhibit increased levels of hepcidin, ferritin, and labile iron along with decreased FPN expression [24]. Furthermore, upregulated expression of CD71 is considered as a marker of poor prognosis in breast cancer patients [28]. Based on these and other relevant observations, iron chelation therapy has been proposed and tested in various forms of cancer [29-33] with mixed results regarding efficacy [34,35] and side effects [36]. One possible reason for the limited efficacy of iron chelation in cancer is that it mostly targets extracellular iron. Therefore, disturbed iron homeostasis being mostly intracellular rather than systemic in many forms of cancer [24] calls into question the logic of conventional iron chelation as a treatment for cancer and necessitates the development of new approaches to drive intracellular iron out rather than chelating extracellular iron and exacerbating compromised immunity and anemia in such patients. In this context, previous work has shown that E2 treatment could precipitate anticarcinogenic effects though its ability to induce apoptosis [37]. In this study, we addressed the possibility that E2 treatment could enhance intracellular iron efflux using the human breast (MCF-7) and ovarian (SKOV-3) cancer cell lines. Treated cells were assessed for intracellular labile iron content and the expression of several proteins involved in intracellular iron management along with cell viability. Should E2 treatment proves capable of manipulating intracellular labile iron content, it could shed more light on the anti-carcinogenic [37-39] and anti-inflammatory [13] potential of E2.
Materials and Methods
Cell culture and treatment
The Human breast (MCF-7) and ovarian (SKOV-3) adenocarcinoma cell lines (ATCC, Manassas, VA, USA) were used throughout the study given that they both express E2 receptor alpha (ER-α). MCF-7 cells were maintained in DMEM supplemented with 2 μg/ml insulin, 1 mM sodium pyruvate, 1 mM nonessential amino acids, 4 mM glutamine, 10% fetal calf serum, and antibiotics (penicillin/streptomycin) at 37°C and 5% CO2. SKOV-3 cells were maintained in McCoy′s 5a medium (Sigma) supplemented with 2 mM Glutamine, 1 mM sodium pyruvate, 15% FBS, 1% antibiotics (penicillin/streptomycin) at 37°C and 5% CO2. For E2 treatment, cells were seeded at 5 × 10⁵ cells/ml in 25 cm flasks; at ~70% confluency, cells were treated with 17-β estradiol (Oestradiol benzoate [Folone]; Misr CO, Egypt) at 5, 10 or 20 nM and cultured for 6, 12 or 24 h prior to harvesting and assessment. Control cell cultures were either left untreated or treated with equal volumes of ethanol as vehicle [40].
RT-PCR
RNA was isolated using TRIzol Tri reagent (Catalog No. 93289; Sigma) according to manufacturer’s instructions. 1 μg of total RNA was reverse transcribed in a 20 μl reaction volume containing random primers and GoScript Reverse transcription mix. Quantitative RT-PCR was carried out using the GoTaq system (Catalog No. A6010; Promega) and the reactions were run on a Rotor-Gene Q5 RT-PCR cycler (Qiagen corporation, Hilden, Germany). Primers used to test for hepcidin gene expression were shown in Table 1.
| Gene | Forward primer | Reverse primer |
|---|---|---|
| Hep. | 5´-CTGTTTTCCCACAACAGACG-3´ | 5´-CAGCACATCCCACACTTTGA-3´ |
| FPN | 5'-CAGTTAACCAACATCTTAGC-3 | 5'-AAGCTCATGGATGTTAGAG-3' |
| TFR1 | 5´-AGGAACCGAGTCTCCAGTGA-3´ | 5´-ATCAACTATGATCACCGAGT-3´ |
| TFR2 | 5´-GGAGTGGCTAGAAGGC-TACCTCA-3´ | 5´-GGTCTTGGCATGAAACTTGTCA-3´ |
| GAPDH | 5´-CCAGGTGGTCTCCTCTGACTTC-3´ | 5´-TCATACCAGGAAATGAGCTTGACA-3´ |
Table 1: Primers used for hepcidin gene expression testing.
Western blotting
Cells were lysed with ice-cold radio-immunoprecipitation assay (RIPA) buffer containing protease cocktail inhibitor tablets (Cat. No. S8830, Sigma). Whole cell lysate protein concentration was quantified using the standard Braford method (Cat. No. 500-0006, BioRad). Lysate aliquots containing 30 μg protein were separated by 12% SDSPAGE gel electrophoresis and transferred onto a Polyvinylidene difluoride (PVDF) membrane (Cat. No. 162- 0177, Biorad). The membrane was blocked with 5% skimmed milk powder for 1 h at room temperature, washed with T-TBST and reacted with primary (IgG) unlabeled antibody (anti-hepcidin: Cat. No. ab57611; anti-FPN: Cat No ab85370; anti-TFR: Cat No. ab84036; anti-TFR2: Cat No, ab84287; and anti-Hif1-α: Cat No, ab82832; all from Abcam) at 1:1000 dilution overnight at 4°C. The secondary (anti-IgG) antibody (Cat. No. 97040, Abcam) was reacted with the membrane at 1:5000 dilution for 1 h at room temperature. Chemiluminescence was detected using the ECL kit (Cat. No. 32106, Thermo Scientific Pierce). Protein band quantification was carried out using the Bio-Rad Image Lab software (ChemiDoc™ Touch Gel and Western Blot Imaging System, Bio-Rad, Hercules, CA) and the online Image J software, National Institutes of Health (NIH), USA (http://rsb.info.nih.gov/ij/index.html). β-actin was used as a normalization control and values of control (untreated) samples were defined as 1.00; values of experimental samples were quantified relative to that of control.
Immunofluorescence
Cells were seeded at 104 cell/ml on sterile poly-L-lysine-coated glass cover slips in 6-well culture plates, 48 h later, cells were starved for 12 h prior to treatment with E2. Cells on slides were then washed with PBS and fixed with 4% paraformaldehyde for 15 min at room temperature and treated with 0.1% Triton X-100 for 10 min. Fixed and permeabilized cells were blocked with BSA at 3% for 1h, rinsed with 1X PBS and incubated with unlabeled primary antibody (antihepcidin: Cat. No. ab57611; anti-FPN: Cat No ab85370; anti-TFR: Cat No. ab84036; anti-TFR2: Cat No, ab84287; and anti-Hif1-α: Cat No, ab82832; all from Abcam) at 5 μg/ml overnight at 4°C. Cells were then washed with 1X PBS and reacted with the Alexafluor®488- or Alexafluor®680-labeled secondary antibody (Abcam) for 1 h at 37°C; excess reagent was rinsed with 1X PBS. Genomic DNA was stained with 4′,6′-diamidino-2-phenylindole (DAPI) (Cat. No. D1306, Invitrogen) according to manufacturer’s instructions. Slides were visualized by fluorescence microscopy using an Olympus BX51 fluorescence microscope (Olympus Corporation, Tokyo, Japan).
Flow cytometric analysis
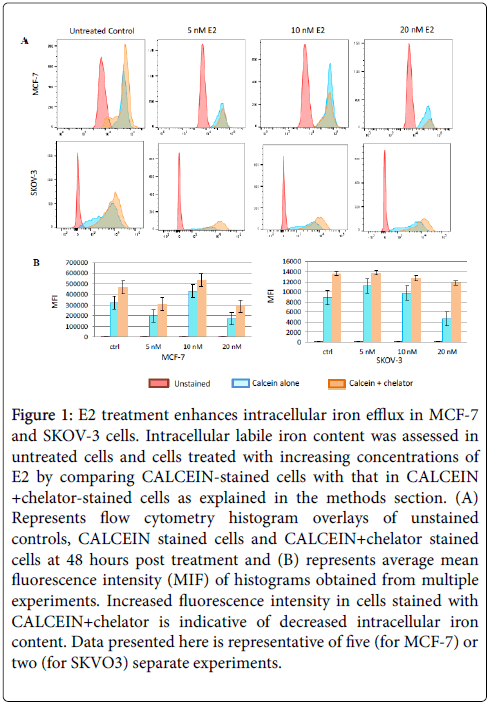
Viable cells were reacted with FITC-labeled anti-human CD71 antibody (Cat. No. 19577, Thermo Scientific) at 1 μg/5 × 105 cells for 30 minutes on ice in 100 μl PBS. Cells were then washed twice with PBS and fixed with 500 μl of 2% paraformaldehyde. Intracellular labile iron content was qualitatively assessed as previously described [41]. Briefly, cells were washed twice with PBS; 0.5 × 10⁶ were incubated for 15 min at 37°C in the presence of 0.5 μM calcein acetoxymethyl ester (CA-AM) (Cat. No. 56496, Sigma Aldrich). Cells were then washed twice and treated with deferiprone or deferoxamine (Ferriprox; Cat No. 374907, Sigma Aldrich) at 100 μM. Cells were analyzed by flow cytometry (AccuriTM C6, Becton-Dickinson) at a rate of 1000/sec applying a 488 nm laser beam for excitation. A minimum of 50,000 events were collected/sample and % positive staining was computed to the 99% confidence level at a logarithmic scale. Mean fluorescence intensity (MIF) as presented in Figure 1 represents the geometric mean fluorescence intensity of a log-normal distribution of fluorescence signals.
Figure 1: E2 treatment enhances intracellular iron efflux in MCF-7 and SKOV-3 cells. Intracellular labile iron content was assessed in untreated cells and cells treated with increasing concentrations of E2 by comparing CALCEIN-stained cells with that in CALCEIN +chelator-stained cells as explained in the methods section. (A) Represents flow cytometry histogram overlays of unstained controls, CALCEIN stained cells and CALCEIN+chelator stained cells at 48 hours post treatment and (B) represents average mean fluorescence intensity (MIF) of histograms obtained from multiple experiments. Increased fluorescence intensity in cells stained with CALCEIN+chelator is indicative of decreased intracellular iron content. Data presented here is representative of five (for MCF-7) or two (for SKVO3) separate experiments.
MTT cell viability assay
MTT (3-(4,5-dimethylthiazol-2-yl)-2,5-diphenyltetrazolium bromide (Sigma-Aldrich) was used as a colorimetric assay to assess cells viability following treatment as described elsewhere. 104 cells were grown in 0.2 mL growth medium in 96-well plates and cultured for 24 h. The MTT salt was then mixed with the control or treated cells and incubated at 37°C for 2 h in a humidified CO2 incubator at 5% CO2. MTT formazan product was dissolved in DMSO and absorbance was read at 570 nm on a microplate reader.
Statistical analysis
RT-PCR data was analyzed using the Statistical Software Graph Prism Pad 5 and paired t test was used to generate P values for comparisons between groups.
Results
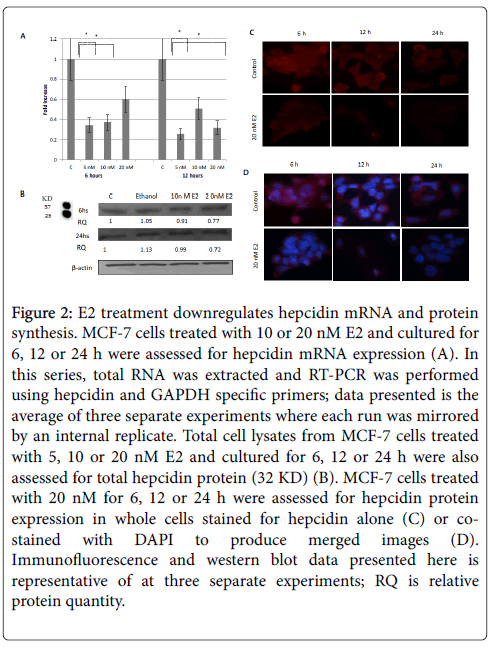
Treatment of MCF-7 cells with increasing concentrations of E2 resulted in a significant downregulation in hepcidin mRNA synthesis especially at 5 nM/24 h dose (Figure 2A). Cells treated with E2, those at 20 nM in particular, also showed a significant decrease in hepcidin protein content at 6 and 12 h and a very significant decrease at 24 h as shown by western blotting (Figure 2B) and immunofluoresce (Figure 2C and 2D) studies. Based on these observations, the status of FPN expression following E2 treatment was assessed to test whether decreased hepcidin synthesis could maintain FPN integrity.
Figure 2: E2 treatment downregulates hepcidin mRNA and protein synthesis. MCF-7 cells treated with 10 or 20 nM E2 and cultured for 6, 12 or 24 h were assessed for hepcidin mRNA expression (A). In this series, total RNA was extracted and RT-PCR was performed using hepcidin and GAPDH specific primers; data presented is the average of three separate experiments where each run was mirrored by an internal replicate. Total cell lysates from MCF-7 cells treated with 5, 10 or 20 nM E2 and cultured for 6, 12 or 24 h were also assessed for total hepcidin protein (32 KD) (B). MCF-7 cells treated with 20 nM for 6, 12 or 24 h were assessed for hepcidin protein expression in whole cells stained for hepcidin alone (C) or costained with DAPI to produce merged images (D). Immunofluorescence and western blot data presented here is representative of at three separate experiments; RQ is relative protein quantity.
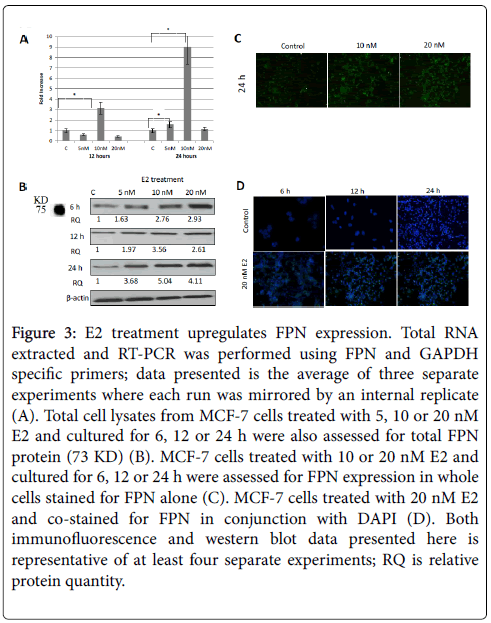
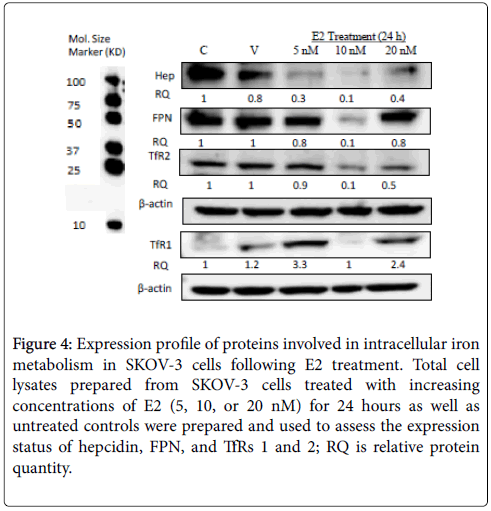
As shown in Figure 3A, E2 treatment significantly enhanced FPN mRNA expression especially at 10 nM/24 h dose. In fact, E2 treatment, not only maintained, but rather enhanced FPN protein expression in a dose and time-dependent manner. In that, while E2 treatment at 5 nM resulted in a moderate increase in FPN expression (Figure 3B, 3C and 3D), there was a very pronounced increase in FPN expression at 10 or 20 nM/12 or 24 h (Figures 3B and 3D) doses. Like MCF-7 cells, E2- treated SKOV-3 cells showed a significant reduction in hepcidin synthesis especially at 5 and 10 nM/24 h doses. In contrast to MCF-7 cells however, FPN expression in E2-treated SKOV-3 cells was either similar to that in controls (5 and 20 nM) or much reduced (10 nM) (Figure 4).
Figure 3: E2 treatment upregulates FPN expression. Total RNA extracted and RT-PCR was performed using FPN and GAPDH specific primers; data presented is the average of three separate experiments where each run was mirrored by an internal replicate (A). Total cell lysates from MCF-7 cells treated with 5, 10 or 20 nM E2 and cultured for 6, 12 or 24 h were also assessed for total FPN protein (73 KD) (B). MCF-7 cells treated with 10 or 20 nM E2 and cultured for 6, 12 or 24 h were assessed for FPN expression in whole cells stained for FPN alone (C). MCF-7 cells treated with 20 nM E2 and co-stained for FPN in conjunction with DAPI (D). Both immunofluorescence and western blot data presented here is representative of at least four separate experiments; RQ is relative protein quantity.
Figure 4: Expression profile of proteins involved in intracellular iron metabolism in SKOV-3 cells following E2 treatment. Total cell lysates prepared from SKOV-3 cells treated with increasing concentrations of E2 (5, 10, or 20 nM) for 24 hours as well as untreated controls were prepared and used to assess the expression status of hepcidin, FPN, and TfRs 1 and 2; RQ is relative protein quantity.
The ability of E2-treated MCF-7 cells to maintain and enhance FPN expression suggested that the intracellular conditions favor intracellular labile iron efflux. Accordingly, the status of intracellular labile iron content following E2 treatment was assessed using the calcein/deferiprone (or deferoxamine)-based flow cytometry method [41]. This approach has the advantage of assessing labile iron bound to low affinity ligands but not iron bound to high affinity ligands such as ferritin or hemosiderin.
As shown in Figure 1A, intracellular iron content in E2-treated MCF-7 cells was noticeably lower than that in untreated controls. Reduction in intracellular iron content was dose and time-dependent; in that, cells treated with E2 at 20 nM and cultured for 48 h contained the least amount of iron. Although cells treated 5 nM E2 and cultured for 24 h showed a significant reduction in intracellular iron content as compared with untreated cells, their iron content was significantly higher than that in cells treated with higher doses or those treated with the same dose and cultured for 48 h (data not shown). It must be noted that reduction in intracellular labile iron content was less evident at 6 and 12 h post treatment irrespective of E2 dose (data not shown). In the case of SKOV-3, reduced intracellular labile iron content was evident in cells treated with 5 and 10 nM for 24 hours. Cells treated with 20 nM E2 for 24 hours actually showed slightly higher levels of intracellular labile iron content as compared with untreated controls (Figure 1).
Based on these findings, it was expected that E2-treated cells will tend to upregulate the expression of TFR1 and/or TFR2 as means of compensating for lost intracellular iron. Surprisingly however, E2 treatment resulted in a differential reduction in TFR1 and TFR2 mRNA and protein expression.
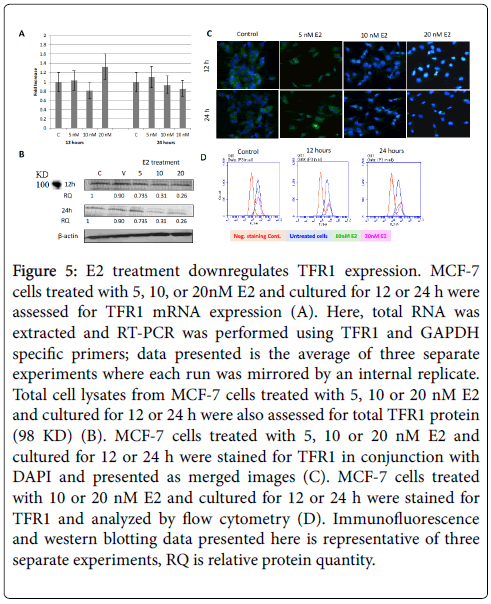
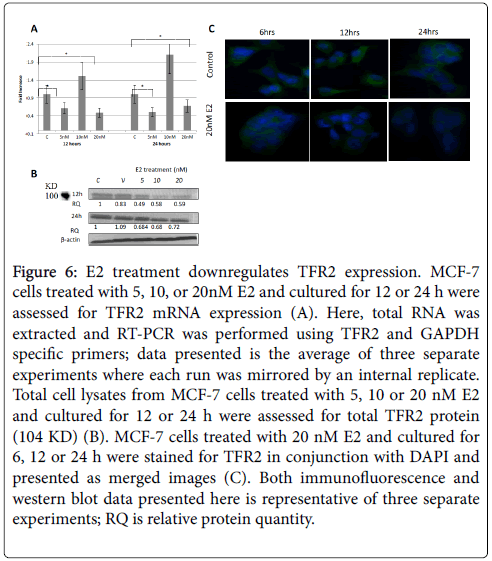
As shown in Figure 5A, the expression of TFR1 mRNA in cells treated with 10 and 20 nM E2 and cultured for 24 h was slightly lower than that in untreated cells. No clear pattern was discernable concerning TFR1 mRNA expression in E2-reated cells that were cultured for 12 h. E2 treatment showed significantly reduced TFR1 protein expression especially in 20 nM 24h cultures as evidenced by western blotting (Figure 5B), immunofluorescence (Figure 5C), and flow cytometry (Figure 5D) experiment. As for TFR2, mRNA expression was significantly reduced in cells treated with 5 and 20 nM E2 and cultured for 12 or 24 h (Figure 6A). However, TFR2 mRNA expression significantly upregulated in cells treated with 10 nM E2 and cultured for 12 or 24 h. E2 treatment at 20 nM also resulted in a noticeable decrease in TFR2 protein expression as compared with untreated cultures (Figures 6B and 6C). With regard to SKOV-3 cells, E2 treatment resulted in a significant increase in TFR1 especially at 5 and 20 nM/24 h doses (Figure 7). However, TFR2 expression was similar to that in controls at the 5 nM dose or significantly less at higher doses (10 and 20 nM).
Figure 5: E2 treatment downregulates TFR1 expression. MCF-7 cells treated with 5, 10, or 20nM E2 and cultured for 12 or 24 h were assessed for TFR1 mRNA expression (A). Here, total RNA was extracted and RT-PCR was performed using TFR1 and GAPDH specific primers; data presented is the average of three separate experiments where each run was mirrored by an internal replicate. Total cell lysates from MCF-7 cells treated with 5, 10 or 20 nM E2 and cultured for 12 or 24 h were also assessed for total TFR1 protein (98 KD) (B). MCF-7 cells treated with 5, 10 or 20 nM E2 and cultured for 12 or 24 h were stained for TFR1 in conjunction with DAPI and presented as merged images (C). MCF-7 cells treated with 10 or 20 nM E2 and cultured for 12 or 24 h were stained for TFR1 and analyzed by flow cytometry (D). Immunofluorescence and western blotting data presented here is representative of three separate experiments, RQ is relative protein quantity.
Figure 6: E2 treatment downregulates TFR2 expression. MCF-7 cells treated with 5, 10, or 20nM E2 and cultured for 12 or 24 h were assessed for TFR2 mRNA expression (A). Here, total RNA was extracted and RT-PCR was performed using TFR2 and GAPDH specific primers; data presented is the average of three separate experiments where each run was mirrored by an internal replicate. Total cell lysates from MCF-7 cells treated with 5, 10 or 20 nM E2 and cultured for 12 or 24 h were assessed for total TFR2 protein (104 KD) (B). MCF-7 cells treated with 20 nM E2 and cultured for 6, 12 or 24 h were stained for TFR2 in conjunction with DAPI and presented as merged images (C). Both immunofluorescence and western blot data presented here is representative of three separate experiments; RQ is relative protein quantity.
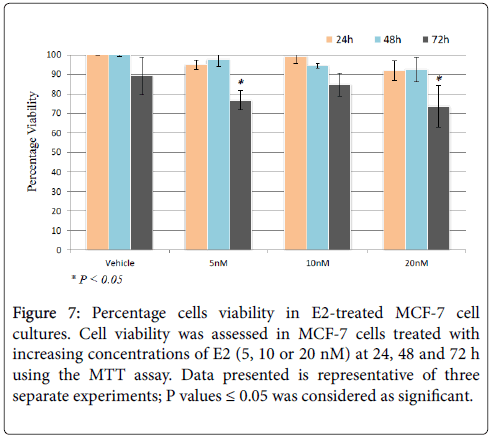
Figure 7: Percentage cells viability in E2-treated MCF-7 cell cultures. Cell viability was assessed in MCF-7 cells treated with increasing concentrations of E2 (5, 10 or 20 nM) at 24, 48 and 72 h using the MTT assay. Data presented is representative of three separate experiments; P values ≤ 0.05 was considered as significant.
The ability of E2 treatment to precipitate adverse of detrimental effects relating to cell growth and viability was assessed in MCF-7 cells treated with 20 nM E2 for up to 72 hours using the MTT assay. As shown in Figure 7, cell viability was only slightly reduced at 24 h post treatment irrespective of E2 dose. However, cell viability was significantly reduced in cell receiving 5 or 20 nM at 72 h post treatment.
Discussion
Data presented here suggest that E2 treatment disrupts intracellular iron metabolism and enhances intracellular iron efflux and depletion. This is based on the observation that: (i) E2 treatment downregulates hepcidin synthesis (Figures 1 and 6) and manipulates FPN expression (Figures 2 and 6). (ii) Intracellular labile iron content is noticeably lower in E2-treated cells as compared with untreated counterparts (Figure 3). (iii) E2 treatment alters TFR1 and TFR2 expression (Figures 4 and 5), which enables treated cells to differentially respond to labile iron depletion. These findings are consistent with previous reports, which have shown that E2 downregulates hepcidin synthesis and increases systemic iron availability [9-16]. The ability of E2 to perturb iron homeostasis was more evident at high doses (Figures 1,3,4,5 and 6), which is consistent with the observation that elevated, rather than physiologic, levels of E2 associate with increased systemic iron availability [9-16,42]. As reported previously [12], E2-driven changes in iron status relates to the need to compensate for E2-triggered iron loss though menstruation and E2-dependent pregnancy in premenopausal women.
Inconsistent with these findings however was the observation that E2 suppresses FPN expression [43] and that it enhances hepcidin synthesis though a GPR30-BMP6-depeddent signaling in hepatocytes and the liver-derived Hep2 cells [44]. This is in direct conflict with previous work, which has shown that elevated levels of E2 associate with increased FPN expression [12]. It is also in conflict with the finding that ER-α engagement downregulates hepcidin synthesis [15], that E2 increases systemic iron concentration [9,11,13], and that E2 enhances Hif-1α expression [12], which in turn downregulates hepcidin synthesis. Among the possibilities that could explain these inconsistencies is the type of cells used, differences in E2 concentration and/or exposure time as well as the type of receptor E2 engages within target cells. In this context, 10 nM E2 treatment resulted in a moderate inhibition of hepcidin mRNA expression at 12 h post culture as compared with that induced by 10 nM at 6 h or that induced by 5 or 2 nM E2 treatments at 12 h (Figure 2A). Furthermore, there was a very significant increase in TFR2 mRNA expression as compared with that induced by 5 or 2 nM E2 treatments (Figure 6A). Hence, one should be mindful of the possibility that E2 could exert paradoxical effects on iron homeostasis depending on E2 concertation and/or exposure time just as it does with regard to several other aspects of its biology [38,39].
The ability of high dose E2 treatment to manipulate iron homeostasis and enhance intracellular iron efflux could provide further insight into the anti-carcinogenic potential of E2 [24,37,39,45]. This is based on the fact that the expression profile hepcidin, FPN, and intracellular iron content in E2-treated MCF-7 cells as documented in this study is the exact opposite of that observed in typical breast cancer cells [24]. High-dose E2 treatment, which was first introduced in 1944 [46], remained the standard approach for treatment of metastatic breast cancer in postmenopausal women until nonsteroidal anti-E2s (e.g. tamoxifen) were introduced in the late 1970s. A clinical trial involving tamoxifen versus high dose diethylstilbestrol (DES; a synthetic E2) in metastatic breast cancer showed that the responsiveness to both treatments was equivalent [47] and survival was significantly improved with DES [48]. Furthermore, a Women’s Health Initiative study involving 10,739 postmenopausal women with a prior hysterectomy concluded that E2 replacement therapy reduces the incidence of invasive breast cancer [49]. The mechanism underlying the anti-carcinogenic effects of E2 is not fully understood but there is evidence to suggest that the antitumor effects of physiologic E2 could be explained by its ability to induce apoptosis [37] though direct E2/ER interactions with E2 response elements (EREs) in genes that induce the intrinsic apoptotic pathway or though upregulated expression of Fas (CD95) and/or Fas-ligand (CD95L) that engages the extrinsic apoptotic pathway. E2-dependent intracellular iron depletion, which could minimize the proliferative potential of cancer cells, reduce the rate of free radical generation and propagation and hence reduce intracellular oxidative stress, is further evidence of the anticarcinogenic potential of E2.
The effect of E2 treatment on intracellular iron metabolism in SKOV-3 cells was distinct from that in MCF-7 cells. In that, although E2 treatment resulted in reduced hepcidin expression regardless of dose (Figure 4), reduced intracellular labile iron content was most evident at 5 nM rather than 20 nM as was the case inn MCF-7 cells (Figure 1). There was also reduced expression of FPN and in the case of SKOV-3 cells (Figure 5) rather than increased expression as was noted in MCF-7 cells (Figure 5). Additionally, although TfR2 expression was reduced in SKOV-3 cells in a way similar to that in MCF-7 cells, the expression of TfR1 was significantly enhanced, rather than reduced, in SKOV-3 cells. This suggests that E2 treatment downregulates hepcidin synthesis, enhances intracellular iron efflux, and differentially disrupts intracellular iron metabolism in different types of cancer cells in a dose-dependent manner. Furthermore, the pattern of E2-induced disruption of intracellular iron metabolism seems to be cancer cell type-dependent as evidenced by the disparate changes seen in MCF-7 vs. SKOV-3 cells following E2 treatment.
Lastly, decreased labile iron content following E2 treatment is consistent with the idea that iron deprivation reduces cell viability and may precipitate iron deprivation-dependent apoptosis [50,51]. However, further work is still needed to establish whether E2 treatment precipitates such effects on cancer cells. Should this prove to be the case, high dose E2 treatment could provide an alternative to the problematic employment of iron chelation as an anti-cancer therapy [29-36].
Conclusion
Findings presented her suggest that E2 treatment disrupts intracellular iron metabolism and induces intracellular labile iron efflux. The existence of such an E2-iron axis could help explain some of the paradoxical effects of E2 on cancer (carcinogenesis vs. anticarcinogenesis) and immunity (autoimmunity vs. immunosuppression).
Authors’ contributions
M Hamad was responsible for the conception of the idea, literature review, hypothesis formulation, data analysis and interpretation and manuscript preparation. J Shafarin and K Bajbouj, performed the in vitro studies and the various assays including western blotting, immunofluorescence, flow cytometry, El-Serafy A and Sandeep D did all the RT-PCR work.
Conflict of Interest
The authors declare that they have no conflict of interest.
Acknowledgments
This work was supported by research grant MH/15010501005-P/ VCGSR, University of Sharjah, UAE. The authors wish to acknowledge the generous financial support of the UOS Vice Chancellor’s office for research and the in-house support of the Sharjah Institute for Medical Research, University of Sharjah, UAE.
References
- Nemeth E, Tuttle MS, Powelson J, Vaughn MB, Donovan A, et al.(2004) Hepcidin regulates cellular iron efflux by binding to ferroportin and inducing its internalization.Science 306: 2090-2093.
- Peyssonnaux C, Zinkernagel AS, Schuepbach RA, Rankin E, Vaulont SH, et al.(2007). Regulation of iron homeostasis by the hypoxia-inducible transcription factors (HIFs).J Clin Invest 117: 1926-1932.
- Tanno T, Bhanu NV, Oneal PA, Goh SH, Staker P, et al.(2007) High levels of GDF15 in thalassemia suppress expression of the iron regulatory protein hepcidin.Nature Medicine 3:1096-1101.
- Silvestri L, Pagani A, Nai A, De Domenico I, Kaplan J, et al.(2008) The serine protease matriptase-2 (TMPRSS6) inhibits hepcidin activation by cleaving membrane hemojuvelin.Cell Metabolism 8:502-511.
- Schmidt PJ, Toran PT, Giannetti AM, Bjorkman PJ, Andrews NC(2008) The transferrin receptor modulates Hfe-dependent regulation of hepcidin expression.Cell Metabolism 7:205-214.
- Nemeth E, Rivera S, Gabayan V, Keller C, Taudorf S, et al.(2004) IL-6 mediates hypoferremia of inflammation by inducing the synthesis of the iron regulatory hormone hepcidin.J Clin Invest 113:1271-1276.
- Lee P, PengH, Gelbart T, Wang L, Beutler E(2005). Regulation of hepcidin transcription by interleukin-1 and interleukin-6.ProcNatlAcadSci USA 102:1906-1910.
- Peyssonnaux C, Zinkernagel AS, Datta V, Lauth X, Johnson RS, et al.(2006) TLR4-dependent hepcidin expression by myeloid cells in response to bacterial pathogens.Blood 107:3727-3732.
- MattaceRaso G, Irace C, Esposito E, Maffettone C, Iacono A, et al.(2009)Ovariectomy and E2 treatment modulate iron metabolism in rat adipose tissue.BiochemPharmacol 78:1001-1007.
- Campesi I, Sanna M,Zinellu A, Carru C, Rubattu L, et al. (2012) Oral contraceptives modify DNA methylation and monocyte-derived macrophage function.Biology of Sex Differentiation 3: 4
- Ulas M, Cay M(2011) Effects of 17β-estradiol and vitamin E treatments on blood trace element and antioxidant enzyme levels in ovariectomized rats.Biology of Trace Element Research 139:347-355.
- Stuckey R, Aldridge T, Lim FL, Moore DJ, Tinwell H, et al.(2006) Induction of iron homeostasis genes during E2-induced uterine growth and differentiation.Mol Cell Endocrinol 253:22-29.
- Hamad M, Awadallah S(2013)E2-dependent changes in serum iron levels as a translator of the adverse effects of E2 during infection: A conceptual framework.Med Hypotheses 81:1130-1134.
- Hua K, Din J, Cao Q, Feng W, Zhang Y, et al.(2009) E2 and progestin regulate HIF-1alpha expression in ovarian cancer cell lines via the activation of Akt signaling transduction pathway.Oncol Rep 21:893-898.
- Hou Y, Zhang S, Wang L, Li J, Qu G, et al. (2012) E2 regulates iron homeostasis though governing hepatic hepcidin expression via an E2 response element.Genetics 511:398-403.
- Robinson DP, Lorenzo ME, Jian W, Klein SL(2011) Elevated 17β-estradiol protects females from influenza A virus pathogenesis by suppressing inflammatory responses.PLoS Pathology 7:e1002149.
- XiongW, Wang L, Yu F(2014) Regulation of cellular iron metabolism and it implications in lung cancer progression. Med Oncol 31:28.
- Yildirim A, Meral M, Kaynar H, Polat H, Ucar EY(2007) Relationship between serum levels of some acute-phase proteins and stage of disease and performance status in patients with lung cancer.Med SciMonit13: CR195-200.
- Kalousova M, Krechler T, Jachymova M, Kubena AA, Zak A, Zima T.(2012). Ferritin as an independent mortality predictor in patients with pancreas cancer. Results of a pilot study. TumourBiol 33:1695-1700.
- Osborne NJ, Gurrin LC, Allen KJ, Constantine CC, Delatycki MB, et al.(2010) HFE C282Y homozygotes are at increased risk of breast and colorectal cancer. Hepatology 51:1311-1318.
- Pusatcioglu CK, Nemeth E, Fantuzzi G, Llor X, Freels S, et al. (2014) Systemic and tumor level iron regulation in men with colorectal cancer: a case control study. NutrMetab (Lond) 11:21.
- Xue X, Taylor M, Anderson E, Hao C, Qu A, et al. (2012) Hypoxia-inducible factor-2alpha activation promotes colorectal cancer progression by dysregulating iron homeostasis. Cancer Res 72:2285-2293.
- Xue X, Shah YM (2013) Intestinal iron homeostasis and colon tumorigenesis. Nutrients 5:2333-23351.
- Pinnix ZK, Miller LD, Wang W, D’Agostino R Jr, Kute T, et al.(2010) Ferroportin and iron regulation in breast cancer progression and prognosis.SciTransl Med 2:43-56.
- Shpyleva SI, Tryndyak VP, Kovalchuk O, Starlard-Davenport A, Chekhun VF, et al. (2011). Role of ferritin alterations in human breast cancer cells. Breast Cancer Res Treat 126:63-71.
- Yang J, Bielenberg DR, RodigSJ, Doiron R, CliftonMC, et al. (2009) Lipocalin 2 promotes breast cancer progression. ProcNatlAcadSci USA 106:3913-3918.
- Yang J, McNeish B, Butterfield C, Moses MA (2013) Lipocalin 2 is a novel regulator of angiogenesis in human breast cancer. FASEB J 27:45-50.
- Habashy OH, Powe DG, Staka CM, Rakha EA, Ball G, et al.(2010). Transferrin receptor (CD71) is a marker of poor prognosis in breast cancer and can predict response to tamoxifen.Breast Cancer Res Treat 1119: 283-1193.
- Chaston TB, Watts RN, Yuan J, Richardson DR (2004) Potent antitumor activity of novel iron chelators derived from di-2-pyridylketone isonicotinoylhydrazone involves fenton-derived free radical generation. Clin Cancer Res 10:7365-7374.
- Pogribny IP, Tryndyak VP, Pogribna M, Shpyleva S, Surratt G, et al. (2013) Modulation of intracellular iron metabolism by iron chelation affects chomatinremodeling proteins and corresponding epigenetic modifications in breast cancer cells and increases their sensitivity to chemotherapeutic agents. Int J Oncol 42:1822-1832.
- Heath JL, Weiss JM, Lavau CP, Wechsler DS (2013) Iron deprivation in cancer-potential therapeutic implications. Nutrients 5:2836-2859.
- Kim JL, Kang HN, Kang MH, Yoo YA, Kim JS, et al. (2011) The oral iron chelatordeferasirox induces apoptosis in myeloid leukemia cells by targeting caspase. ActaHaemato 126:241-245.
- Fukushima T, Kawabata H, Nakamura T, Iwao H, Nakajima A, et al. (2011) Iron chelation therapy with deferasirox induced complete remission in a patient with chemotherapy-resistant acute monocytic leukemia. Anticancer Res 31:1741-1744.
- Bystrom LM, Rivella S(2015) Cancer Cells with Irons in the Fire.Free RadicBiol Med 79: 337-42.
- Rao VA (2013) Iron Chelators with Topoisomerase-Inhibitory Activity and Their Anticancer Applications.Antioxidants & Redox Signaling 18: 930-955.
- Poggiali E, Cassinerio E, Zanaboni L, Cappellini MD (2012) An update on iron chelation therapy. Blood Transfus 10: 411-422.
- Fan P, Griffith OL, Agboke FA, Anur P, Zou X, et al. (2013) c-Src modulates E2-induced stress and apoptosis in E2-deprived breast cancer cells. Cancer Res 73:4510-4520.
- Jordan VC(2008) The 38th David A. Karnofsky lecture: the paradoxical actions of estrogen in breast cancer-survival or death? J ClinOncol 26:3073-3082.
- Maximov PY, Lewis-Wambi JS, Jordan VC (2009) The paradox of oestradiol-induced breast cancer cell growth and apoptosis. Curr Signal TransductTher 4:88-102.
- Otto C, Kantner I, Nubbemeyer R, Schkoldow J, Fuchs I, et al.(2012)Estradiol release kinetics determine tissue response in ovariectomized rats.Endocrinology 153: 1725-1733.
- Prus E, Fibach E(2008) Flow Cytometry Measurement of the Labile Iron Pool in Human Hematopoietic Cells. Cytometry 73A:22-27.
- Lehtihet M, Bonde Y, Beckman L, Berinder K, Hoybye C, et al. (2016) Circulating Hepcidin-25 Is Reduced by Endogenous E2 in Humans. PLoS ONE 11: e0148802.
- Qian Y, Yin C, Chen Y, Zhang S, Jiang L, et al.(2015)E2 contributes to regulating iron metabolism though governing ferroportin signaling via an E2 response element.Cell Signal 27:934-942.
- Ikeda Y, Tajima S, Izawa-Ishizawa Y, Kihira Y, Ishizawa K, et al.(2012) E2 Regulates Hepcidin Expression via GPR30-BMP6-Dependent Signaling in Hepatocytes.PLoS ONE 7:e40465.
- Manz DH, Blanchette NL, Paul BT, Torti FM, Torti SV. (2016). Iron and cancer: recent insights. Ann N Y AcadSci 1368:149-61.
- Haddow A, Watkinson JM, Paterson E, Koller PC (1944) Influence of synthetic oE2s on advanced malignant disease. Br Med J 2:393-398.
- Ingle JN, Ahmann DL, Green SJ, Edmonson JH, Bisel HF, et al. (1981) Randomized clinical trial of diethylstilbestrol versus tamoxifen in postmenopausal women with advanced breast cancer. N Engl J Med 304:16-21.
- Peethambaram PP, Ingle JN, Suman VJ, Hartmann LC, Loprinzi CL (1999) Randomized trial of diethylstilbestrol vs. tamoxifen in postmenopausal women with metastatic breast cancer. An updated analysis. Breast Cancer Res Treat 54:117-122.
- LaCroix AZ, Chlebowski RT, Manson JE, Aragaki AK, Johnson KC, et al. (2011) Health outcomes after stopping conjugated equine E2s among postmenopausal women with prior hysterectomy: a randomized controlled trial. JAMA 305:1305-1314.
- Liu P, He K, Song H, Ma Z, Yin W, et al.(2016) Deferoxamine-induced increase in the intracellular iron levels in highly aggressive breast cancer cells leads to increased cell migration by enhancing TNF-α-dependent NF-κB signaling and TGF-β signaling.J InorgBiochem 160:40-48.
- Kovaif J, Valenta T, Stýbrová H (2001) Differing sensitivity of tumor cells to apoptosis induced by iron deprivation in vitro.In Vitro Cell DevBiolAnim 37:450-458.
Copyright: © 2016 Shafarin J, et al. This is an open-access article distributed under the terms of the Creative Commons Attribution License, which permits unrestricted use, distribution and reproduction in any medium, provided the original author and source are credited.
