Indexed In
- Genamics JournalSeek
- Academic Keys
- JournalTOCs
- China National Knowledge Infrastructure (CNKI)
- Access to Global Online Research in Agriculture (AGORA)
- Centre for Agriculture and Biosciences International (CABI)
- RefSeek
- Directory of Research Journal Indexing (DRJI)
- Hamdard University
- EBSCO A-Z
- OCLC- WorldCat
- Scholarsteer
- SWB online catalog
- Publons
- Euro Pub
- Google Scholar
Useful Links
Share This Page
Journal Flyer
Open Access Journals
- Agri and Aquaculture
- Biochemistry
- Bioinformatics & Systems Biology
- Business & Management
- Chemistry
- Clinical Sciences
- Engineering
- Food & Nutrition
- General Science
- Genetics & Molecular Biology
- Immunology & Microbiology
- Medical Sciences
- Neuroscience & Psychology
- Nursing & Health Care
- Pharmaceutical Sciences
Research Article - (2024) Volume 15, Issue 4
Effects of Freezing Methods on the Formation of Ice Crystals and the Physicochemical Properties of Beef
Xin Wen1,2, Shitong Zhang1,2, Hui Ding1,2, Yunqi Xie1,2, Yuan Xie1,2, Zixuan Wang1,2, Jie Zhang1,2 and Peng Zhou1,2*2School of Food Science and Technology, Jiangnan University, Wuxi, Jiangsu Province, China
Received: 28-May-2024, Manuscript No. JFPT-24-25875; Editor assigned: 31-May-2024, Pre QC No. JFPT-24-25875 (PQ); Reviewed: 14-Jun-2024, QC No. JFPT-24-25875; Revised: 21-Jun-2024, Manuscript No. JFPT-24-25875 (R); Published: 28-Jun-2024, DOI: 10.35248/2157-7110.24.15.1122
Abstract
This study investigated the effects of various freezing methods on beef quality, including Air Freezing (AF) at -20°C, -40°C, and -60°C; Immersion Freezing (IF) at -20°C and -40°C; and liquid nitrogen freezing. We analyzed quality-related indexes such as ice crystal structure, microstructure, texture, freezing loss, thawing loss, and moisture distribution. Results indicated that an accelerated freezing rate increased hardness, restoring force, and rupture strength while reducing ice crystal size, freezing loss, and thawing loss. Quality deterioration was observed across different treatment groups, but the liquid nitrogen group and the IF -40°C group maintained beef quality most effectively, with the liquid nitrogen group exhibiting characteristics closest to the control. Infiltration freezing at equivalent temperatures outperformed air freezing by inhibiting ice crystal growth and reducing quality deterioration. In conclusion, liquid nitrogen freezing can mitigate quality deterioration in beef during freezing.
Keywords
Beef; Liquid nitrogen freezing; Ice crystal; Microstructure; Texture
Introduction
Beef is a highly nutritious meat that is rich in protein, amino acids, mineral elements, and B vitamins but low in fat and cholesterol. It is considered a healthy and sustainable option for modern lifestyles and is particularly beneficial for the elderly, children, and those in recovery who require additional nutrition.
Freezing is an efficient method of food preservation widely used in the meat industry to extend shelf life [1]. However, the freezing process significantly impacts meat quality. Ice crystal growth during freezing mechanically damages cells within meat fibers. The concentration effect of freezing accelerates intracellular biochemical reactions, triggering changes in physical and chemical indicators such as water loss, protein denaturation, ATP metabolism, etc. [2]. The size of ice crystals is a key factor affecting meat quality [3]. Studies have shown that slow freezing rates tend to form large ice crystals, causing more severe cell damage [4,5]. Conversely, rapid freezing results in small ice crystals that are evenly distributed within muscle fibers, thereby reducing damage. Rapid freezing technology maintains food quality better than traditional cooling technology. Immersion Freezing (IF) and liquid nitrogen freezing use liquid coolants with high heat transfer coefficients for rapid freezing rates, resulting in superior frozen food quality [6]. TENGX demonstrated that freezing Pacific oysters to -80°C using liquid nitrogen significantly improves their quality [7]. This study aims to investigate the effects of different freezing methods on the physicochemical indexes of beef to reveal how freezing rates impact beef quality. The findings will provide a theoretical basis for understanding quality changes and offer insights into ameliorating quality deterioration during the freezing process.
Materials and Methods
Materials and reagents
The fresh beef was purchased from Ole’ supermarket in Vientiane City of Wuxi, with the sirloin part of Luxi yellow beef selected. The chilled Luxi yellow beef was cut into steaks of uniform shape, 2 cm thickness, and a mass of 200 ± 10 g. Anhydrous ethanol, potassium carbonate, perchloric acid, xylene, glycerin, sliced paraffin, chloroform, formaldehyde aqueous solution, and glacial acetic acid were all analytically pure and obtained from Sinopharm Group Chemical Reagent Co., Ltd., Shanghai, China. Hematoxylin-Eosin stain (HE) was sourced from Shanghai Biyuntian Biotechnology Co., Ltd., Shanghai, China.
Equipment
The sample temperature was controlled by BC/BD-301HD Refrigerator (-20°C), DW/BD-55W321EU1 Refrigerator (-40°C), DW/BD-55W321EU1 Refrigerator (-60°C) from Qingdao Haier Co., Ltd., Qingdao, China; XODC-4030 Cryogenic Thermostat from Nanjing Xianou Instrument Manufacturing Co., Ltd., Nanjing, China; and UT322 High-precision Contact Thermometer from Unilead Group Co., Ltd., Shanghai, China. The experiment also utilized a MESOMR23-060V-I NMR Analyzer from Shanghai Numec Electronic Technology Co., Ltd., Shanghai, China; EL204 and PL2002 Electronic Balances from METTLER TOLEDO Instruments Co., Ltd., Shanghai, China; TA.XT-Plus Physical Property Analyzer from Stable Micro System, UK; T18 basic high-speed disperser from IKA company, Germany; and paraffin embedding machine, manual rotary microtome, and optical microscope from Leica company, Germany.
Methods
Grouping of beef samples: The treated beef was placed in self- sealing sterile bags and randomly divided into eight groups. The measurement conditions were as follows: The control group (fresh beef); air freezing (AF -20°C, AF -40 °C, AF -60°C); immersion freezing (IF -20°C, IF -40°C); and liquid nitrogen freezing. The samples were respectively placed in -20°C, -40°C, -60°C refrigerators, a -20°C, -40°C low-temperature thermostat (containing anhydrous ethanol), and frozen in liquid nitrogen until the center temperature reached -20°C before being stored in a -20°C refrigerator for 24 hrs.
Freezing curve: The determination of the freezing curve was based on the method of Wu G with slight modifications [8]. Thermocouple probes were inserted into the center of the beef, which was then put in self-sealing bags. The bags were placed in refrigerators at -20°C, -40°C, a low-temperature thermostat at -60°C, -20°C, -40°C, and in liquid nitrogen, separately. The central temperature of the beef during different freezing processes was recorded in real time by the thermocouple. The freezing curve was plotted with freezing time as the abscissa and the center temperature as the ordinate.
Ice crystal distribution: The ice crystal distribution was determined based on the method of Diao Y with minor modifications [9]. The frozen samples were cut into 5 mm × 5 mm × 2 mm cubes, immersed in precooled Carnoy solution (30% chloroform, 60% anhydrous ethanol, 10% glacial acetic acid, v/v), and then fixed at -20°C for 24 h. After fixation, the samples were immersed in 70%, 85%, and 95% ethanol for 30 min each to dehydrate the tissue at room temperature. They were further dehydrated by transferring to anhydrous ethanol for 15 min twice. To make the tissues transparent, the samples were then immersed in xylene for 20 min twice. The transparent tissues were embedded, sliced, stained with Hematoxylin and Eosin (HE), observed by optical microscope, and analyzed after being immersed in molten paraffin at 65 °C in an oven for 1.5 h twice.
Thawing loss: The thawing loss was measured using the methods of Li D and Sun Q with minor modifications [10,11]. The steaks were weighed after processing to obtain the initial mass M1. The samples from each group were frozen in a refrigerator for 24 h. The mass without self-sealing bags was M2. After weighing, the samples were placed into self-sealing bags and thawed for 12 h in a refrigerator at 4°C. Upon completion of thawing, they were taken out, blotted dry on the surface, and weighed to obtain M3.


Microstructure: The thawed samples were cut into 5 mm × 5 mm × 3 mm cubes and immersed in paraformaldehyde (4%, w/w) for 24 h to fix. After dehydration with 75% ethanol (v/v) at room temperature, the tissue was made transparent in xylene for 20 min twice. After waxing them three times, the tissues were embedded, sliced, stained with HE, observed by optical microscope, and analyzed at last.
Determination of water distribution by low-field nuclear magnetic resonance: Moisture distribution was determined according to Bertram’s method with certain modifications [12]. Using the CPMG sequence, parameters were set as follows: P1=7.52 μs, P2=15.04 μs, TD=240026, PRG=3, RFD=0.080 ms, TE=0.200 ms, TW=2500 ms, NECH=6000, NS=4. The measured data were inverted to obtain the relaxation time distribution, peak area, and peak ratio of water in each component.
Texture: The texture was determined by the method with slight modifications [13]. The frozen beef samples were thawed and steamed before determination. Keeping the surface of the beef in the direction of muscle fibers, the texture was measured by the AMORS probe. The parameters of the TA.XT-Plus physical property analyzer were as follows: Pre-test speed of 2 mm/s, test speed of 10 mm/s, post-test speed of 10 mm/s, test distance of 8 mm, and trigger force of 10 g. Three replicate groups were set up, and each group was measured six times. The experimental results were expressed by hardness, resilience, and fracture strength.
Data processing: The experimental data were analyzed using IBM SPSS Statistics 26 for single-factor analysis and Duncan’s multiple range tests. Charts were created using Origin 2024 software.
Results and Discussion
Freezing curve
The freezing process is divided into precooling, phase transition, and supercooling stages [14]. The phase transition stage is significant as it determines the freezing rate and quality characteristics of frozen products. During this stage, the beef’s freezing curve tends to flatten due to the transformation of the crystal nucleus into ice crystals with the release of latent heat. Over 80% of the water freezes when the samples are in the phase transition stage, which is when they pass through the maximum ice crystal generation zone (-1°C to -5°C) [15].
As shown in Figure 1A, the freezing rates from fastest to slowest are: liquid nitrogen, IF -40°C, IF -20°C, AF -60°C, AF -40°C, AF-20°C. The curves AF -20°C exhibits a very gentle stage at 0°C. In contrast, the liquid nitrogen, IF -40°C, and IF -20°C groups have almost no gentle stage, and the temperature drops sharply due to the large initial temperature difference and intense heat exchange. Figure 1B, shows that the time each group takes to pass through the maximum ice crystal formation band (0 to -5°C) is as follows: liquid nitrogen at 24 s, IF -40°C at 2 min, IF -20°C at 6 min, AF -60°C at 20 min, AF -40°C at 46 min, and AF -20°C at 80 min. The time for the liquid nitrogen group to pass through the maximum ice crystal production zone is shorter than that of other groups. The IF -40°C group’s time is reduced by 44 min compared to the AF -40°C group, and the IF -20°C group’s time is shortened by 364 min compared with the AF -20°C group. This indicates that infiltration freezing has a faster freezing rate at the same temperature (Figure 1).
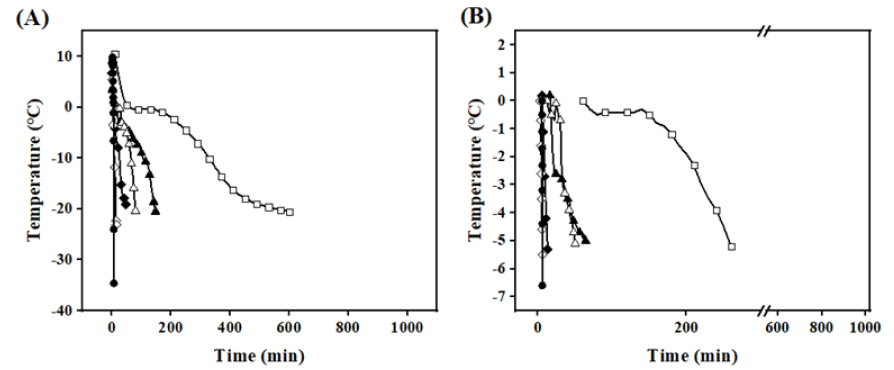
Figure 1: A) Freezing curves of Beef under different freezing methods; B) Time to pass through the zone of maximum ice crystal production (0~-5°C). Note:  AF -60°C;
  LNF.
LNF.
Ice crystal distribution
Ice crystal growth plays a critical role in damaging muscle fiber structure, decreasing water-holding capacity, and changing color and texture during freezing [4]. The freezing rate significantly affects the size, number, and distribution of ice crystals. Large ice crystals are more likely to cause mechanical damage to cells, deform muscle tissue structure, and reduce food quality [1,16]. As shown in Figure 2A, irregular, large, and uneven ice crystals are observed in samples after AF freezing treatment, causing a blank area inside the cells due to large ice crystals. This can lead to irreversible tissue rupture and leakage of cell contents, further distorting myofibrils and reducing beef quality. After liquid nitrogen and IF freezing treatments, small and uniform ice crystals form in the sample. The distribution of muscle fibers is more uniform and regular, the gap is smaller, and the structure is more compact.

Figure 2: Effect of different freezing methods on ice crystal distribution. Note: A) ice crystal equivalent diameter; B) Total relative area of ice crystals; C) In Beef. 100 μm is marked in the picture, and the magnification is 10 times.
As seen in Figures 2B and 2C, there is no significant difference in the equivalent diameter (266.16 ± 12.12 μm, 261.35 ± 36.85 μm) and total relative area of ice crystals (24.53 ± 3.49%, 24.75 ± 3.86%) between the AF -20°C and AF -40°C groups (P>0.05). The equivalent diameter of IF -40°C is 67.31% smaller than that of AF -40°C, and the equivalent diameter of IF -20°C is 47.78% smaller than that of AF -20°C. These results indicate that at the same freezing temperature, IF is beneficial for forming small and uniform ice crystals, which reduces mechanical damage to cell structures. The equivalent diameter and relative total area of ice crystals in the IF -40°C and LNF groups are significantly lower than those in other conditions (P<0.05). Accelerating the freezing speed has a significant effect on ice crystal formation in beef; under extremely fast freezing conditions, generated ice crystals are small and uniform, mostly intracellular, minimizing damage to muscle tissue (Figure 2).
Freezing and thawing loss
Freezing and thawing loss is an important metric for assessing frozen meat product quality [5]. As indicated in Figure 3A, all freezing treatments incurred some loss, primarily due to weight reduction from surface ice crystal sublimation on the beef. However, given the brief storage duration, freezing loss was minimal, ranging between 0.2% and 0.7%. Thawing loss was more substantial, varying from 1% to 5%. That the thawing loss rate for AF -20°C was significantly higher than that of other groups (P<0.05). Slow freezing rates allow larger ice crystals to form, damaging cellular structures and leading to greater loss of moisture, nutrients, and inorganic salts due to diminished muscle water-holding capacity and cell rehydration ability. The liquid nitrogen group exhibited the lowest thawing loss due to its rapid freezing rate. Rapid freezing enables samples to quickly pass through the maximum ice crystal production band (0˜-5°C), forming numerous fine intracellular ice crystals and thus inflicting less mechanical damage on muscle tissue and cell structures. The findings suggest that rapid freezing methods can effectively minimize beef’s freezing and post-thaw juice loss (Figure 3).
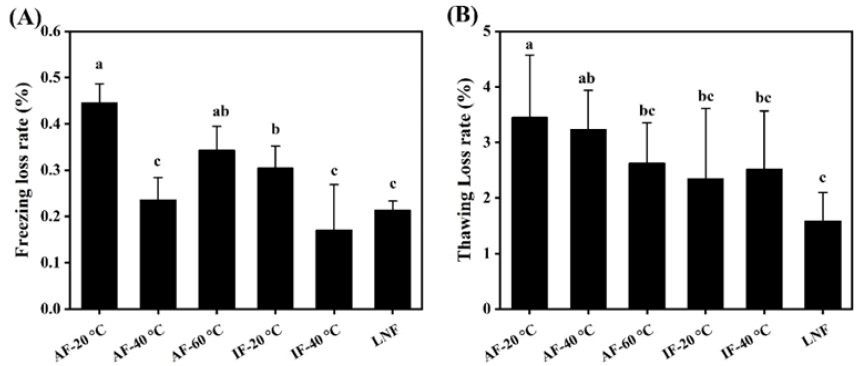
Figure 3: Effect of different freezing methods on freezing loss and thawing loss of Perca fluviatilis. Note: A) Freezing loss; B) Thawing loss.
Microstructure
As shown in Figure 4, the cell gap in the sample decreases as the freezing rate increases. The AF -20°C sample exhibited the largest cell gap, with cells appearing squeezed and deformed, and muscle fibers showing some deviation [9]. This may be due to the separation and degradation of muscle fibers during freezing, which promotes the gradual fracture and collapse of the tissue structure. This observation aligns with the observed decrease in hardness and rupture strength in texture analyses. In contrast, the myofibrils in the LNF and IF -40°C group samples were relatively intact, and the intercellular space was narrow. This is attributed to the formation of small and uniform intracellular ice crystals when the freezing rate is accelerated, which minimizes mechanical damage to myofibrils and cell structures. CHOI Y reported that the intermuscular space in beef from rapid freezing treatments was significantly smaller than that from slow freezing treatments (P<0.05), corroborating the findings of this study (Figure 4) [17].
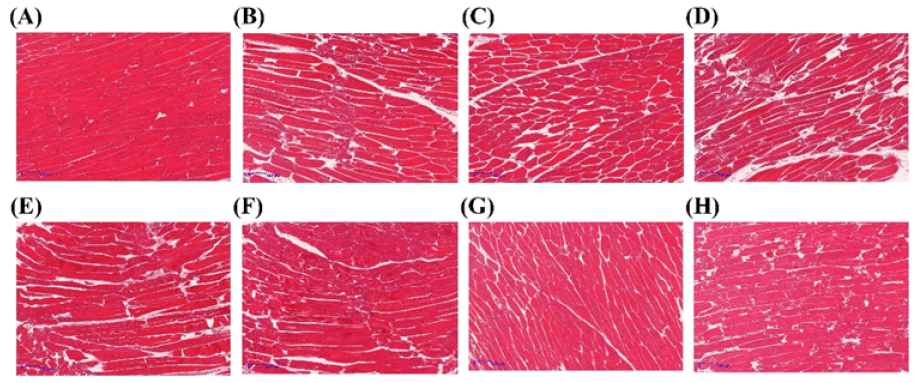
Figure 4: Effect of different freezing methods on t0068e microstructure of fresh beef. Note: AF-20°C; AF-40°C; AF-60°C; IF-20°C; IF-40°C; LNF. It is marked as 100 μm in the figure, and the magnification is 5 times.
Moistening distribution
Moisture distribution is a critical index for assessing food quality and water-holding capacity [18]. The measurement of relaxation time was represented by the hydrogen proton’s transverse relaxation time (T2). T2b1 and T2b2 represented the bound water (1 ms–10 ms), T21 represented the immobile water (10 ms–100 ms), and T22 represented the free water (>100 ms). As shown in Figure 5, immobile water constituted the largest proportion, accounting for over 90% of the total. Compared with the control group, the AF -20°C groups showed a significant decrease in immobile water and a corresponding increase in free water (P<0.05). This may be due to the transformation of some immobile water into free water during air freezing. Furthermore, there was no statistically significant difference in the proportions of bound water, immobile water, and free water peaks among the AF -60°C, IF -20°C, IF -40°C, and liquid nitrogen freezing groups (P>0.05), suggesting that a rapid freezing rate limits the denaturation of myofibrils and thus prevents the conversion of bound and immobile water into free water (Figure 5).
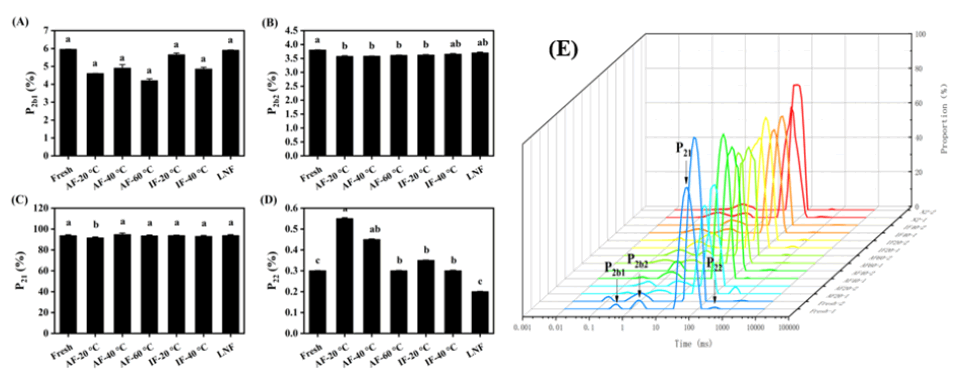
Figure 5: Effect of different freezing methods on the ratio of moisture peaks of each component of Beef.
Texture
Texture is a critical quality attribute for consumer evaluation of beef [19]. As depicted in Figure 4, compared with fresh beef, frozen beef exhibited reduced hardness, resilience, and rupture strength, with notable differences among various freezing treatments. Ice crystal formation during freezing can puncture cells and disrupt muscle fiber structure, with the extent of ice crystal growth directly influencing tissue damage. Additionally, endogenous proteases released may hasten protein hydrolysis during thawing, further impacting meat texture. As shown in Figure 4A, hardness values for the liquid nitrogen group, IF -40°C group, and control group were comparable, whereas other experimental groups had significantly lower hardness compared to the control group (P<0.05). Higher resilience values indicate greater elasticity. Figure 4B, reveals that the resilience of the liquid nitrogen group, IF -40°C group, and control group was similar to that of fresh samples, while resilience in other experimental groups was significantly reduced (P<0.05). Figure 4C, illustrates that all experimental groups had lower rupture strength than the control group, with the AF group showing a marked decrease (P<0.05). This reduction in rupture strength for the AF group may be attributed to larger ice crystals causing deformation of myofibrillar proteins [17]. The liquid nitrogen group’s smaller equivalent diameter and even ice crystal distribution effectively minimized muscle fiber distortion and preserved beef’s original texture. Overall, rapid freezing offers clear benefits for maintaining beef texture quality (Figure 6).
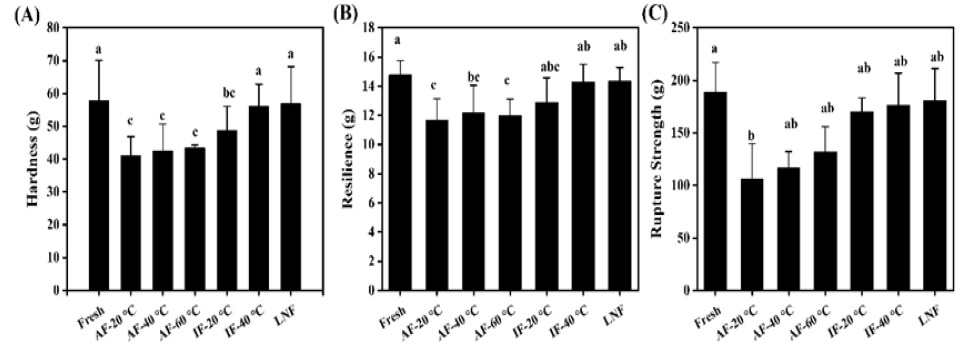
Figure 6: Effect of different freezing methods on Hardness. Note: A) Resilience; B) Rupture strength; C) Beef.
Correlation between ice crystal formation and physicochemical properties
Through correlation analysis, the potential relationship between freezing loss rate, defrosting loss rate, hardness, resilience, rupture strength and equivalent diameter is revealed. As listed in Table 1, the correlation coefficients were all above 0.7, indicating that there was a strong correlation. Meanwhile, the ice crystal equivalent diameter was significantly negatively correlated with hardness, resilience and rupture strength. In general, the diameter of ice crystals in the freezing process had a certain degree of influence on the parameters representing the texture (Table 1).
| Equivalent diameter | Freezing loss rate | Defrosting Loss rate | Hardness | Resilience | Rupture Strength | |
|---|---|---|---|---|---|---|
| Equivalent diameter | 1 | |||||
| Freezing loss rate | 0.77 | 1 | ||||
| Defrosting loss rate | 0.85 | 0.85 | 1 | |||
| Hardness | -0.98** | -0.78 | -0.8 | 1 | ||
| Resilience | -0.96** | -0.81 | -0.79 | 0.99** | 1 | |
| Rupture strength | -0.99** | -0.75 | -0.84 | 0.95** | 0.94** | 1 |
Note: The correlation coefficient is between 0.6-0.8, indicating a strong correlation. (*) the significant difference with P<0.05; (**) the significant difference with P < 0.01.
Table 1: Correlation between ice crystal formation and physicochemical properties——hardness, resilience, and rupture strength.
Conclusion
The freezing process always affects the quality of beef. To reduce the quality deterioration of beef during the freezing process, this paper explored the formation of ice crystals in beef frozen by different methods. Furthermore, the juice loss before and after thawing, the microstructure after thawing, the redistribution of water, and the change of final texture were further studied.
The results demonstrated that the slower the freezing rate, the larger the diameter of ice crystals formed during the freezing process, the more obvious the changes in the physical and chemical properties of beef, and the more the quality decreased. The formation of ice crystals during freezing causes muscle deformation while destroying cell structure and further affecting the moisture composition and texture of beef. Compared to air freezing and immersion freezing, liquid nitrogen freezing exhibited a better effect of maintaining beef quality, suggesting that liquid nitrogen freezing could be a promising alternative to conventional methods for freezing meat. In conclusion, liquid nitrogen freezing is an excellent freezing method with great potential for application in the storage and transportation of frozen meat. In addition, other studies are needed to assess the actual cost and energy consumption of liquid nitrogen freezing.
References
- Xiao-Ling Y, Guang-Hong Z, Xing-Lian X. The freezing methods for meat products during processing. Sci Technol Food Ind. 2006;27(7):199-202.
- Barraza FA, León RA, Álvarez PX. Kinetics of protein and textural changes in Atlantic salmon under frozen storage. Food Chem. 2015;182:120-127.
[Crossref] [Google Scholar] [PubMed]
- Zhou G, Zhang W, Xu X. China's meat industry revolution: Challenges and opportunities for the future. Meat science. 2012;92(3):188-196.
[Crossref] [Google Scholar] [PubMed]
- Xian-Chao F, Zhou G. Effects of fast freezing on the quality and microstructure of beef. J Food Sci, 2016;37(1):1-7.
- Leygonie C, Britz TJ, Hoffman LC. Impact of freezing and thawing on the quality of meat. Meat Sci. 2012;91(2):93-98.
[Crossref] [Google Scholar] [PubMed]
- Jun L, Haixia Y, Shui-Bing Y, Qing J, Juan L, Cheng DK, et al. Effects of cryogenic freezing by liquid nitrogen on the quality and microstructure of silver pomfret (Pampus argenteus). Mod Food Sci Technol. 2015;30;31(4):210-216.
- Teng X, Liu Y, Chen L, Xue C, Li Z. Effects of liquid nitrogen freezing at different temperatures on the quality and flavor of Pacific oyster (Crassostrea gigas). Food Chem. 2023;422:136162.
[Crossref] [Google Scholar] [PubMed]
- Wu G, Yang C, Bruce HL, Roy BC, Li X, Zhang C. Effects of alternating electric field during freezing and thawing on beef quality. Food Chem. 2023;419:135987.
[Crossref] [Google Scholar] [PubMed]
- Diao Y, Cheng X, Wang L, Xia W. Effects of immersion freezing methods on water holding capacity, ice crystals and water migration in grass carp during frozen storage. Int J Refrig. 2021;131:581-591.
- Yang B, Qi ZX, Xu RH, Yang L, Jiang ST, Lu JF, et al. Effect of static magnetic field-assisted freezing on the quality of Ictalurus punctatus. Food Res Dev. 2023;44(6):13-20.
- Li D, Qin N, Zhang L, Li Q, Prinyawiwatkul W, Luo Y. Degradation of adenosine triphosphate, water loss and textural changes in frozen common carp (Cyprinus carpio) fillets during storage at different temperatures. Int J Refrig. 2019;98:294-301.
- Sun Q, Sun F, Xia X, Xu H, Kong B. The comparison of ultrasound-assisted immersion freezing, air freezing and immersion freezing on the muscle quality and physicochemical properties of common carp (Cyprinus carpio) during freezing storage. Ultrason Sonochem. 2019;51:281-291.
[Crossref] [Google Scholar] [PubMed]
- Bertram HC, Purslow PP, Andersen HJ. Relationship between meat structure, water mobility, and distribution: A low-field nuclear magnetic resonance study. J Agric Food Chem. 2002;50(4):824-829.
[Crossref] [Google Scholar] [PubMed]
- Egelandsdal B, Abie SM, Bjarnadottir S, Zhu H, Kolstad H, Bjerke F, et al. Detectability of the degree of freeze damage in meat depends on analytic-tool selection. Meat Sci. 2019;152:8-19.
[Crossref] [Google Scholar] [PubMed]
- Guo-jiao MA, Ya-mei JI, Na YA, Xue-ming XU, Zheng-jun XI. Effect of alternating magnetic field on quality of frozen pork and beef. Food and Machinery. 2021;37(6):140-149.
- Choi YS, Ku SK, Jeong JY, Jeon KH, Kim YB. Changes in ultrastructure and sensory characteristics on electro-magnetic and air blast freezing of beef during frozen storage. Korean J Food Sci An. 2015;35(1):27.
[Crossref] [Google Scholar] [PubMed]
- Ya-Nan X, Li-Juan H, Jie W. The present situation of texture characteristics in beef. Food Res Dev. 2015;36(11):144–148.
- Kiani H, Sun DW. Water crystallization and its importance to freezing of foods: A review. Trends in Food Science and Technology. 2011;22(8):407-426.
- Huan D, JuMei Y, SongLei W, ZhiWu H, Nakano K, Li W, et al. Effect of glass transition temperature on the quality of frozen beef. 2018;44(2):240-246.
Citation: Zhang J, Wen X, Zhang S, Ding H, Xie Y, Wang Z, et al. (2024) Effects of Freezing Methods on the Formation of Ice Crystals and the Physicochemical Properties of Beef. J Food Process Technol. 15:1122.
Copyright: © 2024 Zhang J, et al. This is an open-access article distributed under the terms of the Creative Commons Attribution License, which permits unrestricted use, distribution, and reproduction in any medium, provided the original author and source are credited.
