
Indexed In
- Genamics JournalSeek
- RefSeek
- Hamdard University
- EBSCO A-Z
- OCLC- WorldCat
- Publons
- Euro Pub
- Google Scholar
Useful Links
Share This Page
Journal Flyer

Open Access Journals
- Agri and Aquaculture
- Biochemistry
- Bioinformatics & Systems Biology
- Business & Management
- Chemistry
- Clinical Sciences
- Engineering
- Food & Nutrition
- General Science
- Genetics & Molecular Biology
- Immunology & Microbiology
- Medical Sciences
- Neuroscience & Psychology
- Nursing & Health Care
- Pharmaceutical Sciences
Research Article - (2023) Volume 12, Issue 2
Effective Oil Spill Monitoring Approach over the Gulf of Oman by Using Advanced Machine Learning and Data Mining Tools
Aishah Saeed Jumah Alabdouli, Muhammed Sirajul Huda Kalathingal, Shaher Bano Mirza* and Fouad Lamghari RidouaneReceived: 20-Jan-2023, Manuscript No. SIEC-23-19612; Editor assigned: 23-Jan-2023, Pre QC No. SIEC-23-19612 (PQ); Reviewed: 06-Feb-2023, QC No. SIEC-23-19612; Revised: 14-Feb-2023, Manuscript No. SIEC-23-19612 (R); Published: 23-Feb-2023, DOI: 10.35248/2090-4908.23.12.301
Abstract
Oil spills negatively impact the environment by endangering marine ecosystems, and coastal surroundings. The environmental damage from an oil spill by a tanker, pipeline, or offshore rig can be devastating almost immediately and can last for decades. Consequently, the purpose of this study is to detect oil spills in the Gulf of Oman. To find oil spills, Sentinel-2 spectral imageries are used. Sentinel-2 divides the image into N grids and uses Sentinel-2 band ratio for mapping oil spills to execute instance segmentation using a Yolov7 to accomplish oil spill detection in a single step. In our experiment, the trained Yolov7 instant segmentation model was able to produce exceptionally accurate intersection over union results, correctly identifying 91% of the actual oil spill. These results explain the potential of artificial intelligence and significant impact that can be acquired on environment.
Keywords
Yolov7; Instance segmentation; Intersection over union, Pixels, Oil spills; Remote sensing; Detection
Introduction
When a liquid petroleum hydrocarbon is discharged into the environment, it causes pollution known as an oil spill. Oil spills can have disastrous impacts on civilization in terms of economy, environment, and society. The ecology is seriously endangered by oil spills. More than half of the oil produced worldwide is transported by oil tankers via the Gulf of Oman [1]. There have been a number of oil leaks in the study region over the past few years. Crude oil spills from tankers, offshore platforms, drilling rigs, and wells, along with refined petroleum products (like gasoline and diesel) and their byproducts, heavier fuels used by large ships, such as bunker fuel, or the spill of any oily waste or used oil, are the major causes of oil pollution in the study area [2]. Oil spills can have long-term repercussions that disrupt ecosystems, Food supplies for marine life may become scarcer or of lower quality as a result of oil spills. The marine animals’ immune systems may have been impacted by the oil, making it more difficult for them to fend off illness and infection. Oil has an effect on spawning and reproduction; for instance, it might contaminate bird or turtle nests on the shore, reducing their viability. Furthermore, research on biomarkers has revealed that those who have been exposed to oil and gas spills have suffered permanent injury. These side effects can be divided into liver damage, reproductive harm, immune system deterioration, elevated cancer risk, and higher concentrations of some toxins (hydrocarbons and heavy metals) [3].
Effective monitoring of the Earth’s surface has been made possible by the European Space Agency’s (ESA) and European Union’s (EU) development of the Sentinel-2 multispectral products as a component of the Copernicus Program [4]. Looking at colored patterns at sea level can help visually identify oil in the sea. The reflectance of a Sentinel-2 image was determined through image processing on the Google Earth Engine platform. To obtain a value between 0 and 1, the results were divided and trimmed according to the area of interest. Visually identifying the oil spill is achievable with certain band combinations. The red-green-blue combination exhibits the silvery pattern, however because the silvery pattern is thick, it is difficult to determine its distribution [5].
Instance segmentation model
Instance Segmentation is a specialized form of image segmentation that uses Sentinel-2 satellite photos to find instances of oil spills and demarcate their boundaries. It is crucial for monitoring the effects of oil spills on the environment [6]. Both Fully Convolutional Networks (FCN) and region-based Convolutional Neural Networks (R-CNN) can be used for instance segmentation [7].
The real-time object detection accuracy is significantly increased by Yolov7 without raising inference costs. Generally, Yolov7 offers a quicker and more robust network architecture that offers a more efficient feature integration approach, more precise oil spill detection performance, a more robust loss function, and an improved label assignment and model training efficiency. Object detection models often consider network depth, network width, and network resolution. In Yolov7, the authors scale the depth and width of the network simultaneously while concatenating layers [8].
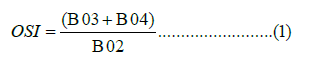
Yolov7 Instance segmentation has lately attracted a lot of interest in a number of oil spill detecting applications [9]. In the range of 5 FPS to 160 FPS, Yolov7 Instance segmentation outperformed all known object detectors in terms of both speed and accuracy, and it has the greatest accuracy of 56.8% AP among all real-time object detectors with 30 FPS or above on GPU V100 [10]. Oil spills over water in a coastal or marine setting can be seen using the Oil Spill Index (OSI), which employs visible Sentinel-2 bands. To distinguish an oil spill, the OSI is made by adding bands that reflect the shoulders of the oil’s absorption characteristics as the numerator and the band that is closest to those features as the denominator [11].
The OSI image can be better visualized using three decor-related spectral bands.
The RGB channel values for the resulting image are as follows
RGB visualization photos from several spills in the Study area were used to train the Yolov7 model.
Materials and Methods
Study area
The Gulf of Oman includes the region that stretches from the Persian Gulf to the Strait of Hormuz, bridging the Arabian Sea and the Strait of Hormuz. The International Hydrographic Organization establishes the following boundaries for the study area, which totals 181,000 km2: A line connecting the Arabian coast’s Ras Limah (25°57’N) to Iran’s Ras al Kuh (25°48’N) in the northwest (Persia). Southeast: Ràs al Hadd, the easternmost point of Arabia (22°32’N), and Ràs Jiyùni, on the coast of Pakistan, form the northern boundary of the Arabian Sea. The study area’s latitude is 24° 43’ 8.39” north and its longitude is 58° 19’ 21.00 east. This area was chosen due to its strategic location, which has made it a crucial international shipping lane for trade between East and West and global oil exports due to its deep-water Max depth: of 3,700 m (12,100 ft) [12]. Several pollutants, including various types of oil spills, are introduced into the Gulf of Mexico through transportation-related operations (Figure 1).

Figure 1: A map of the study area (study area) where the oil leaks were observed.
Data mining: Satellites images over the study area
The Copernicus Open Access Hub’s Sentinel-2 Multi Spectral Instrument (MSI) has been used for this work. Wide-spread, high-resolution, multi-spectral imaging mission SENTINEL-2 supports Copernicus Land Monitoring studies, which include the observation of oil spills from various sources [13]. All of the data collections’ full-resolution photos can be seen in EO Browser for comparison [14-18]. We proceeded to the location of the oil spills, chose the time period we wanted with cloud-free coverage, and looked at the resulting data in the browser.
The Copernicus Open Access Hub database of the European Space Agency (ESA) was used to retrieve photos from the Copernicus Sentinel-2. The images included in the databases were taken by the European Sentinel-2 satellite. We extracted oil spill imagery data from January 2022 to August 2022 for over 100 oil spills in the Gulf of Oman using EO Browser. Sentinel-2 high resolution visible near-infrared shortwave infrared spectral bands were used to create band ratios as mentioned below:
These band ratios are used to identify different oil spills and demonstrate how this method could be applied to map oil spills in the study area. These data undergo preprocessing, which results in Data correlation and de-correlation. We labeled the oil spills with Roboflow tool, then converted the labels to Yolov7 format to segment and detect them. Incorporating the labeled data into the training of the Yolov7 algorithm allowed us to augment and clean the data. The validation process starts once the training has been completed. Furthermore, the validation has been done by the test set (Figure 2).

Figure 2: The flow diagram outlines each step necessary to complete the entire project.
The oil spill event data is compiled from multiple sources. The same data type has also been extracted from Sentinel-2 as imagery data. The preprocessing of those data produces data correlation and de-correlation. Third-party software was used to label the resulting imagery data. The labeling enables us to augment and clean the data for training Yolov7 algorithm. The validation process follows training. The test set has performed the validation.
Results and Discussion
The band ratio, as opposed to the initial data, enables a more accurate evaluation of the outcomes. One spectral band is divided by another to produce an image that displays relative band intensities; the spectral differences between the bands allow for the most thorough analysis of the image’s properties. We have acquired bands 5,6,7,3,4,2,11,12 and 8 from Sentinel 2 that were created using the Oil Spill Index (OSI) equation as shown in (Figure 3).

Figure 3: Images (a), (b), and (c) represent samples of images collected from Copernicus Sentinel-2 utilizing European Space Agency (ESA) databases and converted into Oil Spill Index (OSI) images. The distinct flamingo-colored marks denote the Oil spill area.
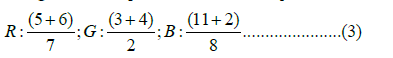
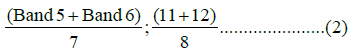
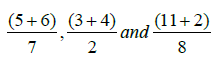
In this equation, we constructed band ratios (5+6)/7, (3+4)/2, (11+12)/8 by adding the bands representing the shoulders of absorption features in the numerator and the band located near the absorption feature in the denominator using the spectral bands of visible-near infrared-shortwave infrared regions of MSI to distinguish the oil spill from the spectral absorption characteristics of Sentinel-2 bands.
RGB (Red, Green and Blue) is a color-representation scheme utilized in oil spill photographs. Red, green, and blue can be blended in varying quantities to produce any visible spectrum hue. The result of dividing one spectral band by another is an image with relative band intensities; spectral differences across bands allow us to perceive the image’s characteristics most accurately. The ratio (3+4)/2 was produced using visible bands to enhance the spectral response of the oil spill over the image, the ratio (5+6)/7 was made using NIR bands to display the flora, and the ratio (11+12)/8 was constructed using SWIR bands to display the lithological.
Better outcomes from satellite photos are obtained using instance segmentation, which employs a network design. The same pixel can have various semantics in different regions, which means that Semantic Segmentation must function on the region level in order for instance segmentation to be effective. This cannot be modeled by a single FCN on a single image.
Yolov7 divides the image into N grids before performing oil spill detection in a single step. These areas are used to identify and pinpoint any spills that might be contained inside them.
Ablation investigations show that this method preserves the optimum state of the model architecture when scaling for different sizes. The image on Yolov7 is divided into an S × S grid by the system. These grid cells each anticipate B bounding boxes and their associated confidence scores (Figure 4). The confidence score reveals the model’s level of assurance that the box contains an item as well as how accurate it believes the box to be at predicting. The test set was composed of imagery data from 14 events. The trained algorithm has correctly predicted the Oil spill with confidence score of 0.48 to 0.60 (Figure 4 (a): predicted). Similarly, the analysis showed the accurate prediction of the event in Figure 4; (b) and (c) with the confidence score of 0.54 and 0.56, respectively. However, the Figure 4 (d) shows the false positive with predicted two values with low confidence score.

Figure 4: Representation of resulting final output validation where actual event form imagery data is compared with the predicted event with confidence score associated with each area. The image (a) (b) through (c) represents a positive event, whereas (d) represents a false positive.
Overall, the trained Yolov7 instant segmentation model could generate extremely accurate intersection over union segments, properly classifying 91% of the oil spill pixels and 3% of the non- spill images.
The model trained unit for the training box loss of 0.05012 (Figure 5). The validation loss of 0.04581 for the training set loss (Figure 6). The training box loss is a measurement of how accurately the model locates the object’s boundary and the point halfway between its extremes (Figure 5). The confidence score is a measurement of the likelihood that the object can be found in the location that was predicted. The segment loss provides an insight of how well the model can divide the pixels into the appropriate labels (Figure 6). The model gradually became better in terms of cutting down on losses until it reached a plateau after roughly one hundred iterations. In order to get the finest possible model weights, the early halting mechanism is utilized.

Figure 5: The model trained unit for the training box loss. It shows the training box loss, a measure of the model’s precision in identifying the
object’s boundary and the midpoint. Note: ( ) train/box_loss, (
 ) val/box_loss.

Figure 6: The model trained unit for the training segmentation loss. The segment loss reveals how accurately the model classifies pixels into
their respective labels. Note: () train/box_loss, () val/box_loss.
Conclusion
Oil spill detection is challenging in the Study region due to the complicated water, shallow depth, and murky atmosphere. A better segmentation method and careful processing of the satellite photos are required to improve the region’s ability to detect oil spills. The data from the Study area were used to assess the oil spill, and photos from sentinel-2 satellites were utilized to calculate the Oil Spill Index (OSI). This work demonstrates that Yolov7 rapid segmentation may be utilized to detect oil spills in sentinel-2 photos by training the Yolov7 deep learning model on OSI-labeled data and achieving positive result.
References
- Shivaprasad P. A Comprehensive Guide to Object Detection Using YOLO Framework-Part I. 2019.
- Jernelöv A. The threats from oil spills: now, then, and in the future. Ambio. 2010;39(5):353-366.
[Crossref] [Google Scholar] [Pubmed]
- Webb J. What Do We Know About How Oil Spills Affect Human Health? Not Enough. 2018.
- Phiri D, Simwanda M, Salekin S, Nyirenda VR, Murayama Y, Ranagalage M. Sentinel-2 data for land cover/use mapping: a review. Remote Sens. 2020;12(14):2291.
- Afgatiani PM, Putri FA, Suhadha AG, Ibrahim A. Determination of Sentinel-2 spectral reflectance to detect oil spill on the sea surface. J Environ Sustain. 2020;4(3):144-154.
- Zubair Hassan. Instance Segmentation Vs. Object Detection: 3 Things You Need To Know. 2022.
- Hmrishav Bandyopadhyay. The Definitive Guide to Instance Segmentation. 2022.
- Jacob Solawetz. YOLOv7 Breakdown. 2022.
- Mohamed E, Shaker A, El-Sallab A, Hadhoud M. Insta-yolo: Real-time instance segmentation. 2021.
- Wang CY, Bochkovskiy A, Liao HY. YOLOv7: Trainable bag-of-freebies sets new state-of-the-art for real-time object detectors. 2022.
- Rajendran S, Sadooni FN, Al-Kuwari HA, Oleg A, Govil H, Nasir S, et al. Monitoring oil spill in Norilsk, Russia using satellite data. Sci Rep. 2021;11(1):1-20..
[Crossref] [Google Scholar] [Pubmed]
- Sana A. Measurement of oil-related pollution in the coastal region of Sultanate of Oman. In Proceedings of OCEANS 2005 MTS/IEEE.2005: 394-397.
- Copernicus. Sentinel-2 MSI User Guide. 2022.
- Rajendran S, Vethamony P, Sadooni FN, Al-Kuwari HA, Al-Khayat JA, Govil H, et al. Sentinel-2 image transformation methods for mapping oil spill–A case study with Wakashio oil spill in the Indian Ocean, off Mauritius. MethodsX. 2021;8:101327.
[Crossref] [Google Scholar] [Pubmed]
- Rashed F, Alhefeiti MO, Mirza SB. “Investigation of the spatiotemporal changes in the vegetation of the emirates of Fujairah using normalized difference vegetation index (NDVI) and geographical information system (GIS)”. Eur J. Biotechnol. Biosci. 2022;10(2):84-89.
- Aldhanhani ASS, Kalathingal MSH, Mirza SB, Ridouane FL. “Efficient comprehension of weather pattern from the meteorological dataset acquired from airport sectors of Fujairah, UAE, using machine learning and data mining approaches”. Int. J. Adv. Eng. Technol.. 2023;7(1):1-4.
- Rashed F, Alhefeiti MO, Alblooshi MAM, Abdalla YYA, Kalathingal MSH, Mirza SB, et al. “Investigation of the effects of heavy rain and flood in emirates of fujairah-uae and construction and compilation of flood map and elevation chart using state of the art gis technologies”. Int J Dev Res. 2022;12(9):58827–58831.
- Al Dahmani WSOF, Mirza SB, Kalathingal MSH, Ridouane FL. “Macro-mineral concentration analysis of Acacia ehrenbergiana (Salam) from the origin of Fujairah, UAE with staple food items as a mineral rich dietary supplement for arid and semi-arid lands of the world.” Adv Life Sci. 2022;9(3).
Citation: Alabdouli ASJ, Kalathingal MSH, Mirza SB, Ridouane FL (2023) Effective Oil Spill Monitoring Approach over the Gulf of Oman by Using Advanced Machine Learning and Data Mining Tools. Int J Swarm Evol Comput. 12:276
Copyright: © 2023 Alabdouli ASJ, et al. This is an open-access article distributed under the terms of the Creative Commons Attribution License, which permits unrestricted use, distribution, and reproduction in any medium, provided the original author and source are credited.