Indexed In
- Genamics JournalSeek
- Academic Keys
- JournalTOCs
- China National Knowledge Infrastructure (CNKI)
- Access to Global Online Research in Agriculture (AGORA)
- Centre for Agriculture and Biosciences International (CABI)
- RefSeek
- Directory of Research Journal Indexing (DRJI)
- Hamdard University
- EBSCO A-Z
- OCLC- WorldCat
- Scholarsteer
- SWB online catalog
- Publons
- Euro Pub
- Google Scholar
Useful Links
Share This Page
Journal Flyer
Open Access Journals
- Agri and Aquaculture
- Biochemistry
- Bioinformatics & Systems Biology
- Business & Management
- Chemistry
- Clinical Sciences
- Engineering
- Food & Nutrition
- General Science
- Genetics & Molecular Biology
- Immunology & Microbiology
- Medical Sciences
- Neuroscience & Psychology
- Nursing & Health Care
- Pharmaceutical Sciences
Research Article - (2013) Volume 4, Issue 9
Effect of Packaging Materials on Quality Characteristics of Osmotically Pretreated Microwave Assisted Dried Sweet Pepper (Capsicum annum L.)
Abstract
The present study was under taken to investigate the effect of packaging materials and storage conditions on quality of capsicum (red and yellow) dried using microwave drying. The samples were heat sealed and packaged in: polypropylene (PP), Laminated Aluminum (Al) and High density polyethylene (HDPE). Then, these were stored at ambient atmosphere for four month and at every fifteen days, the quality parameters such as browning index (BI), total color difference (TCD), water activity (Aw), moisture content (MC), total carotenoid (Tc) and Sensory Score (SS) were measured. The result indicated that storage period had significant effect (P<0.05) on response variables after 45-60 days of storage except sensory score. Laminated Aluminum (Al) was least affected by the ambient environment followed by HDPE and PP having low water vapor transmission rate (WVTR).
Keywords: Browning index (BI); Total color difference (TCD); Water activity (Aw)
Introduction
Dehydrated fruits and vegetables are used either as food products or as industrial ingredients in the processing of various foods, such as bakery products, soups, instant fruit powders, etc. The success of most preservation methods depends on how well the processed food is protected from adverse environmental conditions, which is mostly accomplished by packaging. There is a growing pressure in the fruits and vegetables packaging sector to use effective packaging materials with the aim of enhancing the shelf-life. Packaging plays an important role in determining the stability of foods by influencing those factors which cause or contribute to food deterioration during storage. The nature of a package determines the composition of air inside the package, which in turn is known to affect the rate and extent of nutrient loss and microbial activity among other things. According to Jaya and Das [1], powdered dehydrated products require protection against ingress of moisture, oxygen and the loss of volatile flavorings and color. During storage and distribution and as a consequence, foods may be altered to such an extent that they are either rejected by the consumer or they may become harmful to the person consuming them. According to Brown and Williams [2], shelf life testing is carried out by holding representative samples of the final product under conditions likely to mimic those that the product will encounter from manufacturer to consumption. It is a complex concept that is dependent on the nature of food product under consideration, the preservation technologies applied, and the environmental conditions to which the food product is exposed. Potter [3] reported that accelerated storage involving high humidity and temperature such as 90% relative humidity (RH) and 38 ± 2°C can be used for developing moisture ingress and storage time relationships quickly. Storage studies on mango powder have been reported extensively by some researchers. Kumar and Mishra [4] investigated the stability of mango soy fortified yoghurt powder in aluminium laminated polyethylene (ALP) and high-density polypropylene (HDPP) pouches under accelerated storage conditions (38 ± 1°C, 90% RH). Jaya and Das [1] predicted the shelf life of mango powder packaged in aluminium foil-laminated pouches stored under an accelerated storage environment (38 ± 2°C and 90% RH). Packaging is therefore supposed to provide the correct environmental conditions for shelf-life extension of foods, and as such, needs far greater thought and care than is customarily realized. Characteristics of the packaging materials such as mechanical and barrier properties are very important to decide on what type of material will be used in the packaging of different types of foods. Different studied have been reported for storage stability of fruits and vegetables such as Okra [5]; mushroom [6]; Tomata powder [7]; Paprika [8]; Walnut [9].
Dried capsicum has become a standard ingredient used as flavor additive in a wide variety of processed foods such as ketchup, sauces, soups, salad dressings, sausage and meat products, potato chips, crackers and other snack items. Because of its high coloring ability, and in some cases its peculiar pungency, it is used to modify the color and flavor of soups, stews, sausage, cheese, snacks, salad dressing, sauces, pizza, and confectionary products. Carotenoids present in peppers are predominantly pro-vitamin A (a- and b-carotene and b-cryptoxanthin) and xanthophylls, the oxygenated carotenoids [10]. These fat-soluble compounds show potential action against certain cancers, prevent gastric ulcer, stimulate the immune system, prevent cardiovascular diseases and protect against age-related macular degeneration and cataracts [11]. Hence, Packaging materials used for adequate storage of dried capsicum is a requisite now-a-days with industrial importance for developing nutraceutical compounds from capsicum. Moreover, no study has been done for packaging of microwave assisted drying of capsicum powder. Therefore, a study was undertaken to reveal best packaging material for storage of capsicum powder with the aim of little reduction of essential quality parameters.
Materials and Methods
Material
Fresh sweet peppers of yellow and red colors were procured from the Center for Protected Cultivation Technology, Indian Agricultural Research institute, New Delhi. The samples were washed and stored at 7 ± 0.5°C in the refrigerated storage until analysis. Before drying the pepper samples were removed from the cold storage and sliced to Jalapeno type of uniform size of 60 (L) × 6(B) × 4(W) mm3. Initial moisture content was measured by taking 30 g samples, dried in an oven at 70°C for 24 h [12] which was calculated as 89.01 ± 0.45% (w. b.).
Pretreatment
The samples were osmotically dehydrated using parameters, such as salt, sucrose, RPM (rotation per minute), solution to sample ratio (SSR) and time, inside the incubator shaker by using Central Composite Rotatable Design (CCRD). These were optimized based on our objective requirements of weight loss, moisture loss and solid gain, and the optimized dehydrated samples containing moisture content of 71.29 ± 0.65% (w.b) was taken for microwave drying.
Drying equipment and drying method
Drying experiments were performed in a laboratory scale microwave-convective dryer available in the Division of Post Harvest Technology, Indian Agricultural Research Institute, New Delhi. The microwave oven (WP700L17.3 MW Oven, LG make, 17 L Capacity) with technical features of ˜230 V, 50 Hz, and 700 W with a frequency of 2450 MHz has the dimensions of 295, 458 and 370 mm and consisted of a turn table of 270 mm diameter at the base of the oven. The combined microwave-hot air drying experiments were thus conducted with continuous microwave power of 280 W and step down intervals of 70 W, in conjunction with hot air at 30, 45 and 60°C temperatures at constant air velocity of 1.5 m/s.
200 g of osmotically dehydrated yellow sweet pepper was arranged in a single layer on the rotating glass plate and placed in the centre of the oven and the drying process was started for different combinations of microwave power and air temperature. Drying process continued until the moisture content of samples fell down to about 6 % (w. b). All weighing processes were completed in <10 s during the drying process. The samples were optimized based on quality characteristics and the optimized samples were used for storage study.
Storage study
The optimized samples were heat sealed and packaged in: (a) polypropylene (PP) (b), Laminated Aluminum (Al), and (c) High density polyethylene (HDPE). The thickness of LDPE and HDPE is 400 and 700 gauge respectively. However, Laminated Al foil is a coextruded product which consists of inner LDPE, middle aluminium layer and outer polyster layer. Then, these were stored at ambient atmosphere for four month (May to August) with average minimum and maximum temperature and relative humidity ranged from 21.7 to 44.7°C and 48.2% to 67.3% respectively and at every fifteen days intervals the quality parameters such as browning index (BI), total color difference (TCD), water activity (Aw), moisture content (M.C), total carotenoid (Tc) and Sensory Score (SS) were measured. These responses were analyses using Repeated GLM procedure of SAS 9.1.
Color measurement
Color measurements of the capsicum slices were carried out using a Hunter-Lab Colorimeter (Miniscan® XE Plus 4500 L). The instrument (45°/0° geometry, D 65 optical sensor, 10° observer) was calibrated with black and white reference tiles through the tri-stimulus values X, Y, Z, taking as standard values those of the white background (X=79.01; Y=83.96; Z=86.76)tile. The color values were expressed as L (whiteness or brightness/darkness), a (redness/greenness) and b (yellowness/blueness) at any time respectively. A glass cell containing the MW treated samples was placed above the light source and postprocessing L, a, b values were recorded. Color measurements were taken in triplicate and average values were taken for calculation.
Kinetic consideration
To determine the reaction order of total color change due to heat exposure, color change was assumed to be a single entity. The following equations were used to represent the reaction rate:
 (1)
(1)
Where, C is the measured Hunter color scale value or a combination of Hunter color scale values; t is the heating time; k is the rate constant for color degradation; and n is the order of reaction rate with respect to time. Change in total color of capsicum was determined using a differential method.
If color change due to heating follows zero order kinetics (n=0) and first-order kinetics (n = l), equation (1) can be rearranged.
 (2)
(2)
 (3)
(3)
Where, (+) and (-) indicate formation and degradation of any quality parameter, respectively.
Browning index (BI)
It represents the purity of brown color and is reported as an important parameter in drying processes where enzymatic and nonenzymatic browning takes place [13,14]. It is given by the formula [13].
 (4)
(4)
Total color difference (TCD)
It indicates the degree of overall color change of a sample in comparison to color values of an ideal sample having color values of Lo, ao and bo, is given by the formula:
 (5)
(5)
Where, L0, a0 and b0 represented the reading at time zero, and L, aand b-value represented the instantaneous individual readings during thermal treatment
Total carotenoid
It is that constituent which recognizes the consumer’s acceptability of the product on the basis of respective judgments of color. It was measured by a modified method of one described by Rangana. A known weight of the sample was ground with acetone in a pestle and mortar. The extract was decanted in to a conical flask and continued till the residue was colorless. The collected extracts were then transferred in to a separating funnel and 25 to 30 ml of stabilized petroleum ether containing 0.1% BHT was added with 5-10 ml of 5 percent sodium sulphate. Petroleum ether was repeatedly used until all the color got transferred in to a petroleum ether layer. It was transferred into a volumetric flask and the volume was made up to 50 ml with the petroleum ether. Absorbance was measured at 450 nm using ether as blank.
 (6)
(6)
Rehydration ratio
To account for the ability of the sample to absorb water and return to its original shape and appearance was determined by performing rehydration tests on 5 g of the dehydrated sample. Each sample was immersed inside a beaker containing 200 ml of water at 50°C, placed over constant temperature hot water bath with a time period of 30 min. Excess water was removed using a filter paper and observations were performed every 10 minutes until no significant changes in the final weight of the samples were attained.
 (7)
(7)
Total soluble solid (TSS)
It was measured by using digital refractometer (Model 100 H, Synchrony, India)
Water activity (Aw)
It was measured by using water activity meter (Aqualab instruments, USA).
Results and Discussions
The details of physicochemical and sensory quality changes during storage were observed at every fifteen days intervals. The responses were analyses using Repeated GLM procedure of SAS 9.1 and the results of ANOVA are analyzed (Table 1 and 2) and also the mean value of each response variable at every fifteen days of storage were shown (Table 3 to 8).
| F Value | ||||||||
|---|---|---|---|---|---|---|---|---|
| Response | 15 | 30 | 45 | 60 | 75 | 90 | 105 | 120 |
| BI | 8.50** | 5.86** | 30.96** | 17.11*** | 17.11*** | 43.75*** | 42.86*** | 47.64*** |
| TCD | 2.86 | 4.35 | 7.60** | 15.71*** | 18.04*** | 32.96*** | 53.14*** | 36.75*** |
| M.C | ------ | 3.53 | 7.77** | 3.58** | 27.46*** | 32.95*** | 26.83*** | 7.05** |
| Aw | ------- | 1.66 | 4.91 | 7.52** | 7.11** | 28.80*** | 26.35*** | 23.82*** |
| Tc | 1.48 | 1.32 | 6.45** | 21.03** | 36.04*** | 78.29*** | 46.58*** | 126.52*** |
| SS | ----- | ---- | ------- | 1.00 | 1.50 | 0.50 | ------- | 0.50 |
Table 1: ANOVA for different models for red capsicum.
| F Value | ||||||||
|---|---|---|---|---|---|---|---|---|
| Response | 15 | 30 | 45 | 60 | 75 | 90 | 105 | 120 |
| BI | 2.03 | 0.73 | 1.18 | 3.29 | 4.68 | 15.45*** | 16.68*** | 61.24*** |
| TCD | 0.87 | 1.49 | 1.11 | 1.78 | 9.47** | 30.82*** | 34.79*** | 101.89*** |
| M.C | 1.00 | 0.99 | 6.71** | 3.53** | 18.02*** | 6.11** | 6.82** | 14.36*** |
| Aw | 1.00 | 1.97 | 3.34 | 6.21** | 50.71** | 9.46** | 5.80** | 149.68*** |
| Tc | 1.51 | 0.03 | 19.45*** | 29.051*** | 46.60*** | 26.97*** | 13.10*** | 10.42*** |
| SS | ----- | ---- | ------- | ------- | 0.50 | 0.50 | ----- | -------- |
Table 2: ANOVA for different models for yellow capsicum.
Browning index (BI)
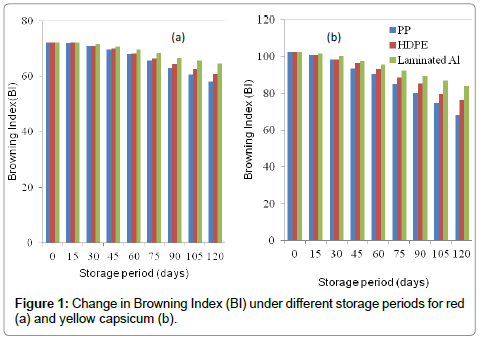
Browning Index decreased from 72.108 to 64.58. This indicated that for the entire storage period of four month (May to August), the ambient temperature were sufficient for the loss in ‘L’, and ‘b’ values of the capsicum slices. From ANOVA (Table 1), it is observed that BI was significant at 5% level (P<0.05) for the time period between 15 and 45 days after which it was significant at 1% level (P<0.001) from 45 to 120 days. But in case of yellow capsicum (Table 2), BI was non-significant till 75 days of storage after which it was significant at 1% level (P<0.001) between 75 and 120 days. Thus, it can be concluded that red capsicum was more stable inside all three packaging materials as is also evident from the mean values (Table 3) where these values are less than the critical values at 5% levels (P<0.05) causing non-significant effect. The reason for decrease in browning index may be due to change in water-vapor transmitivity of packaging materials with the increase in relative humidity of air by which the color pigments were subjected to losses in their brightness (L-Value), yellowness (b-Value) and redness (a-Value). From figure 1, it is found that up to 15 days of storage, no change occurred to the BI values in all three packages. Over the entire storage period, browning index was subjected minimum change to the sample packaged in laminated aluminium (Al) followed by HDPE and PP but both HDPE and Al had not significant effect on the decrease in the BI.
Packages⇨ Time⇩ |
Red Capsicum | Yellow Capsicum | ||||||
|---|---|---|---|---|---|---|---|---|
| PP | HDPE | Al | C.D* | PP | HDPE | Al | C.D* | |
| 15 | 100.706a | 100.773a | 101.213a | 0.736 | 72.108a | 72.062a | 71.9767a | 0.161 |
| 30 | 98.280b | 98.407b | 100.347 | 1.656 | 70.9333b | 71.023b | 71.583b | 1.431 |
| 45 | 93.376 | 96.296c | 97.47c | 1.310 | 69.55 | 69.927c | 70.747c | 1.947 |
| 60 | 90.310 | 93.097 | 95.673 | 2.743 | 65.953 | 68.143d | 69.483d | 1.590 |
| 75 | 84.963 | 88.591e | 92.483e | 3.140 | 64.633 | 66.43e | 68.283e | 2.775 |
| 90 | 80.363 | 85.323f | 89.376f | 4.361 | 62.917 | 64.367f | 66.573f | 1.621 |
| 105 | 74.797 | 80.601g | 84.807g | 5.195 | 60.767 | 62.187g | 65.593g | 2.071 |
| 120 | 68.057 | 76.367h | 80.963h | 4.178 | 57.096 | 60.933 | 63.696 | 3.027 |
Table 3: Mean Values of Browning Index (BI) at different storage period.
Total color difference (TCD)
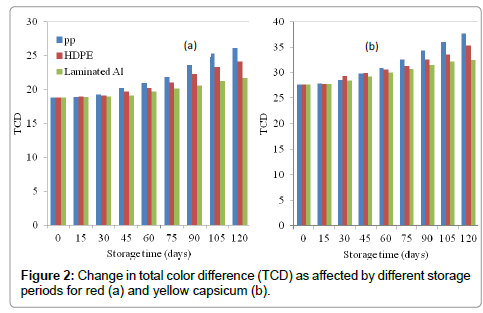
Color is an important attribute because it is usually the first property the consumer observes. Retention of food color after thermal processing may be used to predict the extent of quality deterioration of food resulting from exposure to heat [15]. TCD increased from 18.82 to 26.44 and from 27.64 to 37.56 for red and yellow capsicum respectively. It is observed that after 45 days of storage, packaging materials had significant effect at 5% level (P<0.05) on total color change for red capsicum (Table 4), after which only PP had significant (P<0.001) impact on the change in BI. But for yellow capsicum, packaging materials had non-significant effect up to 60 days, after which there were significant changes at 1% level (P<0.001). Thus, as expected longer storage period had greater effect on TCD of dried capsicum slices. Again, red capsicum could be safely packaged in HDPE and laminated Al foil up to 120 days because of non-significant difference between them (Table 4). However, it could be store up to 105 days for yellow capsicum. Hence, it may be concluded that red capsicum was more stable inside three packages in comparison to yellow capsicum. Figures 2 and 3 shows the pattern of change in color of dried samples. It is observed that TCD was least affected by aluminium (Al) laminates followed by high density polyethylene (HDPE) and polypropylene (PP).
Packages ⇨ Time ⇩ |
Red Capsicum | Yellow Capsicum | ||||||
|---|---|---|---|---|---|---|---|---|
| PP | HDPE | Al | C.D* | PP | Al | HDPE | C.D* | |
| 15 | 18.917a | 18.993a | 18.883a | 0.115 | 27.893a | 27.77a | 27.78a | 0.253 |
| 30 | 19.24b | 19.127b | 18.973b | 1.222 | 28.563b | 29.34b | 28.45b | 1.386 |
| 45 | 20.207c | 19.7067c | 19.150c | 1.663 | 29.77c | 29.87c | 29.23c | 1.067 |
| 60 | 20.94 | 20.193d | 19.721d | 0.537 | 30.903d | 30.62d | 29.98d | 1.229 |
| 75 | 21.817 | 21.073e | 20.167e | 1.681 | 32.5767 | 31.34e | 30.693e | 1.075 |
| 90 | 23.543 | 22.243f | 20.590f | 2.817 | 34.34 | 32.53f | 31.487f | 2.496 |
| 105 | 25.247 | 23.37g | 21.307g | 1.838 | 36.063 | 33.67g | 32.12g | 1.867 |
| 120 | 26.083 | 24.133h | 21.633h | 1.464 | 37.643 | 35.28 | 32.48 | 0.886 |
Table 4: Mean Values of Total Color Difference (TCD) at different storage period.
Moisture content
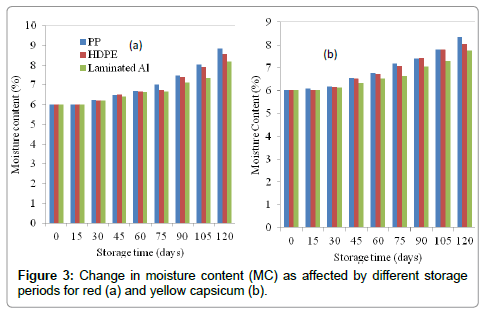
When food product is exposed to an environment above or below this equilibrium point, the protective packages and its barrier level will determine how much the food will be impacted [16]. Moisture content increased from 6.021 to 9.163% and from 6.021 to 8.423% for yellow and red capsicum respectively. This indicated that for the entire storage period of four month, only a slight increase in moisture content occurred. From ANOVA (Table 1 and 2), it is observed that MC was significant at 5% level (P<0.05) after 45 days of storage for both colors. So, the products could be stored in any one of the packaging materials up to 45 days. The moisture content of dried capsicum slices packaged in polypropylene (PP) increased more followed by HDPE and laminated aluminium foil (Figure 3) due to the high rate of migration of water vapor from the storage environment into the packaging material. This finding is in agreement with the work done on mango [4]. They reported that the moisture content of mango soy fortified yoghurt powder during accelerated storage (38 ± 1°C and 90 ± 1% RH) gradually increased when packaged in high-density polypropylene (HDPP) and ALP. Here, it did not show any appreciable change in moisture content due to low water vapor transmission rate (WVTR) compared to multilayer HDPE film which is in agreement with the available literature on anchoviella [17]. The results indicated that temperature, RH and packaging material affected the adsorbed moisture of capsicum. Here, red capsicum was more stable inside all three packaging materials as also evident from the mean values (Table 5) where these values are less than the critical values at 5% levels (P<0.05) causing non-significant effect. The reason may be due to change in oxygen and water vapor transmitivity of packaging materials.
Packages ⇨ Time ⇩ |
Red Capsicum | Yellow Capsicum | ||||||
|---|---|---|---|---|---|---|---|---|
| PP | HDPE | Al | C.D* | PP | HDPE | Al | C.D* | |
| 15 | 6.021a | 6.021a | 6.021a | 0.000 | 6.033a | 6.021a | 6.021a | 0.110 |
| 30 | 6.224b | 6.223b | 6.218b | 0.004 | 6.19b | 6.167 b | 6.141b | 0.085 |
| 45 | 6.383c | 6.507c | 6.427c | 0.193 | 6.573c | 6.547 c | 6.317c | 0.189 |
| 60 | 6.697 | 6.673d | 6.633d | 0.051 | 6.763 | 6.723d | 6.543 d | 0.213 |
| 75 | 7.017 | 6.756e | 6.671e | 0.119 | 7.186 | 7.07e | 6.642e | 0.233 |
| 90 | 7.483 | 7.403f | 7.147f | 0.106 | 7.418 | 7.323 f | 7.051f | 0.299 |
| 105 | 8.034 | 7.529g | 7.347g | 0.247 | 7.799 | 7.793g | 7.547g | 0.383 |
| 120 | 8.854 | 8.263h | 8.107h | 0.435 | 8.327 | 8.023h | 7.743h | 0.268 |
Table 5: Mean Values of moisture content at different storage period.
Water activity (Aw)
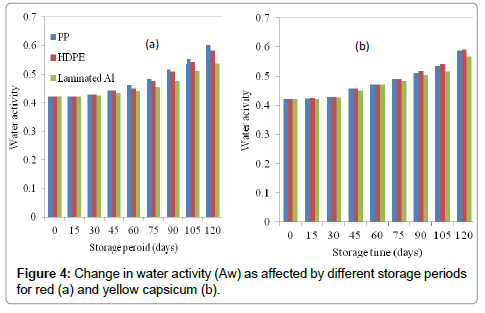
Water activity is directly proportional to moisture content [18]. It increased from 0.422 to 0.611 and from 0.422 to 0.596 for yellow and red capsicum respectively. This indicated that for the entire storage period, only a slight increase in water activity was found. From ANOVA (Table 1 and 2), it is observed that Aw was significant at 5% level (P<0.05) after 60 days of storage for both colors. So, the products could be safely stored for 60 days after which increase in its value may result into attacked by micro-organism. Aw of dried capsicum slices packaged in polypropylene (PP) increased more followed by HDPE and laminated aluminium foil, similar to that of moisture content (Figure 4) due to the high rate of migration of water vapor from the storage environment into the packaging material. From mean value (Table 6), it is found that aluminium foil and HDPE have non-significant effect on water activity for the entire storage period for both red and yellow capsicum. Hence, either of them could be selected for safe storage on comparison to HDPE where a significant difference has found at 120 days.
Packages⇨ Time⇩ |
Red Capsicum | Yellow Capsicum | ||||||
|---|---|---|---|---|---|---|---|---|
| PP | HDPE | Al | C.D* | PP | HDPE | HDPE | C.D* | |
| 15 | 0.422a | 0.422a | 0.422a | 0.000 | 0.422a | 0.422a | 0.422a | 0.000 |
| 30 | 0.4297b | 0.428b | 0.424b | 0.007 | 0.429b | 0.427b | 0.425b | 0.004 |
| 45 | 0.443c | 0.442c | 0.432 | 0.009 | 0.457 | 0.448c | 0.4393c | 0.012 |
| 60 | 0.4613d | 0.450d | 0.440 | 0.013 | 0.472d | 0.467d | 0.455 | 0.016 |
| 75 | 0.482e | 0.475e | 0.453 | 0.019 | 0.490e | 0.484e | 0.463 | 0.007 |
| 90 | 0.515f | 0.509f | 0.475 | 0.014 | 0.512f | 0.503f | 0.477 | 0.020 |
| 105 | 0.553g | 0.542g | 0.511 | 0.014 | 0.534g | 0.519g | 0.483 | 0.032 |
| 120 | 0.601h | 0.583h | 0.536 | 0.023 | 0.589 | 0.5673 | 0.502 | 0.012 |
Table 6: Mean Values of water activity at different storage period.
Total carotenoid (Tc)
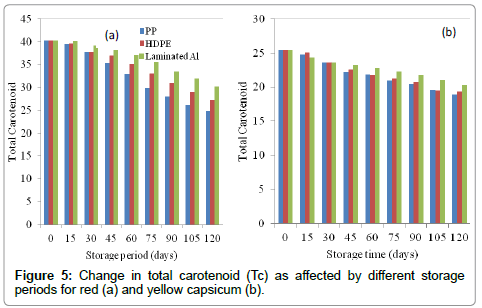
Total carotenoid decreased from 40.21 to 24.53 mg/100gm and from 25.42 to 18.46 mg/100gm for red and yellow capsicum respectively. It was observed that after 45 days of storage, packaging materials had significant effect at 5% level (P<0.05) on total carotenoid change for red capsicum (Table 1), after which it was significant at 1% level (P<0.001) up to 120 days of storage. But for yellow capsicum, it had significant effect at 1% level (P<0.001) after 45 days. Hence, it may be concluded that later had greater effect on Tc reduction owing to its high significance level. From mean values (Table 7), it is found that up to 60 and 75 days, packaging materials had non-significant difference on the TC having critical difference (CD) values less than corresponding mean value for each packaging materials for red and yellow capsicum. So, anyone of them could be selected for safe storage of product for both colors. When stored for 120 days, it is observed that in case of red capsicum, laminate aluminium (Al) was the best packaging material followed by HDPE and PP. But for yellow capsicum, apart from selecting HDPE, both PP and Al could be selected because of low mean value difference than critical difference (CD) at 5% level. Figure 5 shows the change in total carotenoid in the dried samples during storage. It is observed that it was least affected by laminated aluminium (Al) followed by high density polyethylene (HDPE) and polypropylene (PP). The reason may be the low transmitivity of light through the laminated aluminium foil causing less reduction to the photo degradable carotenoid pigments.
Packages⇨ Time⇩ |
Red Capsicum | Yellow Capsicum | ||||||
|---|---|---|---|---|---|---|---|---|
| PP | HDPE | Al | C.D* | PP | HDPE | Al | C.D* | |
| 15 | 40.21a | 40.21a | 40.21a | 0.00 | 25.42a | 25.42a | 25.42a | 0.00 |
| 30 | 37.707c | 37.767c | 39.113 | 0.854 | 24.72b | 25.067b | 24.36b | 0.993 |
| 45 | 35.403c | 36.977c | 38.113c | 2.978 | 23.61c | 23.64c | 23.837c | 0.352 |
| 60 | 32.907d | 35.057d | 37.037d | 2.853 | 22.213d | 22.97d | 23.001d | 0.393 |
| 75 | 29.837 | 32.977e | 34.053e | 1.558 | 21.78e | 21.76e | 22.767e | 0.366 |
| 90 | 28.033 | 31.933f | 33.521f | 1.678 | 20.957 | 21.19f | 21.627f | 0.754 |
| 105 | 26.146 | 28.976g | 32.860g | 1.073 | 20.383 | 20.702g | 21.743g | 0.474 |
| 120 | 24.860 | 27.230 | 30.190 | 1.474 | 19.553 | 19.227h | 21.083h | 0.847 |
Table 7: Mean Values of total carotenoid at different storage period.
Sensory score (SS)
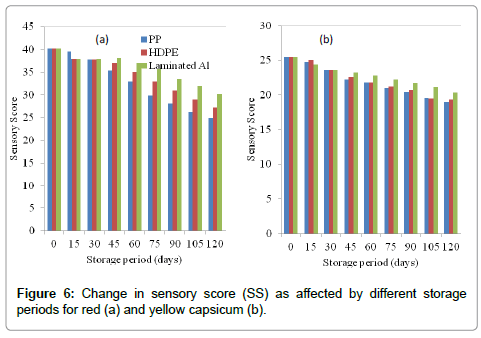
Shelf life refers to the end of consumer acceptability, and is the time at which majority of consumers are displeased with the product [19]. Dried Capsicum slices were analyzed for its sensory qualities during storage by untrained panellists using 9.0 hedonic scale for overall acceptability. Hedonic testing is of limited use in shelf life evaluation but is commonly used. According to Griffiths [20], significant changes in descriptive rating does not necessary translate to significant difference in acceptability, suggesting a conflict between statistical and commercial significance. Here, the sensor score varied between 7 and 8 for both red and yellow capsicum. This indicated that overall acceptability did not change significantly in the entire storage period. From ANOVA (Table 1 and 2), a non-significant change in the sensory score as also evident from mean values (Table 8) where mean values difference always less than corresponding critical values (CD) at 5% ( P< 0.05) for each packaging material (Figure 6).
| Packages⇨ Time⇩ | Red Capsicum | Yellow Capsicum | ||||||
|---|---|---|---|---|---|---|---|---|
| PP | HDPE | Al | C.D* | PP | Al foil | HDPE | C.D* | |
| 15 | 8a | 8a | 8a | 0.00 | 8a | 8a | 8a | 0.00 |
| 30 | 8a | 8a | 8a | 0.00 | 8a | 8a | 8a | 0.00 |
| 45 | 8a | 8a | 8a | 0.00 | 8a | 8a | 8a | 0.00 |
| 60 | 8a | 8a | 7.667a | 0.666 | 8a | 8a | 8a | 0.00 |
| 75 | 8a | 7.667a | 7.333a | 0.941 | 8a | 8a | 8a | 0.00 |
| 90 | 7.333a | 7a | 7a | 0.941 | 7.333a | 7.333a | 7.0a | 0.941 |
| 105 | 7a | 7a | 7a | 0.00 | 7a | 7a | 7a | 0.00 |
| 120 | 7.333a | 7a | 7.333a | 0.941 | 7.333a | 7.333a | 7.333a | 1.153 |
Table 8: Mean Values of sensory score at different storage period.
Conclusion
The present study demonstrated the effect of packaging material on the browning index (BI), total color difference (TCD),moisture gain, water activity, total carotenoid and sensory score of dried capsicum during storage period of four months. After a few days of storage, packaging materials significantly (p<0.001) affected all the above response parameters except sensory score. Thus, Undesirable changes of color, aroma, taste and crispness induced by the physicochemical mechanisms such as non-enzymatic browning (NEB), chemical reactions could not have taken place during entire storage periods. On the other hand, the increase in moisture content and water activity over storage time could result in smaller change in sensory values which were non-significant at 5% level (P<0.05). In comparison with packages employed in the study, HDPE film having high moisture barrier material caused minimal change in moisture content of samples, and hence minimal quality deterioration of dried capsicum slices. It is found that laminated aluminium (Al) was least affected by the ambient storage atmosphere, may be selected for preserving dried capsicum products.
References
- Jaya S, Das H (2005) Accelerated Storage, Shelf Life and Color of Mango Powder. J Food Process Pres29: 45-62.
- Brown H, Williams J, Kirwan M (2003) Packaged product quality and shelf life. In: Food and Beverage Packaging Technology, Coles R, Kirwan M (Eds.). CRC Press, USA.
- Potter NN (1978) Food Science, 3rd ed. The AVI Publishing Company, Inc., Connecticut, Westport. pp. 79-81.
- Kumar P, Mishra HN (2004) Storage stability of mango soy fortified yoghurt powder in two different packaging materials: HDPP and ALP. J Food Eng65: 569-576.
- Adom KK, Dzogbefia VP, Ellis WO, Simpsor BK (1996) Solar drying of okra-effects of selected Package materials on storage stability.Food Res Int 29: 589-593.
- Tao F, Zhang M, Hangqing Y, Sun J (2006) Effects of different storage conditions on chemical and physical properties of white mushrooms after vacuum cooling. J Food Eng 77: 545-549.
- Davoodi MG, Vijayanand P, Kulkarni SG, Ramana KVR (2007) Effect of different pre-treatments and dehydration methods on quality characteristics and storage stability of tomato powder. Food Sci Technol-LEB 40: 1832-1840.
- Topuz A, Ozdemir F (2003) Influence of gamma-irradiation and storage on the carotenoids of sun-dried and dehydrated paprika. J Agric Food Chem 51: 4972-4977.
- Mexis SF, Badeka AV, Riganakos KA, Karakostas KX, Kontominas MG (2009) Effect of packaging and storage conditions on quality of shelled walnuts. Food Control 20: 743-751.
- Howard LR (2001) Antioxidant Vitamin and Phytochemical Content of Fresh and Processed Pepper Fruit (Capsicum annum). In: Handbook of Neutraceuticals and Functional Foods, Wildman REC.
- Krinsky NI, Johnson EJ (2005) Carotenoid actions and their relation to health and disease. Mol Aspects Med 26: 459-516.
- AOAC (1990) Approved Methods of the American Association of Cereal Chemists. 9th ed. American Association of Cereal Chemists, In., St. Paul, Minnesota
- Maskan M (2000) Kinetics of color change of kiwifruits during hot air and microwave drying. J Food Eng 48: 169-175.
- Barreiro JA, Milano M, Sandoval A (1997) Kinetics of color change of double concentrated tomato paste during thermal treatment. J Food Eng 33: 359-371.
- Shin S, Bhowmik SR (1995) Thermal kinetics of color changes in pea puree. J Food Eng 24: 77-86.
- Esse R, Saari A (2004) Shelf-life and moisture management. In: Understanding and Measuring the Shelf-life of Food, Steele R (Ed.), Wood head Publishing Limited, Cambridge, England.
- Gopal TKS, Nair PGV, Kandoran MK, Prabhu PV, Gopakumar K (1998) Shelf life of dried anchoviella in flexible packaging materials. Food Control 9: 205-209.
- Toledo RT (1999) Fundamentals of Food Process Engineering, 2nd Ed. Springer, New York: Von Nostrand Reinhold.
- Labuza TP, Schmidl MK (1985) Accelerated shelf-life testing of foods. Food Tech 39: 57-64.
- Griffiths N (1985) Sensory analysis in measuring shelf-life. Food, Flavors, Ingredients, Packaging and Processing7: 47-48.
Copyright: © 2013 Swain S, et al. This is an open-access article distributed under the terms of the Creative Commons Attribution License, which permits unrestricted use, distribution, and reproduction in any medium, provided the original author and source are credited.
