Indexed In
- Academic Journals Database
- Open J Gate
- Genamics JournalSeek
- JournalTOCs
- China National Knowledge Infrastructure (CNKI)
- Scimago
- Ulrich's Periodicals Directory
- RefSeek
- Hamdard University
- EBSCO A-Z
- OCLC- WorldCat
- Publons
- MIAR
- University Grants Commission
- Geneva Foundation for Medical Education and Research
- Euro Pub
- Google Scholar
Useful Links
Share This Page
Open Access Journals
- Agri and Aquaculture
- Biochemistry
- Bioinformatics & Systems Biology
- Business & Management
- Chemistry
- Clinical Sciences
- Engineering
- Food & Nutrition
- General Science
- Genetics & Molecular Biology
- Immunology & Microbiology
- Medical Sciences
- Neuroscience & Psychology
- Nursing & Health Care
- Pharmaceutical Sciences
Research Article - (2021) Volume 12, Issue 5
Differential Transcription Profiling in Bone Marrow Mononuclear Cells between Myasthenia Gravis Patients with or without Thymoma
Jingqun Tang, Ziming Ye, Yi Liu, Mengxiao Zhou and Chao Qin*Received: 06-Sep-2021 Published: 27-Sep-2021, DOI: 10.35248/2157-7560.21.12.463
Abstract
Purpose: Defective stem cells have been recognized as being associated with autoimmune diseases, such as systemic lupus erythematosus, rheumatoid arthritis, autoimmune cytopenias and Myasthenia Gravis (MG). However, the differential gene expression profile of Bone Marrow Mononuclear Cells (BMMCs) and the molecular mechanisms underlying MG pathogenesis have not been fully elucidated. Therefore, we investigated the abnormal expression and potential roles and mechanisms of mRNAs in BMMCs among patients with MG with or without thymoma.
Methods: Transcription profiling of BMMCs in patients with MG without thymoma (M2) and patients with thymoma-associated MG (M1) was undertaken by using high-throughput RNA sequencing (RNA-Seq), and diseaserelated differentially expressed genes were validated by quantitative real-time polymerase chain reaction (qRT-PCR).
Results: RNA-Seq demonstrated 60 significantly upregulated and 65 significantly downregulated genes in M2 compared with M1. Five disease-related differentially expressed genes were identified and validated by qRT-PCR analysis. Gene Ontology and Kyoto Encyclopedia of Genes and Genomes pathway enrichment analyses were performed to predict the functions of aberrantly expressed genes. Recombination activating 1 (RAG1), RAG2, BCL2-like 11, phosphatidylinositol 4,5-bisphosphate 3-kinase catalytic subunit alpha isoform and repressor element- 1-silencing transcription factor might play roles in MG pathogenesis involving the primary immunodeficiency signaling pathway, signaling pathways regulating pluripotency of stem cells and fork head box O signaling pathway.
Conclusion: The aberrantly expressed genes of BMMCs in M1 or M2 patients demonstrate the underlying mechanisms governing the pathogenesis of MG.
Keywords
Myasthenia gravis; Bone marrow mononuclear cells; RNA sequencing; mRNAs; Thymoma; Auto immune
Introduction
Myasthenia Gravis (MG) is a neuromuscular disorder characterized by muscle weakness and easy fatigability upon exertion. MG is mediated by autoantibodies against postsynaptic structural proteins of neuromuscular junctions: most antibodies target Acetylcholine Receptor (AChR), the less frequent Muscle-Specific Kinase (MuSK) or low-density lipoprotein receptor-related protein 4 (LPR4) [1]. Up to 60% to 80% of patients with MG have thymic hyperplasia and 21% have thymoma [2,3]. To the best of our knowledge, the thymus plays an initial role in triggering humoral immunity in MG because of either thymic hyperplasia or thymoma of lymphoproliferative origin [4-7]. However, the exact mechanisms leading to autoimmunity dysfunction and chronicity in patients with MG have not been elucidated. Despite improvements in treatment due to multiple therapies, including thymectomy, approximately 10% of patients with MG are considered treatmentrefractory [8], highlighting the need for further understanding of the pathophysiology and identification of organism biomarkers to characterize the pathogenesis of the disease and to monitor the therapeutic response.
Immune dysregulation may originate from defects in the proliferation and differentiation of bone marrow (BM)-derived Hematopoietic Stem Cells (HSCs) and/or hematopoietic support function of BM stromal cells, indicating that autoimmune diseases may primarily result from stem cell dysfunction [9-11]. Porta and Papadaki et al. compared the proliferation and differentiation of HSCs and hematopoietic support function of BM stromal cells between patients with Rheumatoid Arthritis (RA) and healthy controls; their results showed that the numbers of CD34+ BM cells, the proliferating capacity of BM myeloid precursors and the percentage of erythroid burst-forming units and colony-forming unit assays of granulocyte macrophage colonies significantly decreased, and the hematopoietic support function of BM stromal cells was abnormal in RA patients [12,13]. Furthermore, patients with autoimmune cytopenias secondary to systemic autoimmune disease exhibited increased apoptosis of BM progenitor cells, leading to low CD34+ cell numbers and abnormal hematopoietic supporting capacity of BM stromal cells due to aberrant, local or systemic inhibitory cytokine production or intricate interactions between hematopoietic and immune cells present within the BM microenvironment [14].
Nevertheless, the immune system emerging from the autologous HSCs of patients with MG is complex, and the pathogenesis of autoimmune dysfunction in the disease has not been fully elucidated. Over the past decade, Genome-Wide Association Studies (GWAS) and gene expression studies have provided novel insights into MG. Recently, gene expression profiles from specific cell subsets have been shown to be better determinants of immune status than whole-blood or Peripheral-Blood Mononuclear Cell (PBMC) profiles due to the diversity of leukocyte responses [15]. In this study, we investigated to explore the core transcriptional signature and crucial pathways of BM Mononuclear Cells (BMMCs) from patients with thymoma-associated MG (M1) and those with MG without thymoma (M2). A global landscape of dysregulated gene signatures was first obtained using high-throughput RNA sequencing (RNA-Seq), followed by pathway analysis and subsequent immune profiling. The findings obtained in this study may help to elucidate the heterogeneity of the disease and identify biomarkers and pathways driving disease pathogenesis.
Materials and Methods
Study patients
The cohort study was designed in two stages and included 36 patients from the outpatient department of the Department of Neurology of the First Affiliated Hospital of Guangxi Medical University. According to whether the patients had thymoma, all patients were divided into group M1 (n=18) and group M2 (n=18). For the RNA-Seq stage, we selected three patients from groups M1 and M2. For the quantitative real-time reverse transcriptionpolymerase chain reaction (qRT-PCR) step, all patients from the two groups were compared. MG was diagnosed based on the clinical evidence of muscle weakness and fatigue and at least one positive ancillary diagnostic test, including proof of pathological decrement in repetitive nerve stimulation or a positive response to a neostigmine test. Positive detection of autoantibodies against AChR in patients further supported the diagnosis. The Myasthenia Gravis Foundation of America (MGFA) [16] clinical classification was also employed to identify the MG subgroups. Regardless of the length of time over which the symptoms of MG appeared, all patients were coming to our clinic for the first time. All patients completed the collection of BM specimens prior to treatment with glucocorticoids, intravenous immunoglobulin, immunosuppression or thymectomy. The patients also had neither clinical symptoms of metabolic disease, infectious disease nor any autoimmune diseases, including thyroid disorders, Systemic Lupus Erythematosus (SLE), RA and Sjogren syndrome. Table 1 summarizes the demographic and baseline clinical data of the study subjects. All patients signed informed consent forms. The study was approved by the Medical Ethics Committees of the Institute of the First Affiliated Hospital of Guangxi Medical University.
| No. | Age, years | Disease | Thymus character and pathology | MGFA | AchR-Ab | Titin-Ab | Previous treatment |
|---|---|---|---|---|---|---|---|
| (at onset) | durations | classification | (nmol/l) | (positive) | |||
| 1* | ≥ 50 | ≤ 1y | thymoma(B2) | Ⅲa | 9.634 | 1.83 | Pb |
| 2* | <50 | >1y, <5y | thymoma(B1) | Ⅱb | 7.279 | 1.435 | Pb |
| 3* | ≥ 50 | ≥5y | thymoma(B2) | Ⅳa | 2.485 | - | Pb |
| 4 | <50 | >1y, <5y | Thymoma (B1) | Ⅱa | 0.609 | - | Pb |
| 5 | ≥ 50 | >1y, <5y | Thymoma (B1) | Ⅰ | 8.008 | - | no |
| 6 | <50 | >1y, <5y | Thymoma (B1) | Ⅲa | -- | - | Pb |
| 7 | <50 | ≥5y | Thymoma (B2) | Ⅳa | 8.435 | - | no |
| 8 | <50 | >1y, <5y | Thymoma (B2) | Ⅲb | 6.813 | - | no |
| 9 | <50 | ≤1y | Thymoma (B1) | Ⅱb | 1.029 | - | Pb |
| 10 | <50 | >1y, <5y | Thymoma (B2) | Ⅲa | 0.621 | - | Pb |
| 11 | <50 | >1y, <5y | Thymoma (B2) | Ⅳa | 10.097 | - | Pb |
| 12 | <50 | ≤1y | Thymoma (B1) | Ⅰ | -- | - | no |
| 13 | ≥50 | >1y, <5y | Thymoma (B2) | Ⅲb | 8.622 | - | Pb |
| 14 | ≥ 50 | >1y, <5y | Thymoma (B2) | Ⅳb | 16.976 | 2.021 | Pb |
| 15 | <50 | >1y, <5y | Thymoma (B1) | Ⅰ | 17.698 | - | Pb |
| 16 | <50 | >1y, <5y | Thymoma (B2) | Ⅲa | 2.714 | - | Pb |
| 17 | ≥50 | ≥5y | Thymoma (B2) | Ⅲb | 13.79 | - | no |
| 18 | <50 | >1y, <5y | Thymoma (B1) | Ⅲa | 20.743 | - | Pb |
| 19* | <50 | ≥5y | normal | Ⅰ | 12.059 | - | Pb |
| 20* | ≥ 50 | >1y, <5y | normal | Ⅳa | 7.656 | - | Pb |
| 21* | <50 | ≤1y | normal | Ⅲa | -- | - | Pb |
| 22 | <50 | ≥ 5y | normal | Ⅰ | 0.655 | - | no |
| 23 | <50 | >1y, <5y | normal | Ⅱb | 17.533 | - | no |
| 24 | <50 | >1y, <5y | normal | Ⅱa | 1.458 | - | Pb |
| 25 | <50 | ≥ 5y | normal | Ⅱa | -- | - | no |
| 26 | <50 | ≤1y | normal | Ⅰ | 1.007 | - | Pb |
| 27 | <50 | >1y, <5y | normal | Ⅳa | 9.78 | - | Pb |
| 28 | <50 | >1y, <5y | normal | Ⅱb | 15.254 | - | Pb |
| 29 | <50 | >1y, <5y | normal | Ⅲa | 12.58 | - | Pb |
| 30 | <50 | >1y, <5y | normal | Ⅲb | 6.56 | - | no |
| 31 | <50 | ≤ 1y | normal | Ⅰ | 13.215 | - | no |
| 32 | <50 | >1y, <5y | normal | Ⅱb | -- | - | Pb |
| 33 | <50 | >1y, <5y | normal | Ⅲb | 15.254 | - | Pb |
| 34 | ≥ 50 | ≤ 1y | normal | Ⅱb | 4.384 | - | no |
| 35 | <50 | >1y, <5y | normal | Ⅰ | -- | - | no |
| 36 | <50 | >1y, <5y | normal | Ⅳa | 1.396 | - | Pb |
Note: F: Female; M: Male; *: for RNA-seq; MGFA: Myasthenia gravis foundation of America; AchR-Ab: Autoantibodies against acetylcholine receptors; --: Negative autoantibodies, including AchRs-Ab, MuSK-Ab, and LPR4-Ab; -: Negative Titin-Ab; Pb: Pyridostigmine bromide.
Table 1: Clinical and laboratory characteristics of the patients studied.
Isolation of BMMCs
Using 2 mL 2% lidocaine hydrochloride (Harvest Pharmaceutical Co., Ltd, Shanghai, China) for local infiltration anaesthesia, aspirate 10 mL of fresh BM from the patient's posterior iliac crest, and then immediately dilute it at a ratio of 1:1 in Iscove’s Modified Dulbecco’s Medium (IMDM; GibcoBRL, Life Technologies, USA) supplemented with 10 IU/mL preservative-free heparin (Tianjinshenghua; China) and 100 IU/mL penicillin streptomycin (Solar bio Life Science, China). The diluted samples were centrifuged with a Ficoll Hypaque gradient density (Lymphoprep; Stem Cell Technologies, Vancouver, BC, Canada) at a speed of 800 × g for 30 mins at room temperature. BMMCs were collected from the second interphase, washed twice with the abovementioned medium and resuspended in IMDM at a concentration of 107 cells/mL. Freshly sorted BMMCs were frozen in a Cryostor CS10 (Stem Cell Technologies, Vancouver, BC, Canada) according to the manufacturer’s protocol and stored in liquid nitrogen. The sequencing samples (n=3 per group) were sent to Gene Denovo Biotechnology Co. (Guangzhou, China) for further processing.
Flow Cytometry (FC) and immunophenotyping analyses
BMMCs (50 μL 107 cells/mL) were labeled with 5 μL PE anti-CD34 (Abcam, Cambridge, UK) and 10 μL FITC anti-CD38 (Abcam, Cambridge, UK) fluorescent mouse monoclonal antibodies and analyzed on a FAC Scan FC (Becton Dickinson, San Jose, CA) according to the manufacturer's protocol. Data for a minimum of 100,000 events were acquired and processed with FlowJo software (Version 10.0; Ashland, OR).
RNA extraction and quality control
Total RNA was harvested for library construction and sequencing. In brief, total RNA was extracted from samples by using a TRIzol reagent kit (Invitrogen, Carlsbad, CA, USA) following the manufacturer’s protocol and subjected to an Agilent 2100 Bioanalyzer (Agilent Technologies, Palo Alto, CA, USA) and RNase free agarose gel electrophoresis for quality and purity tests, respectively. The RNA integrity number for each sample was higher than 7, indicating that the extracted RNAs possessed high quality and integrity. The ratios of Optical Density (OD) 260/280 in all samples were between 1.8 and 2.0, indicating high purity of extracted RNAs. The OD260/230 ratios in all samples ranged from 1.8 to 2.2, signifying an absence of organic extraction reagent contamination. The Q30 value of each sample was greater than 91%. Thus, the samples were determined to meet the quality and purity requirements for high-throughput sequencing.
mRNA-seq library construction and sequencing
After the total RNAs were extracted, ribosomal RNAs (rRNAs) were removed to retain mRNAs by using an oligo (dT) RiboZero Magnetic Gold Kit (Illumina, USA). The enriched mRNAs were fragmented and reverse-transcribed into cDNA. Next, the cDNA fragments were purified with a QiaQuick PCR extraction kit (Qiagen, Venlo, The Netherlands), end-repaired, subjected to poly (A) addition, and ligated to Illumina sequencing adapters. Next, uracil-N-glycosylase was utilized to digest second-strand cDNA. The digested products were size-selected using agarose gel electrophoresis, amplified by PCR, and sequenced using the Illumina HiSeq™ 4000 platform (Illumina, San Diego, CA, USA) by Gene Denovo Biotechnology Co. (Guangzhou, China).
Processing and mapping of mRNA-Seq reads
The Illumina HiSeq platform generated mRNA-Seq reads and removed the adaptors and low-quality reads (Q-value <20) bases at the 5′ and 3′ ends by FASTQ (version 0.18.0) [17]. The shortread alignment tool Bowtie2 (2.2.8) [18] was employed to map reads to the rRNA database. The rRNA mapped reads were subsequently removed. The remaining reads were further utilized in transcriptome assembly and analysis. The clean reads of each sample were then mapped to the reference genome by TopHat2 (version 2.1.1) [19]. The reconstruction of transcripts was performed with Cufflinks software (version 2.2.1) [20] which, together with TopHat2, enables biologists to identify new genes and new splice variants of known ones. Transcript abundances were quantified by RSEM software (version 1.2.19) [21], and the transcript expression level was normalized using the Fragments Per Kilo Base of transcript per million mapped reads (FPKM) method. Genes with expression levels >1 FPKM were retained for further analysis.
Identification of differentially expressed mRNAs and enrichment analysis of Gene Ontology (GO) functions and Kyoto Encyclopedia of Genes and Genomes (KEGG) pathways
Scatter plots were generated, and hierarchical clustering was performed to assess and distinguish the variations in mRNA expression between the M1 and M2 groups. Aberrant mRNA expression was identified by volcano plot filtering and FC analysis. Differentially Expressed Gene (DEG) analysis was performed using the edgeR package. On the basis of this method, genes with |log2FC| ≥ 2 and a false discovery rate (FDR) <0.05 were classified as DEGs between the two groups. Next, differentially expressed coding RNAs were subjected to enrichment analysis of GO functions and KEGG pathways. An FDR <0.05 was considered to be the threshold for significant enrichment.
Verification of mRNA-Seq results for mRNA expression by quantitative real time polymerase chain reaction (qRTPCR) analysis
Total RNA was extracted from 36 samples using a TRIzol reagent kit (Invitrogen, Carlsbad, CA, USA) as described above. RNA integrity was evaluated by 1% agarose gel electrophoresis, whereas a Nano Drop 2000 (Thermo Fisher Scientific, Inc., Waltham, MA, USA) was utilized to measure the RNA concentration and quality. Next, the samples with an OD 260/280 ratio from 1.8 to 2.0 and an OD 260/230 ratio from 1.8 to 2.2 were selected for qRT-PCR analysis. For cDNA synthesis, 1 µg of total RNA was reverse transcribed into DNA with PrimeScriptTM RT Master Mix (Takara, Germany). qRT-PCR was performed at a final volume of 20 μL containing 7 μL nuclease-free water, 10 μL 2×SYBR Green I Master Mix (Roche, Basel, Switzerland), 0.6 μL PCR forward primer (10 µM), 0.6 μL PCR reverse primer (10 µM) and 2 μL RNA template. All qRT-PCR assays were performed in a StepOnePlus Real-Time PCR System (Applied Biosystems, USA) according to the following conditions: 10 min at 95 °C followed by 40 cycles of amplification (10s at 95°C and 30s at 60°C). Thirty independent biological replicates and three technical replicates of each biological replicate were obtained for qRT-PCR analysis. Table 2 shows the primers used for qRT-PCR analysis. The human glyceraldehyde-3-phosphate dehydrogenase (GAPDH) gene was employed as the reference gene for data normalization. The comparative threshold cycle (2- ΔΔCt) method of relative quantitation was employed to analyze the expression differences. Ct denotes the amplification cycles when the real-time fluorescence intensity of the reaction reached the set threshold, and when amplification was in logarithmic growth.
| Gene | Primer sequences (5'-3') |
|---|---|
| RAG1 | F- GAGCAAGGTACCTCAGCCAGCAT |
| R- GGATCTCACCCGGAACAGCTT | |
| RAG2 | F- ACCTCCCTCCTCTTCGCTAC |
| R- AGAAGGCATGTATGAGCGTCC | |
| REST | F- AGCTGGGGATAATGAGCGAGT |
| R- ACATTTATATGGGCGTTCTCCTGT | |
| BCL2L11 | F- GCCCTTGTTCCCCCAAATGT |
| R- ACCTTCTCGGTCACACTCAGA | |
| PIK3CA | F- AGAGCCCCGAGCGTTTCT |
| R- TTCACCTGATGATGGTCGTGG | |
| GAPDH | F- CTCGCTTCGGCAGCACA |
| R- AACGCTTCACGAATTTGCGT |
Note: F: forward; R: reverse
Table 2: Gene specific primers used for qRT-PCR.
Statistical analysis
Data are presented as the mean ± Standard Deviation (SD) of the mean. The normal distribution of variables was investigated prior to statistical analysis using visual (histograms) and analytical methods (Kolmogorov-Smirnov/Shapiro-Wilk’s test). Data were recorded and analyzed with Graph Pad Prism 8.0 (Graph Pad Software, La Jolla, CA, USA) and IBM SPSS Statistics version 24.0 (IBM Corporation, New York, USA). Differences in mRNA levels between groups were evaluated with one-way analysis of variance (ANOVA) and Pearson’s chi-square test for categorical variables. P-values <0.05 were considered to be significant.
Results
Subject characteristics
Table 3 presents the demographic and clinical characteristics of the M1 (n=18) and M2 (n=18) groups. The mean ages of the two groups were 43.82 ± 8.27 and 43.67 ± 5.89 years (P>0.05). No significant differences in sex, disease duration, MGFA classification, positive AChR-Ab or previous treatment were observed between groups M1 and M2 (P>0.05).
| thymoma-associated | MG | P-value | |
|---|---|---|---|
| MG | without thymoma | ||
| (M1, n=18) | (M2, n=18) | ||
| Mean age (years) | 43.82 ± 8.27 | 43.67 ± 5.89 | 0.949 |
| Gender (Female/Male) | 12/6 | 11/7 | 1.000 |
| Disease durations (≤1y/>1y, <5y/≥ 5y) | 3/12/3 | 4/11/3 | 0.911 |
| MGFA classification(Ⅰ/Ⅱa/Ⅱb/Ⅲa/Ⅲb/Ⅳa/Ⅳb) | 3/1/2/5/3/3/1 | 5/2/4/2/2/3/0 | 0.679 |
| Positive AchR-Ab | 16/18(88.9%) | 14/18(77.8%) | 0.658 |
| Previous treatment | 13/18(72.2%) | 11/18(61.1%) | 0.725 |
Table 3: Vaccine candidates in Phase 3 and Phase 4 of development: Some of the potential vaccines that are in phase 3 and 4 development are listed below.
A FC analysis of CD34+ cells
Figure 1 shows the data from the FC analysis of CD34+ cells in BMMCs. The mean (± SD) proportion of CD34+ cells among BMMCs was significantly lower in M2 than in M1 (n=18 for each group) (1.85 ± 0.79% vs. 0.57 ± 0.26%, respectively; P<0.05). This reduction reflected the decreased number of committed CD34+CD38+ cells (1.03 ± 0.57% vs. 0.31 ± 0.17%, P ≤ 0.001) and the number of primitive CD34+CD38 cells (0.82 ± 0.45% vs. 0.25 ± 0.20%, P<0.05).
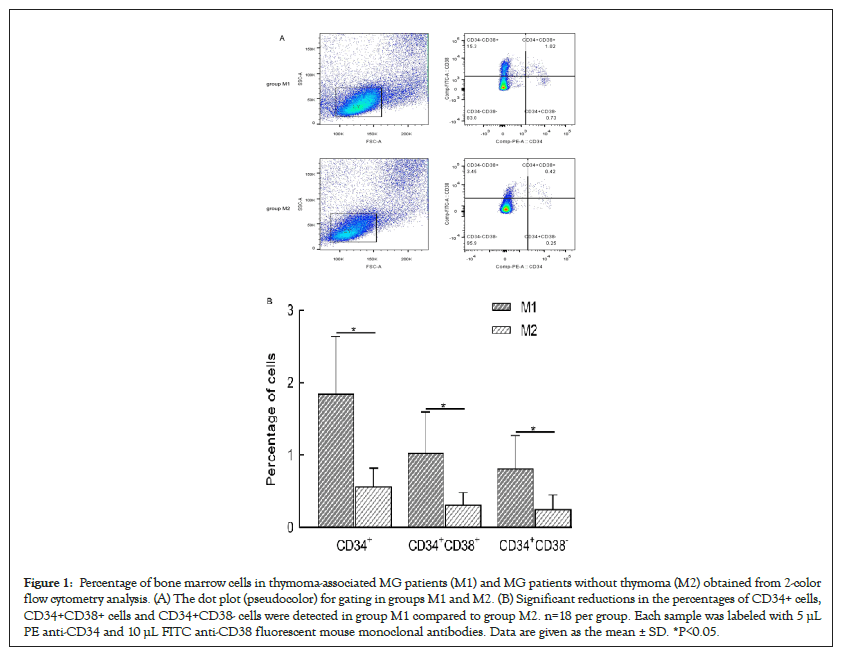
Figure 1: Percentage of bone marrow cells in thymoma-associated MG patients (M1) and MG patients without thymoma (M2) obtained from 2-color flow cytometry analysis. (A) The dot plot (pseudocolor) for gating in groups M1 and M2. (B) Significant reductions in the percentages of CD34+ cells, CD34+CD38+ cells and CD34+CD38- cells were detected in group M1 compared to group M2. n=18 per group. Each sample was labeled with 5 µL PE anti-CD34 and 10 µL FITC anti-CD38 fluorescent mouse monoclonal antibodies. Data are given as the mean ± SD. *P<0.05.
DEGs
Six qualified libraries from groups M1 and M2 were sequenced. Figures 2A and 2B present an overview of the mRNA sequencing data, showing 1876 DEGs with 960 upregulated and 916 downregulated mRNAs. Using the threshold values log2 FC>1 or log2 FC<-1 and FDR<0.05, we identified 125 differentially expressed mRNAs comprising 60 upregulated and 65 downregulated mRNAs (Figure 2C), which were all annotated (Supplementary Table 1) to primary immunodeficiency, forkhead box O signaling pathway, neurodegenerative diseases and signaling pathways regulating pluripotency of stem cells. Hierarchical clustering analysis demonstrated differentially expressed mRNAs in groups M1 and M2 (Figure 3).
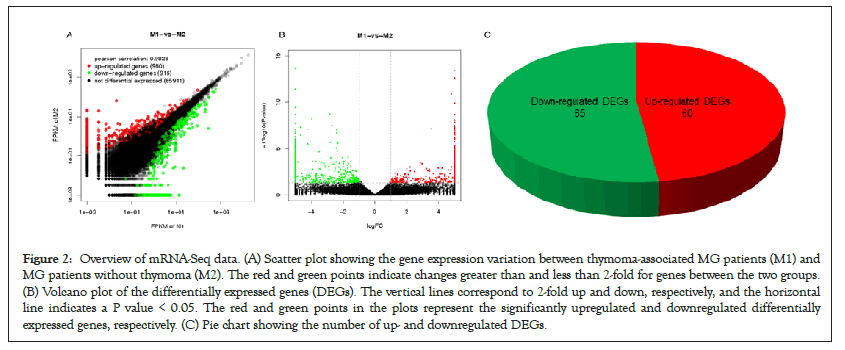
Figure 2: Overview of mRNA-Seq data. (A) Scatter plot showing the gene expression variation between thymoma-associated MG patients (M1) and MG patients without thymoma (M2). The red and green points indicate changes greater than and less than 2-fold for genes between the two groups. (B) Volcano plot of the differentially expressed genes (DEGs). The vertical lines correspond to 2-fold up and down, respectively, and the horizontal line indicates a P value < 0.05. The red and green points in the plots represent the significantly upregulated and downregulated differentially expressed genes, respectively. (C) Pie chart showing the number of up- and downregulated DEGs.
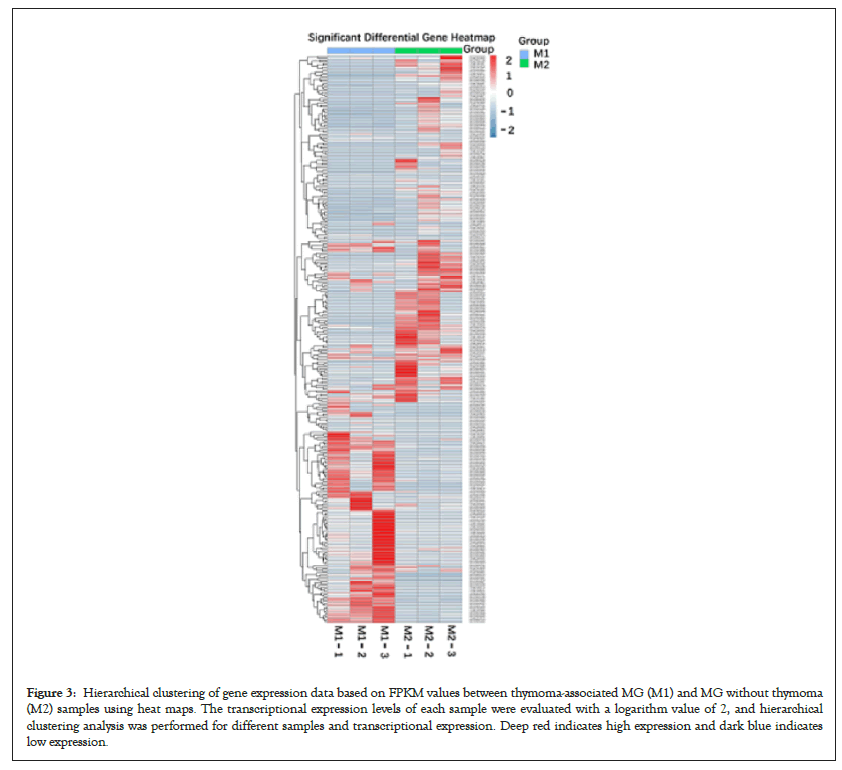
Figure 3: Hierarchical clustering of gene expression data based on FPKM values between thymoma-associated MG (M1) and MG without thymoma (M2) samples using heat maps. The transcriptional expression levels of each sample were evaluated with a logarithm value of 2, and hierarchical clustering analysis was performed for different samples and transcriptional expression. Deep red indicates high expression and dark blue indicates low expression.
Management of side-effects/adverse effects
GO function contains three terms: Cellular Component (CC), Molecular Function (MF) and Biological Process (BP). Figures 4 and 5 shows the GO analysis of upregulated and downregulated DEGs, respectively. In the CC ontology, cell (GO: 0005623), cell part (GO: 0044464), organelle (GO: 0043226), and intracellular (GO: 0005662) were significantly enriched GO terms for upregulated (Figure 4B) and downregulated genes (Figure 5B). In the MF ontology, the most common GO terms for significantly upregulated (Figure 4C) and significantly downregulated significant DEGs (Figure 5C) were binding (GO: 0005488), ion binding (GO: 0043167) and metal ion binding (GO: 0046872). In the BP ontology, the upregulated genes (Figure 4D) were primarily enriched in CC organization (GO: 0016043), cellular component organization or biogenesis (GO: 0071840), anatomical structure development (GO: 0048856) and developmental process (GO: 0032502). Meanwhile, the downregulated genes (Figure 5D) were primarily enriched in the regulation of BP (GO: 0050789), biological regulation (GO: 0065007), regulation of metabolic process (GO: 0019222), regulation of macromolecular metabolic process (GO: 0060255), regulation of cellular metabolic process (GO: 0031323) and positive regulation of BP (GO: 0048518). KEGG pathway enrichment analysis indicated that the differentially expressed mRNAs were most significantly enriched in terms of signal transduction, immune system and cancer (Figure 6).
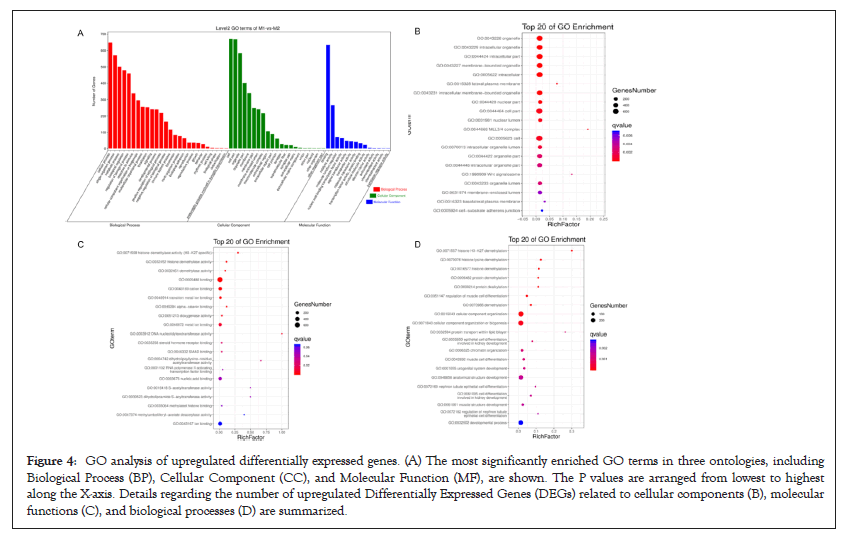
Figure 4: GO analysis of upregulated differentially expressed genes. (A) The most significantly enriched GO terms in three ontologies, including Biological Process (BP), Cellular Component (CC), and Molecular Function (MF), are shown. The P values are arranged from lowest to highest along the X-axis. Details regarding the number of upregulated Differentially Expressed Genes (DEGs) related to cellular components (B), molecular functions (C), and biological processes (D) are summarized.
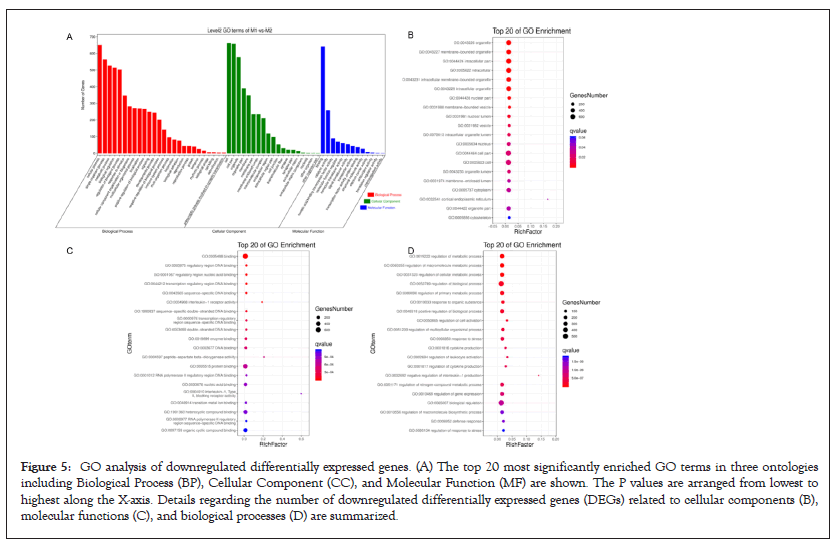
Figure 5: GO analysis of downregulated differentially expressed genes. (A) The top 20 most significantly enriched GO terms in three ontologies including Biological Process (BP), Cellular Component (CC), and Molecular Function (MF) are shown. The P values are arranged from lowest to highest along the X-axis. Details regarding the number of downregulated differentially expressed genes (DEGs) related to cellular components (B), molecular functions (C), and biological processes (D) are summarized.
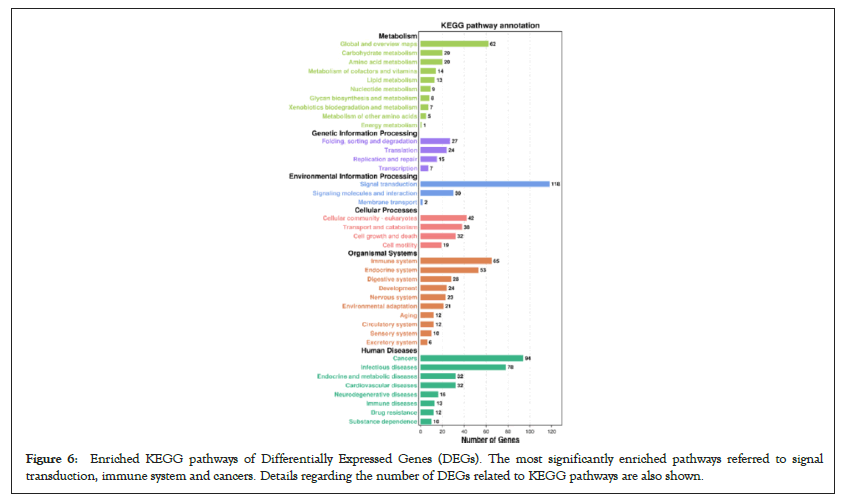
Figure 6: Enriched KEGG pathways of Differentially Expressed Genes (DEGs). The most significantly enriched pathways referred to signal transduction, immune system and cancers. Details regarding the number of DEGs related to KEGG pathways are also shown.
Verification of DEGs
Five disease-related DEGs involving the primary immunodeficiency signaling pathway, signaling pathways regulating the pluripotency of stem cells and the FOXO signaling pathway were selected. These DEGs included four upregulated genes, namely, repressor element-1-silencing transcription factor (REST, also known neuronrestrictive silencer factor), BCL2-like 11 (BCL2L11, also known as BCL2 interacting mediator of cell death), Recombination Activating 1 (RAG1) and RAG2. One downregulated gene, phosphatidylinositol 4,5-bisphosphate 3-kinase catalytic subunit alpha isoform (PIK3CA), was selected for further validation by qRT-PCR analysis (Figure 7). Data regarding the expression of genes were consistent with the results obtained through RNA-Seq.
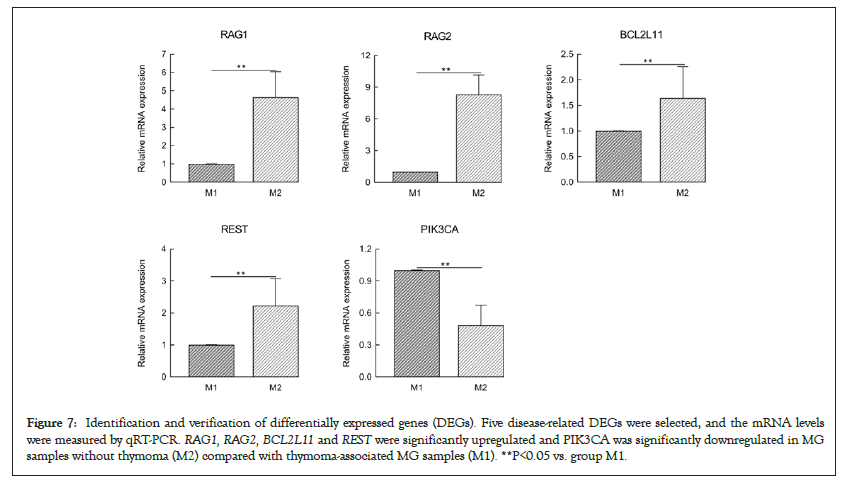
Figure 7: Identification and verification of differentially expressed genes (DEGs). Five disease-related DEGs were selected, and the mRNA levels were measured by qRT-PCR. RAG1, RAG2, BCL2L11 and REST were significantly upregulated and PIK3CA was significantly downregulated in MG samples without thymoma (M2) compared with thymoma-associated MG samples (M1). **P<0.05 vs. group M1.
Discussion
MG is a chronic autoimmune disorder with a high recurrence rate, and some cases can be refractory or life-threatening. Therefore, studying the genetic mechanism governing MG is important. Researchers have previously investigated the relationship between altered expression of mRNAs and the pathogenesis of MG. To investigate a wide range of genes in BMMCs to dissect the physiological, metabolic and cellular processes of MG, we first analyzed the transcriptomic changes in BMMCs from thymomaassociated MG and MG without thymoma by conducting high-throughput sequencing and qRT-PCR analysis. RNA-Seq analysis showed that a significant number of mRNAs are altered in MG, indicating that they may play regulatory role in the pathophysiological processes of this disease.
In the present study, transcripts of 67,787 genes, of which 960 DEGs were upregulated, and 916 DEGs were downregulated, were detected using an Illumina HiSeq™ 4000 platform according to the criteria of log2 FC ≥ 2 and P-values <0.05 with the edgeR package. The aberrantly expressed mRNAs contained a certain proportion of previously undescribed mRNAs. This result indicates that the current mRNA database is incomplete and needs to be further supplemented. Among these mRNAs, five diseaserelated DEGs involved in primary immunodeficiency, signaling pathways regulating the pluripotency of stem cells and the FOXO signaling pathway were selected for further validation by qRT-PCR. The results demonstrated that RAG1, RAG2, BCL2L11 and REST were significantly upregulated, whereas PIK3CA was significantly downregulated in MG samples without thymoma compared with thymoma-associated MG samples. Our findings showed consistency in qRT-PCR and RNA-Seq data. Notably, the FOXO signaling pathway involving the upstream gene PIK3CA and the downstream genes RAG1, RAG2, BCL2L11 and REST may be important to MG pathogenesis.
Precise annotation of mRNA functions remains complex. In this study, we interpreted the mRNA functions based on co-expression gene GO and KEGG pathway analyses by using pathway-related database [22] and GO databases. As shown in Table 3, RAG1 and RAG2 were associated with primary immunodeficiency and the PI3K–FOXO signaling pathway involving BPs, MFs and CCs. Recent studies [23] have highlighted the key role played by FOXO1, which has emerged as a critical target of the PI3K–FOXO pathway in the preservation of the HSC pool, regulation of progenitor commitment, and development and differentiation of B-cells by regulating its critical target genes, which include PIK3CA, early B-cell factor, RAG1, interleukin-7 receptor, activation-induced cytidine deaminase and L-selectin. RAG1 and RAG2 play important roles in the development and function of T and B cells and the immune system. In addition, the dysfunctions and hypomorphic mutations associated with these genes may result in malignancies of the hematopoietic system, primary immunodeficiency diseases and Severe Combined Immunodeficiency (SCID), Omenn Syndrome (OS) and autoimmunity [24-27]. Brauer et al. [28] investigated T-cell development and T-Cell Receptor (TCR) V(D)J recombination by using differentiation of human-induced pluripotent stem cells generated from patients (SCID versus OS) with different RAG1 mutations in vitro; these researches detected no TCR-α/δ excision circle (a marker of TCR –α/δ locus rearrangements) in SCID and OS-derived T-lineage cells, which was consistent with a pre- TCR block in T-cell development; this result elucidates important differences that explain the wide range of immunological phenotypes resulting from different mutations within the same RAG1 of various patients. In our study, PIK3CA and RAG1/RAG2 were significantly downregulated and upregulated in M2 patients, respectively. This finding suggests that the PI3K (PIK3CA)-FOXORAG1/ RAG2 signaling pathway may play a key role in the occurrence and development of MG. Meanwhile, opposite expression levels of PIK3CA and RAG1/RAG2 were observed in M1 patients in relation to their dysfunction or mutation, necessitating further functional verification and mechanistic research.
Apoptosis plays an essential role in the development, function and homeostasis of the immune system. Experiments with transgenic and gene knockout models have shown that BCL2L11 is a critical regulator of the negative selection of B lymphocytes in BM HSCs and T lymphocytes in the thymus and periphery [29-31]. The phenotype of BCL2L11-deficient mice is an SLE-like autoimmune disease with an abnormal accumulation of self-reactive lymphocytes and HSCs and autoantibody production [32,33]. Furthermore, BCL2L11 knockout mice fail to delete autoreactive T cells in the thymus, which leads to enhanced self-reactive T effector cell function followed by exacerbation of kidney disease [31]. In our work, the BCL2L11 gene was significantly downregulated in M1 patients relative to M2 patients. In addition, the percentage of HSCs significantly increased in M1 patients compared with M2 patients. This result suggests that BCL2L11 may be an important regulator of homeostasis of the BM hematopoietic system, as described above. However, the correlation or coordinated regulation system of BCL2L11 with other apoptotic molecules has not been elucidated. Further studies are warranted to determine the coordinated aspects of the effect of BCL2L11 on the immune system.
REST is a zinc finger transcription factor that plays negatively regulated roles in Neuronal Stem and Progenitor Cell (NSPC) development and differentiation by recruiting transcriptional and epigenetic regulatory cofactors to repressor element-1 in the promoter regions of neuronal genes [34,35]. Recent studies [36] showed that in the T cell/neuron coculture model, activated CD4+ T cells reduced the activity of neurons and extracellular signalregulated kinase 1/2, causing REST mRNA upregulation and thereby mediating the downregulation of REST-mediated neuronal cell adhesion molecule L1, which exhibited an unexpected functions in the pathological crosstalk between the immune and nervous systems. Bergsland et al. [37] noted that blocking the function of REST led to loss of alterations in chromatin modifications and the suppression of nitric oxide-induced neuronal to glial switching. This result indicates that REST is an important factor in the NSPCspecific response to innate immunity. In our study, using RNA-Seq technology and qRT-PCR analysis, we determined that REST was upregulated in M2 patients, with the most enriched GO terms including ‘negative regulation of nervous system development’, ‘regulation of mesenchymal stem cell differentiation’, ‘transcription factor binding’ and ‘muscle structure development’ in the pathogenesis between M1 and M2 patients (Figure 4). However, these findings suggest an unknown role of REST in the control of neuronal gene transcription in response to neuroimmunity. This unknown function may be investigated in future works involving gene transfection/knockdown, possibly helping to elucidate the pathogenesis of MG. Additional studies are required to confirm the biological function of these genes.
Our research features several limitations. First, the RNA-Seq data were limited to a small number of samples. The qRT-PCR results were acquired from a small sample consisting of 18 M1 patients and 18 M2 patients. Further studies employing a large sample size are necessary to evaluate and validate the results. Most of the conclusions of this study were also generated based on RNASeq data analysis. Furthermore, we annotated the functions of abnormally expressed mRNAs and were unable to validate the function of disease-related DEGs, which warrants further systematic research. In the future, we aim to further investigate and focus on the functional verification and molecular mechanisms of mRNAs in the pathological process of MG.
Conclusion
A total of 1876 DEGs were identified between M1 and M2 patients. RAG1, RAG2, BCL2L11, PIK3CA and REST were suggested to play important roles in the pathogenesis of MG. Nevertheless, the lack of biological experiments was a major limitation of the present study. Further research should be designed to support our results and investigate the molecular mechanisms underlying the pathological process of MG.
Acknowledgements
We thank our patients for participating in this study. We are grateful to Guangzhou Genedenovo Biotechnology Co., Ltd for assisting in sequencing and bioinformatics analysis.
Ethics Approval and Consent to Participate
The study was approved by the Medical Ethics Committees of the Institute of the First Affiliated Hospital of Guangxi Medical University. All patients consent to participate the study.
Appendix a. Supplementary data
The datasets generated for this study can be found in NCBI (BIOProject accession number PRJNA660526, SRA accession number SRP279695).
Competing Interests
The authors declare that they have no commercial or financial conflicts of interest.
Funding
This research was supported by the National Natural Science Foundation of China (No. 81860222 and 81960220) and the Natural Science Foundation of Guangxi, China (No. 2018 GXNSFAA185029 and 2019GXNSFDA185008).
Authors’ Contributions
Jingqun Tang, Ziming Ye and Yi Liu designed the study. Jingqun Tang and Mengxiao Zhou collected the clinical data. Jingqun Tang, Ziming Ye and Yi Liu analysed the data and drafted. Jingqun Tang, Ziming Ye, Yi Liu and Chao Qin revised the manuscript. Chao Qin supervised the study. All authors read and approved the final manuscript.
REFERENCES
- Vincent A, Huda S, Cao M, Cetin H, Koneczny I, Rodriguez‐Cruz P, et al. Serological and experimental studies in different forms of myasthenia gravis. Ann N Y Acad Sci. 2018;1413(1):143-153.
- Leite MI, Ströbel P, Jones M, Micklem K, Moritz R, Gold R, et al. Fewer thymic changes in MuSK antibody‐positive than in MuSK antibody‐negative MGAnn Neurol. 2005;57(3):444-448.
- Cron M, Maillard S, Villegas J, Truffault F, Sudres M, Dragin N, et al. Thymus involvement in early-onset myasthenia gravis. In13th International Conference on Myasthenia Gravis and Related Disorders. 2017;1412(1):137-145.
- Marx A, Pfister F, Schalke B, Saruhan-Direskeneli G, Melms A, Ströbel P. The different roles of the thymus in the pathogenesis of the various myasthenia gravis subtypes. Autoimmun Rev. 2013;12(9):875-884.
- Romi F, Hong Y, Gilhus NE. Pathophysiology and immunological profile of myasthenia gravis and its subgroups. Curr Opin Immuno. 2017;49:9-13.
- Cufi P, Soussan P, Truffault F, Fetouchi R, Robinet M, Fadel E, et al. Thymoma-associated myasthenia gravis: On the search for a pathogen signature. J Autoimmun. 2014;52:29-35.
- Berrih-Aknin S, Le Panse R. Myasthenia gravis: a comprehensive review of immune dysregulation and etiological mechanisms. J Autoimmun. 2014;52:90-100.
- Mantegazza R, Antozzi C. When myasthenia gravis is deemed refractory: clinical signposts and treatment strategies. Ther Adv Neurol Disord. 2018;11:1756285617749134.
- Ikehara S, Inaba M, Yasumizu R, Nagata N, Toki J, Hisha H, et al. Autoimmune diseases as stem cell disorders. Tohoku J Exp Med. 1994;173(1):141-155.
- Otsuka T, Okamura S, Harada M, Ohhara N, Hayashi S, Yamaga S, et al. Multipotent hemopoietic progenitor cells in patients with systemic lupus erythematosus. J Rheumatol. 1988;15(7):1085-1090.
- Nauta AJ, Fibbe WE. Immunomodulatory properties of mesenchymal stromal cells. Blood, J Ameri Social Hematol. 2007;110(10):3499-3506.
- Porta C, Caporali R, Epis O, Ramaioli I, Invernizzi R, Rovati B, et al. Impaired bone marrow hematopoietic progenitor cell function in rheumatoid arthritis patients candidated to autologous hematopoietic stem cell transplantation. Bone marrow transplantation. 2004;33(7):721-728.
- Papadaki HA, Kritikos HD, Gemetzi C, Koutala H, Marsh JC, Boumpas DT, Eliopoulos GD. Bone marrow progenitor cell reserve and function and stromal cell function are defective in rheumatoid arthritis: evidence for a tumor necrosis factor alpha–mediated effect. Blood, J Ameri Social Hematol. 2002;99(5):1610-1619.
- Papadaki HA, Marsh JC, Eliopoulos GD. Bone marrow stem cells and stromal cells in autoimmune cytopenias. Leuk Lymphoma. 2002;43(4):753-760.
- McKinney EF, Lee JC, Jayne DR, Lyons PA, Smith KG. T-cell exhaustion, co-stimulation and clinical outcome in autoimmunity and infection. Nature. 2015;523(7562):612-616.
- Jaretzki AI, Barohn RJ, Ernstoff RM, Kaminski HJ, Keesey JC, Penn AS, et al. Myasthenia gravis: recommendations for clinical research standards. Neurology. 2000;55(1):16-23.
- Chen S, Zhou Y, Chen Y, Gu J. fastp: an ultra-fast all-in-one FASTQ preprocessor. Bio Inform. 2018;34(17):i884-i890.
- Langmead B, Salzberg SL. Fast gapped-read alignment with Bowtie 2. Nat Methods. 2012;9(4):357-359.
- Kim D, Pertea G, Trapnell C, Pimentel H, Kelley R, Salzberg SL. TopHat2: accurate alignment of transcriptomes in the presence of insertions, deletions and gene fusions. Genome Biol. 2013;14(4):1-3.
- Trapnell C, Roberts A, Goff L, Pertea G, Kim D, Kelley DR, et al. Differential gene and transcript expression analysis of RNA-seq experiments with TopHat and Cufflinks. Nat Protoc. 2012;7(3):562-578.
- Li B, Dewey CN. RSEM: accurate transcript quantification from RNA-Seq data with or without a reference genome. BMC Bioinformatics. 2011;12(1):1-6.
- Nawrocki EP, Eddy SR. Infernal 1.1: 100-fold faster RNA homology searches. Bioinformatics. 2013;29(22):2933-2935.
- Szydowski M, Jaboska E, Juszczyski P. FOXO1 transcription factor: a critical effector of the PI3K-AKT axis in B-cell development. Int Rev Immunol. 2014;33(2):146-157.
- Meshaal S, El Hawary R, Elsharkawy M, Mousa RK, Farid RJ, Abd Elaziz D, et al. Mutations in Recombination Activating Gene 1 and 2 in patients with severe combined immunodeficiency disorders in Egypt. Clin Immunol. 2015;158(2):167-173.
- Avila EM, Uzel G, Hsu A, Milner JD, Turner ML, Pittaluga S, et al. Highly variable clinical phenotypes of hypomorphic RAG1 mutations. Pediatr. 2010;126(5):e1248-e1252.
- Chen K, Wu W, Mathew D, Zhang Y, Browne SK, Rosen LB, et al. Autoimmunity due to RAG deficiency and estimated disease incidence in RAG1/2 mutations. J Allergy Clin Immunol. 2014;133(3):880-882.
- Niehues T, Perez-Becker R, Schuetz C. More than just SCID—the phenotypic range of combined immunodeficiencies associated with mutations in the recombinase activating genes (RAG) 1 and 2. Clin Immunol. 2010;135(2):183-192.
- Brauer PM, Pessach IM, Clarke E, Rowe JH, Ott de Bruin L, Lee YN, et al. Modeling altered T-cell development with induced pluripotent stem cells from patients with RAG1-dependent immune deficiencies. Blood, J Am Soc Hematol. 2016;128(6):783-793.
- Akiyama T, Tanaka S. Bim: guardian of tissue homeostasis and critical regulator of the immune system, tumorigenesis and bone biology. Arch Immunol Ther Exp. 2011;59(4):277-287.
- Ludwinski MW, Sun J, Hilliard B, Gong S, Xue F, Carmody RJ, et al. Critical roles of Bim in T cell activation and T cell–mediated autoimmune inflammation in mice. J Clin Invest. 2009;119(6):1706-13.
- Wang YM, Zhang GY, Wang Y, Hu M, Zhou JJ, Sawyer A, et al. Exacerbation of spontaneous autoimmune nephritis following regulatory T cell depletion in B cell lymphoma 2‐interacting mediator knock‐out mice. Clin Exp Immunol. 2017;188(2):195-207.
- Bouillet P, Metcalf D, Huang DC, Tarlinton DM, Kay TW, Köntgen F, et al. Proapoptotic Bcl-2 relative Bim required for certain apoptotic responses, leukocyte homeostasis, and to preclude autoimmunity. Science. 1999;286(5445):1735-1738.
- Chen M, Huang L, Wang J. Deficiency of Bim in dendritic cells contributes to overactivation of lymphocytes and autoimmunity. Blood. 2007;109(10):4360-4367.
- Soldati C, Caramanica P, Burney MJ, Toselli C, Bithell A, Augusti‐Tocco G, et al. RE1 silencing transcription factor/neuron‐restrictive silencing factor regulates expansion of adult mouse subventricular zone‐derived neural stem/progenitor cells in vitro. J Neurosci Res. 2015;93(8):1203-1214.
- Covey MV, Streb JW, Spektor R, Ballas N. REST regulates the pool size of the different neural lineages by restricting the generation of neurons and oligodendrocytes from neural stem/progenitor cells. Development. 2012;139(16):2878-2890.
- Menzel L, Paterka M, Bittner S, White R, Bobkiewicz W, van Horssen J, et al. Down-regulation of neuronal L1 cell adhesion molecule expression alleviates inflammatory neuronal injury. Acta Neuropathol. 2016;132(5):703-720.
- Bergsland M, Covacu R, Perez Estrada C, Svensson M, Brundin L. Nitric Oxide‐Induced Neuronal to Glial Lineage Fate‐Change Depends on NRSF/REST Function in Neural Progenitor Cells. Stem Cell. 2014;32(9):2539-2549.
Citation: Tang J, Ye Z, Liu Y, Zhou M, Qin C (2021) Differential Transcription Profiling in Bone Marrow Mononuclear Cells between Myasthenia Gravis Patients with or without Thymoma. J Vaccines Vaccin. 12:463.
Copyright: © 2021 Tang J et al. This is an open-access article distributed under the terms of the Creative Commons Attribution License, which permits unrestricted use, distribution, and reproduction in any medium, provided the original author and source are credited.
