Indexed In
- Genamics JournalSeek
- Academic Keys
- JournalTOCs
- China National Knowledge Infrastructure (CNKI)
- Access to Global Online Research in Agriculture (AGORA)
- Centre for Agriculture and Biosciences International (CABI)
- RefSeek
- Directory of Research Journal Indexing (DRJI)
- Hamdard University
- EBSCO A-Z
- OCLC- WorldCat
- Scholarsteer
- SWB online catalog
- Publons
- Euro Pub
- Google Scholar
Useful Links
Share This Page
Journal Flyer
Open Access Journals
- Agri and Aquaculture
- Biochemistry
- Bioinformatics & Systems Biology
- Business & Management
- Chemistry
- Clinical Sciences
- Engineering
- Food & Nutrition
- General Science
- Genetics & Molecular Biology
- Immunology & Microbiology
- Medical Sciences
- Neuroscience & Psychology
- Nursing & Health Care
- Pharmaceutical Sciences
Research Article - (2024) Volume 15, Issue 4
Development of Lassi For Lactose Intolerance People
Shruti Nagrale*, Samudre S. P, Lokhande S. M and Sahoo A. KReceived: 16-Sep-2019, Manuscript No. JFPT-24-2266; Editor assigned: 19-Sep-2019, Pre QC No. JFPT-24-2266 (PQ); Reviewed: 03-Oct-2019, QC No. JFPT-24-2266; Revised: 01-Aug-2024, Manuscript No. JFPT-24-2266 (R); Published: 29-Aug-2024, DOI: 10.35248/2157-7110.24.15.1118
Abstract
Buffalo milk which was used to prepare lassi had moisture, total solids, fat, solid non fat, protein, lactose, glucose and galactose content of 83.6%, 16.4%, 6.92%, 9.42% and 3.79%, 4.87%, 0.01% and 0.18% respectively. The average acidity and pH of buffalo milk were 0.13% and 6.64 respectively. By various methods like lane and eynon, Fourier Transform Infrared Spectroscopy (FTIR) and spectrophotometer it was not possible to differentiate between lactose, glucose and galactose. So by High Performance Liquid Chromatography Evaporative Light Scattering Detector (HPLC-ELSD) different concentrations of lactase enzyme that is 5%, 2%, 1% of buffalo milk sample and lassi sample having 1% lactase enzyme were analyzed for lactose percent. The lactose was 0% for all above concentrations. Glucose and galactose resulting from hydrolysis of lactose are sweeter than lactose, and thereby increase the sweetness of the lactose-free lassi. So lassi sample A, sample B, sample C, sample D were prepared by varing sugar concentrations. Control sample had hedonic score 8.5. Lassi sample A, sample B, sample C had average of 7.0, 7.0, 7.7 and sample D had 8.0 hedonic score. So, sample D was selected on the basis of sensory analysis and overall acceptability. The lassi sample D of 12% sugar added and 1% lactase enzyme added was further analyzed which had average of moisture, total solid, fat and lactose content of 81.22%, 18.78%, 3.1% and 0% respectively. The acidity and pH of lassi were 0.54% and 4.44 respectively. By shelf life analysis of lassi sample D it was found to be 10 days acceptable in food grade polystyrene cups. By microbial analysis of lassi sample D the coliform count on prepared day and on 12th day was not detected. Similarly the yeast mold count was not detected on prepared day but it was 70 cfu/ml on the 12th day.
Keywords
Lactose intolerance people; Lactase enzyme; Lactose-free lassi; Protein
Introduction
Milk and milk products contain high concentrations of the disaccharide lactose. Lactose is a disaccharide consisting of glucose and galactose. It is found in milk and other dairy products. The concentration of lactose in cow's milk it is about 5%. The ability to digest lactose depends on the presence of an enzyme (lactase) located in the small intestinal brush border. The monosaccharides are then absorbed by active transport [1].
People with lactose intolerance have difficulty in digesting milk sugars (lactose) from dairy products due to insufficient amounts of the gut enzyme called lactase. This enzyme is produced in the small intestine and is responsible for breaking lactose down into two smaller sugars, glucose and galactose, to allow these sugars to be absorbed into the bloodstream. As milk and dairy products are used extensively in the food industry, many people are also intolerant to a wide range of foods.
If the activity of lactase is low in the relation to the amount of lactose ingested, the lactose cannot be hydrolysed to its components, resulting in maldigestion. This situation is called hypolactasia (lactase nonpersistence, lactase restriction). The term for the opposite of hypolactasia is normolactasia (lactase persistence) and is applied to those with moderate or high (normal) lactase activity. Lactose maldigestion and lactose malabsorption are terms to describe a poor lactose hydrolysing capacity. The term lactose intolerance should only be used for a clinical entity, describing symptomatic lactose maldigestion [2].
Reasons for lactose maldigestion can be classified as congenital lactase deficiency (almost total lack of lactase, alactasia), hypolactasia (general lactose maldigestion) and secondary hypolactasia (due to reversible injury in the gastrointestinal tract).
Lactose-intolerance occurs when the human body is unable to produce the lactase enzyme required to break down lactose to glucose and galactose for the body to metabolize. As a result, the lactose is fermented in the intestine where it can produce unpleasant conditions such as gas, bloating and diarrhea. Commercial lactose-free milk contains less than 0.25 g lactose per 100 g of milk and is manufactured via enzymatic hydrolysis by breaking down the lactose in milk to glucose and galactose. Lactose usually is present in milk at levels of 4 g/100 mL-6 g/100 mL. Glucose and galactose resulting from hydrolysis of lactose are sweeter than lactose and thereby can increase the sweetness of the lactose-free milks [3].
Lactose content can also be reduced in liquid milk products by lactic acid fermentation. Buttermilk, kefir and yoghurt have traditionally been produced and consumed instead of ordinary milk. In these products approximately 30% of lactose is converted.
Lactase activity has a typical genetically-determined pattern during mammalian life. This activity increases in late gestation and remains at a high level during early childhood, where after it declines to the lower adult level. Hypolactasia may develop as a secondary condition in people already suffering from other gastrointestinal diseases such as celiac disease or enteritis.
The most commonly used methods of diagnosing hypolactasia are the indirect measurements of the breakdown products of lactose following an oral dose. Reduced increase in blood glucose concentration, increase in exhaled breath hydrogen or excreted urinary galactose all indicate hypolactasia.
The use of laboratory methods for diagnosing lactose intolerance (i.e., symptomatic lactose maldigestion) is not sufficient. During a lactose tolerance test the development of gastrointestinal symptoms must always be recorded side by side with the laboratory results. Unhydrolysed lactose is transported to the colon and fermented by colonic bacteria into short-chain fatty acids and gases (hydrogen, carbon dioxide and methane). The development of gastrointestinal symptoms depends on the balance between the production and the removal of these fermentation products. If the disposal capacity is exceeded, excessive rectal gas and/or abdominal distension occur [4].
Treatment to reduce lactose exposure, while maintaining calcium intake from dairy products, consists of a lactose restricted diet or the use of milk in which the lactose has been prehydrolyzed via treatment with lactase supplements. Lactase supplements taken at the time of milk ingestion also are commercially available.
It is discussed in Europe, how the lactose content of lactose-free food products will be defined. For example, the working group issues of nutrition of the german society of food chemistry has recommended three categories of food declaration, i.e., the low in lactose level for food products of ≤ 1% lactose, very low in lactose level (≤ 0.1%) and lactose-free level (≤ 0.01% of lactose and its degradation products).
Lactose intolerance people
The lactose intolerant among south Indians is 66.6% as compared with north Indians is 27.4% and the western parts of Indian subcontinent indicate the incident to be around 50%-60% [5].
Materials and Methods
Materials
Lactococcus lactis spp. lactis, Lactococcus lactis spp. cremoris and Streptococcus thermophilus were purchased from National Dairy Research Institute (NDRI), Karnal, Haryana, India β- galactosidase was purchased from Chr. Hansen, Mumbai. β- galactosidase was from kluyveromyces lactis yeast. Food grade plastic cups made up of polystyrene were used for packaging of lassi.
Final product formulation of lassi
The lassi was prepared by taking 3 liters of buffalo milk and then the treatment of lactase enzyme 1% was given to buffalo milk then after that inoculated 2% of curd culture into buffalo milk. Then the curd was set at 37°C for 6 hrs. After that the curd was homogenized and then water 40% and sugar 12% with salt 0.1% was added (Figure 1).
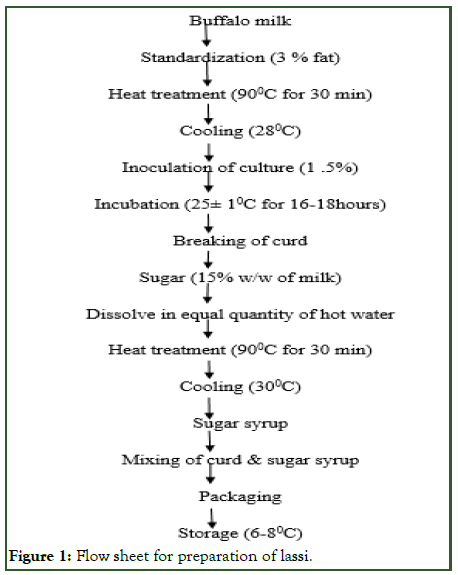
Figure 1: Flow sheet for preparation of lassi.
Proximate analysis: Titrable acidity was determined by titration of the sample with sodium hydroxide to phenopthalein end point will be pink colour. The pH of milk was measured through electronic digital pH meter (Analab μpHcal103 point calibration). Moisture was determined by using hot air oven drying method. Total solids were determined by gravimetric method fat content was determine by Gerber method. SNF of milk was determine by subtracting the fat percentage from the total solids. The protein content is determined by pyne’s method. Lactometer (ISI) was used for rapid determination of specific gravity of milk. Lactose was determine by Fourier Transform Infrared Spectroscopy (FTIR) technology (FT-1). It was estimated by spectrophotometry. It was also estimated by high performance liquid chromatography evaporative light scattering detector HPLC-ELSD. Sensory evaluation of prepared samples was done by using 9 point hedonic scale by a panel of 10 semi trained panel members [6]. In microbial analysis coliform count and yeast and mould count was carried out of lassi.
Results and Discussion
Physicochemical analysis of buffalo milk
Buffalo milk had an average moisture, total solids, fat, solid non fat and protein content of 83.6%, 16.4%, 6.92%, 9.42% and 3.79% respectively. The average lactose, glucose and galactose content were 4.87%, 0.01% and 0.18% respectively. The average acidity and pH of buffalo milk were 0.13% and 6.64 respectively. The specific gravity was 1.0297. Similar results were reported by Hashmi and Saleem.
Chemical analysis of curd
Chemical analysis of curd was carried out. Freeze dried powder of Streptococcus thermophilus (0.1 gm-0.2 gm) was incorporated into buffalo milk (200 ml) at 37°C in aseptic condition. Another cultures of Lactococcus lactis ssp. lactis and Lactococcus lactis ssp. cremoris were activated into buffalo milk at 30°C in aseptic condition. Master culture prepared by adding 2% of Streptococcus thermophilus and 1% of Lactococcus lactis ssp. lactis and 1% of Lactococcus lactis ssp. cremoris was activated in buffalo milk at 37°C respectively [7].
Streptococcus thermophilus had average acidity and pH of 0.77%and 4.25 respectively. Lactococcus lactis ssp. lactis had average acidity and pH of 0.75% and 4.23 respectively. Lactococcus lactis ssp. cremoris had average acidity and pH of 0.80% and 4.20. Master culture had average acidity and pH of 0.70% and 4.35 respectively.
Lactose content of buffalo milk and curd by lane and Eynon method
Lactose analysis of buffalo milk and curd was carried out by lane and eynon method. Master culture had average lactose of 3.39%. Buffalo milk had average lactose 4.52 percent after adding 2% lactase to this buffalo milk the average lactose was 4.52 percent.
Buffalo milk had average lactose 4.23% after adding 2% lactase to this buffalo milk the average lactose was 4.23%. There was no change in lactose content even after adding lactase enzyme (Figure 2).
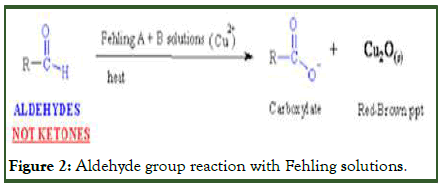
Figure 2: Aldehyde group reaction with Fehling solutions.
The aldehyde group of any carbohydrate react with Fehling A (copper sulphate pentahydrate) and Fehling B (potassium sodium tartrate tetrahydrate and sodium hydroxide) in presence of heat to give carboxylate and copper oxide of red brown precipitate. After testing standard glucose by lane and eynon method the colour changes to red brown. As glucose, galactose and lactose all have aldehyde group they react similarly with Fehling A and Fehling B in presence of heat to give carboxylate and red brown precipitate so this method cannot differentiate between glucose, galactose and lactose [8].
Lactose content of buffalo milk by spectrophotometer method
Lactose content of buffalo milk was estimated by spectrophotometer method. The concentrations of 0.50 mg/ml had absorbance of 0.119 at 540 nm. The concentrations of 0.50 mg/ml had absorbance of 0.119 at 540 nm. The concentrations of 0.75 mg/ml had absorbance of 0.134 at 540 nm. The concentrations of 1 mg/ml had absorbance of 0.143 at 540 nm. The concentrations of 1.25 mg/ml had absorbance of 0.150 at 540 nm.The concentrations of 1.50 mg/ml had absorbance of 0.164 at 540 nm. The concentrations of buffalo milk had absorbance of 0.157 at 540 nm. By calculating through graph we get the following results.
The Figure 3 shows graph of concentration versus absorbance at 540 nm. From graph: Concentration of lactose in buffalo milk=1.375 mg/ml=137.5 mg/100 ml, but buffalo milk lactose range is=4.8 gm/100 ml=4800 mg/100 ml.
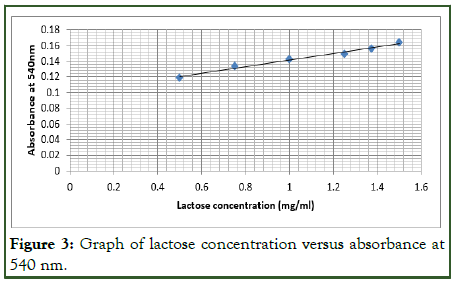
Figure 3: Graph of lactose concentration versus absorbance at 540 nm.
Buffalo milk range was greater than the spectrophotometric reading. This method is based upon reaction of lactose with methylamine in hot alkaline solution to form a red complex which absorbs at 540 nm. As glucose, galactose and lactose all have aldehyde group react with methylamine in hot alkaline solution to form a red complex so this method cannot differentiate between glucose, galactose and lactose [9].
Lactose content of buffalo milk by FTIR method
Buffalo milk analysis by FTIR method was carried out. In this methodology buffalo milk had average lactose, glucose and galactose of 4.96%, 0.01%, 0.08% after adding 0.5% of lactase after 1 hr the average lactose, glucose, galactose content 5.49%, 2.51% and 2.57% and after 2 hrs the average lactose, glucose, galactose content 5.49%, 2.53% and 2.57% respectively.
Lactose content of buffalo milk and lassi by HPLCELSD method
Lactose analysis of buffalo milk and lassi was carried out by using High Performance Liquid Chromatography Evaporative Light Scattering Detector (HPLC-ELSD) method. Buffalo milk had lactose of 4.42% and when lactase enzyme of 5%, 2% and 1% were added to buffalo milk the lactose content for all concentration was 0%. As it is economical to use 1% of lactase enzyme thus 1% added lactase enzyme was selected for further study. Lactase enzyme was added buffalo milk from that curd was set by adding master culture and lassi was prepared and then the lactose percent was determined which was also 0% [10].
Standard lactose of 1000 ppm was analyzed and presented in Figure 4. The lactose standard was between 30 and 35 min which gave the peak of standard lactose of 1000 ppm. The area of the peak was 7808833721 cm2 and retention time was 31.917 min.
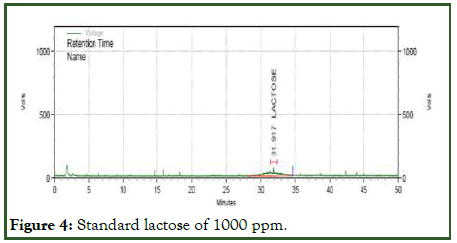
Figure 4: Standard lactose of 1000 ppm.
Standard lactose of 2000 ppm was analyzed and presented in Figure 5. Lactose standard was between 28 and 35 min which gave the peak of standard lactose of 2000 ppm. The area of the peak was 19386649289 cm2 and retention time was 31.950 min.
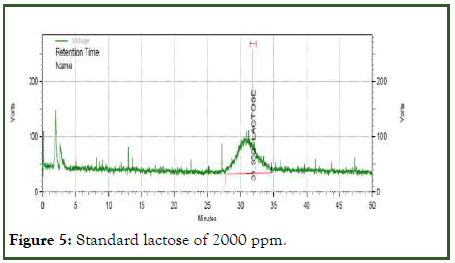
Figure 5: Standard lactose of 2000 ppm.
Buffalo milk sample was analyzed and presented in Figure 6. The buffalo milk sample peak is as shown in Figure 6 between 28 and 35 min. The area of the peak was 43538157339 cm2 and retention time was 30.317 min. By calculation the lactose content of buffalo milk was 4.42% [11].
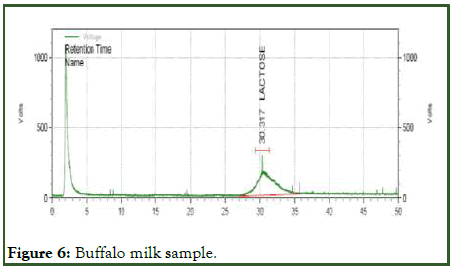
Figure 6: Buffalo milk sample.
Lactase enzyme (5%) added to buffalo milk was analyzed and presented in Figure 7. As shown in Figure 4 the peak is in between 30 and 35 min and there is no peak in Figure 7. So, for 5% lactase enzyme addition lactose content was not detected.
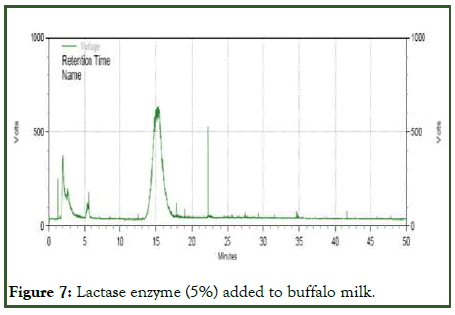
Figure 7: Lactase enzyme (5%) added to buffalo milk.
Lactase enzyme (2%) added to buffalo milk was analyzed and presented in Figure 8. As shown in Figure 4 the peak is in between 30 and 35 min and there is no peak in Figure 8. So for 2% lactase enzyme addition lactose content was not detected.
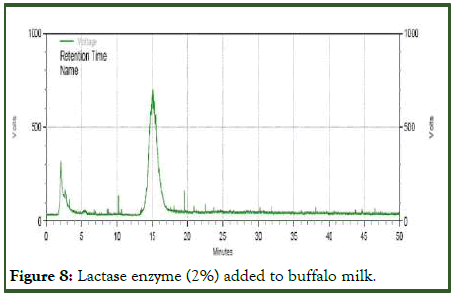
Figure 8: Lactase enzyme (2%) added to buffalo milk.
Lactase enzyme (1%) added to buffalo milk was analyzed and presented in Figure 9. As shown in Figure 4 the peak is in between 30 and 35 min there is no peak in Figure 9. So, for 1% lactase enzyme addition lactose content was not detected [12].
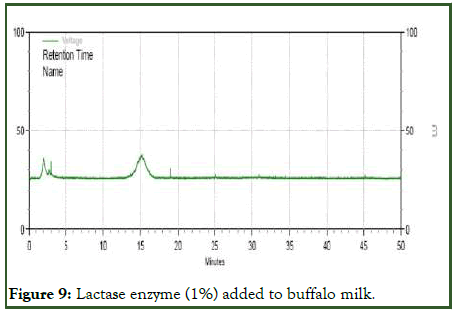
Figure 9: Lactase enzyme (1%) added to buffalo milk.
Lactase enzyme (1%) added lassi was analyzed and presented in Figure 10. As shown in Figure 4 the peak is in between 30 and 35 min. and there is no peak in Figure 10. So, by for 1% lactase enzyme addition lactose content was not detected.
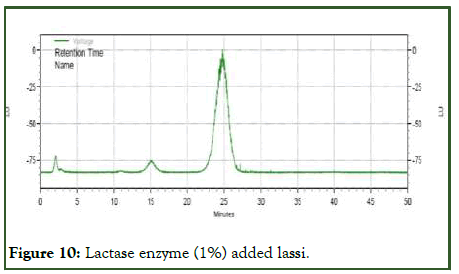
Figure 10: Lactase enzyme (1%) added lassi.
Conclusion
Master culture of 2% was inoculated in the buffalo milk by combination of Lactococcuslactis ssp. lactis, Lactococcuslactis ssp. Cremoris and Streptococcus thermophilus for prepared lassi as they act as a probiotic. So it may promote intestinal health, improve the immune system to help to maintain health, prevent chronic diseases like cancer, high blood pressure, obesity, diabetes and improve mental health. The lassi was prepared by using lactase enzyme of 1% concentration. This enzyme breakdown the lactose into glucose and galactose there by increases the sweetness of the product, so less amount of sugar is required for the product. There is no change in the calorific value of the product. Hence the prepared lassi was lactose free and will be beneficial for lactose intolerance people and the curd cultures present in the lassi are usefull as probiotic.
References
- Arola H. Diagnosis of hypolactasia and lactose malabsorption. Scand J Gastroenterol Suppl. 1994;202:26-35.
[Crossref] [Google Scholar] [PubMed]
- Adhikari K, Dooley LM, Chambers IV E, Bhumiratana N. Sensory characteristics of commercial lactose-free milks manufactured in the United States. LWT-Food Sci Tech. 2010;43(1):113-118.
- Ahmad S, Gaucher I, Rousseau F, Beaucher E, Piot M, Grongnet JF, et al. Effects of acidification on physico-chemical characteristics of buffalo milk: A comparison with cow’s milk. Food Chem. 2008;106(1):11-17.
- Bhattarai RR, Das SK. Scientific study on the indigenous technology of dahi making of eastern Nepal. J Food Process Tech. 2013;4(8):1000253.
- Bury D, Jelen P, Kalab M. Disruption of Lactobacillus delbrueckii ssp. bulgaricus 11842 cells for lactose hydrolysis in dairy products: A comparison of sonication, high-pressure homogenization and bead milling. Innov Food Sci Emerg Technol. 2001;2(1):23-29.
- Campbell AK, Wann KT, Matthews SB. Lactose causes heart arrhythmia in the water flea Daphnia pulex. Comp Biochem Physiol B Biochem Mol Biol. 2004;139(2):225-234.
[Crossref] [Google Scholar] [PubMed]
- Rodriguez-Colinas B, Fernandez-Arrojo L, Ballesteros AO, Plou FJ. Galactooligosaccharides formation during enzymatic hydrolysis of lactose: Towards a prebiotic-enriched milk. Food Chem. 2014;145:388-394.
- Deng Y, Misselwitz B, Dai N, Fox M. Lactose intolerance in adults: Biological mechanism and dietary management. Nutrients. 2015;7(9):8020-8035.
[Crossref] [Google Scholar] [PubMed]
- Minelli EB, Benini A, Marzotto M, Sbarbati A, Ruzzenente O, Ferrario R, et al. Assessment of novel probiotic Lactobacillus casei strains for the production of functional dairy foods. Int Dairy J. 2004;14(8):723-736.
- Brown-Esters O, Mc Namara P, Savaiano D. Dietary and biological factors influencing lactose intolerance. Int Dairy J. 2012;22(2):98-103.
- Fischer J, Guidini CZ, Santana LN, de Resende MM, Cardoso VL, Ribeiro EJ. Optimization and modeling of lactose hydrolysis in a packed bed system using immobilized β-galactosidase from Aspergillus oryzae. J Mol Catal B Enzym. 2013;85:178-186.
- Frizzo LS, Soto LP, Zbrun MV, Signorini ML, Bertozzi E, Sequeira G, et al. Effect of lactic acid bacteria and lactose on growth performance and intestinal microbial balance of artificially reared calves. Livest Sci. 2011;140(1-3):246-252.
Citation: Nagrale S, Samudre SP, Lokhande SM, Sahoo AK (2024) Development of Lassi For Lactose Intolerance People. J Food Process Technol. 15:1118.
Copyright: © 2024 Nagrale S, et al. This is an open-access article distributed under the terms of the Creative Commons Attribution License, which permits unrestricted use, distribution, and reproduction in any medium, provided the original author and source are credited.
