Indexed In
- Open J Gate
- Genamics JournalSeek
- Academic Keys
- JournalTOCs
- The Global Impact Factor (GIF)
- China National Knowledge Infrastructure (CNKI)
- Ulrich's Periodicals Directory
- RefSeek
- Hamdard University
- EBSCO A-Z
- OCLC- WorldCat
- Publons
- Geneva Foundation for Medical Education and Research
- Euro Pub
- Google Scholar
Useful Links
Share This Page
Journal Flyer

Open Access Journals
- Agri and Aquaculture
- Biochemistry
- Bioinformatics & Systems Biology
- Business & Management
- Chemistry
- Clinical Sciences
- Engineering
- Food & Nutrition
- General Science
- Genetics & Molecular Biology
- Immunology & Microbiology
- Medical Sciences
- Neuroscience & Psychology
- Nursing & Health Care
- Pharmaceutical Sciences
Research Article - (2017) Volume 8, Issue 6
Development and Validation of RP-HPLC Method for Simultaneous Determination of Diclofenac Sodium and Eperisone Hydrochloride in Pharmaceutical Dosage Form
Abstract
The RP-HPLC (Reversed-Phase High-Performance Liquid Chromatography) method was developed for the simultaneous determination of Eperisone Hydrochloride and Diclofenac Sodium in capsule dosage form. After that optimization good chromatographic separation was achieved by Isocratic mode with a mixture of Acetonitrile: Phosphate buffer pH-5.8 in the ratio 55:45 v/v as the mobile phase and detection wavelength of 225 nm. The drud retention times for Eperisone Hydrochloride and Diclofenac Sodium found to be 3.143 min and 4.753 min respectively. The linearity, this method was found in the concentration range of 90-210 μg/ml for Eperisone Hydrochloride and 60-140 μg/ml for Diclofenac Sodium. The LOD and LOQ for Eperisone Hydrochloride were found to be 1.55 and 4.71 μg/ml respectively. The LOD and LOQ for Diclofenac Sodium were found to be 2.08 and 6.31 μg/ml respectively. This method was found to be good as the percentage recovery for Eperisone Hydrochloride and Diclofenac Sodium were found to be 100.86 and 99.81 respectively, which indicates that the proposed method is highly accurate. The specificity of the method shows good correlation between retention times of standard with the drug so, the sample without interference from excipients of capsule dosage form.Keywords: UV spectrophotometer; Eperisone HCl; Diclofenac sodium; High Performance Liquid Chromatography (HPLC)
Introduction
Chromatography is the technique in which the components in a mixture of sample separated by passing through stationary phase with aid of mobile phase. The components which have more affinity with mobile phase elute faster than others. HPLC is the fastest growing analytical technique for analysis of drugs. Its simplicity, high specificity and wide range of sensitivity make it ideal for the analysis of many drugs in various dosage forms and biological fluids. The HPLC is the vital tool in the field of analysis of various pharmaceutical dosage forms, since this method is specific, robust, linear, precise and accurate and the limit of detection is low. The method development is an integral part of the method validation. Establishing documented evidence, provides that a specific activity will consistently produce a desired result or product meeting its predetermined specifications and quality characteristics of the samples [1-14].
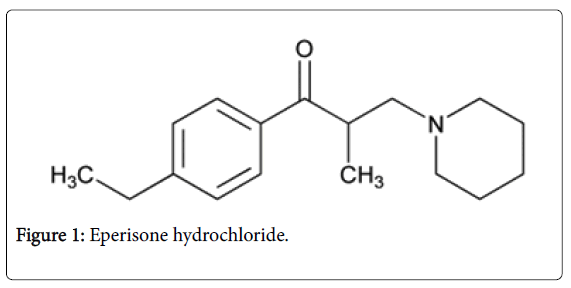
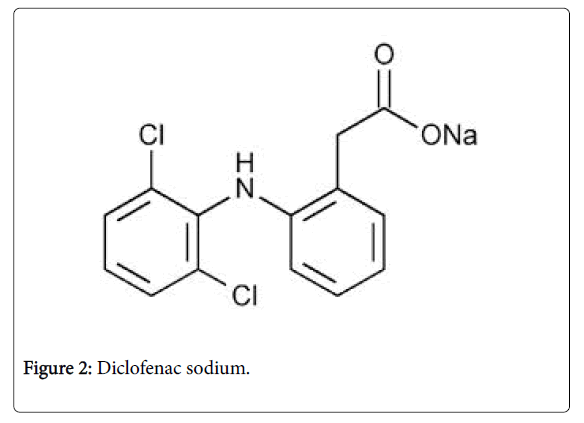
The validation parameters are Specificity, linearity, Accuracy, LOD, LOQ, Precision, Range, Robustness, System suitability (Figures 1 and 2).
Drug profile
IUPAC name: 1-Propanone,1-(4-ethylphenyl)-2-methyl-3-(1- piperidinyl)-, hydrochloride.
Molecular formula: C17H26NOCl
Molecular weight: 295.89
Category: Muscle relaxant.
Description: White crystalline powder.
Solubility: Freely soluble in water, methanol, and acetic acid.
Storage: Eperisone hydrochloride should be stored at temperatures not exceeding 30oC, and should be protected from moisture after opening package.
IUPAC name: 2-[(2-aminoethoxy)methyl]-4-(2-chlorophenyl)-3- ethoxycarbonyl-5-methoxycarbonyl-6-methyl-1, 4-dihydropyridine benzenesulfonate.
Molecular formula: C20H25ClN2O5•C6H6O3S
Molecular weight: 567.05
Category: Anti-hypertensive (calcium channel blocker).
Description: White powder.
Solubility: Slightly soluble in distilled water and sparingly soluble in ethanol.
Storage: Diclofenac Sodium should be kept in a tightly closed container, protected from light.
Material and Methods
Instruments
UV-Visible Spectrophotometer, HPLC, Ultra sonicator, pH meter, Electronic balance, Syringe, HPLC Column
Chemicals
Sodium dihydrogen ortho phosphate, acetonitrile, water, ethanol, Ammonium acetate, sodium hydroxide, hydrochloric acid, disodium hydrogenphophate.
Preparation of 0.05 M potassium dihydrogen phosphate buffer pH 5.8: 1.6 g of potassium dihydrogen phosphate and 0.3 g dipotassium hydrogen Phosphate was weighed dissolved in 100 ml of water and make up to 550 ml with water. To the above solution 450 ml of Acetonitrile was added. The buffer was filtered through 0.45 μm membrane filters to remove all fine particles and gases.
Results and Discussion
Preparation of standard solution
About 150 mg of EP and 100 mg of DF were weighed into a 100 ml volumetric flask, to this 25 ml of liquid mobile phase was added.
Dilutions
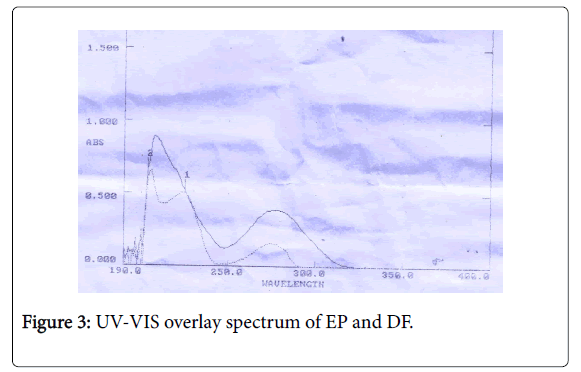
Necessary dilutions are made from the standard stock solutions to get the concentration range 10 μg/ml of EP and DF (Figure 3).
Preparation of standard stock solution
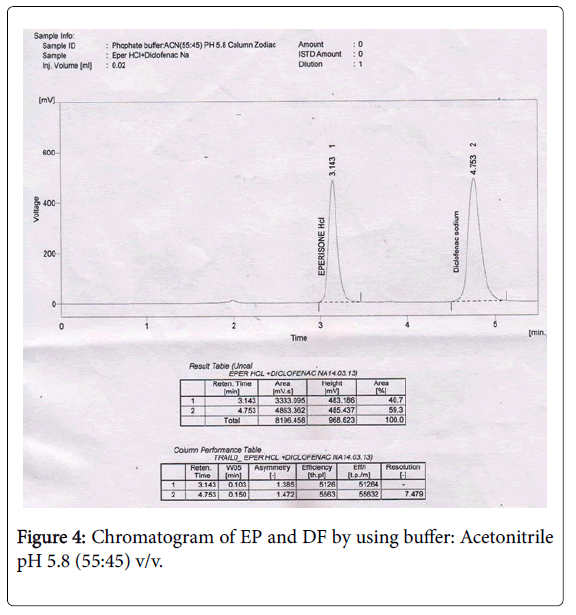
Weighed accurately 1.5 mg of EP and 1 mg of DF in 50 ml of volumetric flask and make up the volume using mobile phase. From above stock solution 1 ml of EP and DF were diluted to 10 ml with mobile phase. From the above solution 1.5 ml of EP and 1 ml of DF is taken into vial. This method was finalized for the simultaneous determination of EP and DF (Figure 4).
The EP peak was observed at 3.143 min with peak area 3333.095, theoretical plates 5126 and tailing factor 1.385. The DF peak was observed at 4.753 min with peak area 4863.362, theoretical plates 5563 and tailing factor 1.472. The Retention time of EP and DF are satisfactory and this trial is less solvent consuming and less time consuming with good resolution.
Precision
Precision was determined by using sample solutions of concentration EP (80 μg/ml) and DF (8 μg/ml) for six times are prepared separately. The chromatograms were recorded and the results were summarized % RSD of retention time and peak areas obtained for EP were 0.76 and 1.93 respectively and for DF were 1.11 and 1.76 respectively (Table 1).
| Injection | EP | DF | ||
|---|---|---|---|---|
| Rt | Area | Rt | Area | |
| 1 | 3.307 | 5588.309 | 5.273 | 6877.737 |
| 2 | 3.297 | 5580.255 | 5.24 | 6868.255 |
| 3 | 3.29 | 5561.278 | 5.227 | 6981.498 |
| 4 | 3.277 | 5442.266 | 5.2 | 6748.14 |
| 5 | 3.27 | 5649.455 | 5.213 | 6634.942 |
| 6 | 3.237 | 5362.187 | 5.103 | 6796.623 |
| Average | 3.2797 | 5530.63 | 5.209 | 6817.866 |
| SD | 0.0248 | 106.798 | 0.058 | 119.727 |
| %RSD | 0.76 | 1.93 | 1.11 | 1.76 |
Table 1: Method precision results for EP and DF.
% RSD of 6 determinations of EP and DF for system precision found within the acceptance criteria of less than 2.0%.
Linearity and range
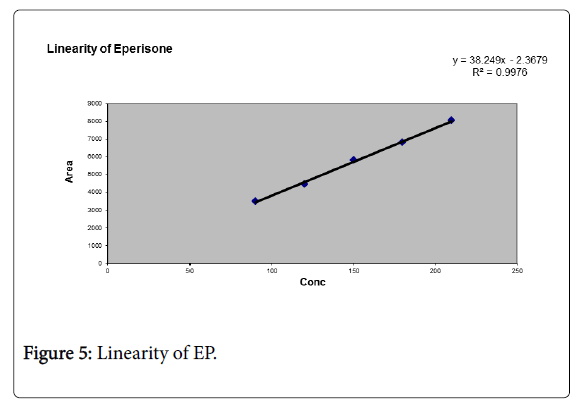
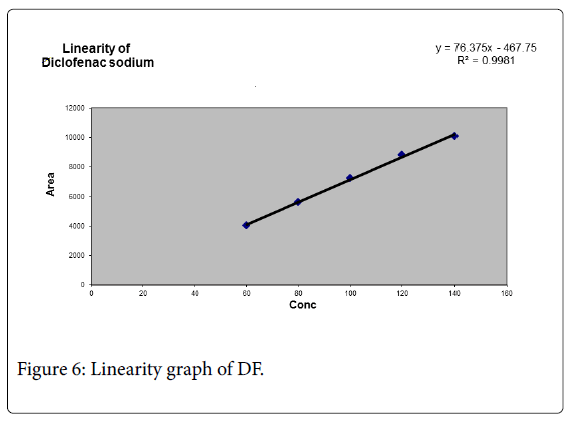
A graph was plotted for EP and DF against the concentrations of the solutions and the peak areas. The correlation coefficient R2 was determined and the linearity was found to be 0.997 for EP and 0.998 for DF (Tables 2 and 3; Figure 5).
| S. No. | Concentration (µg/ml) | Area |
|---|---|---|
| 1 | 90 | 3500.371 |
| 2 | 120 | 4461.359 |
| 3 | 150 | 5830.577 |
| 4 | 180 | 6828.29 |
| 5 | 210 | 8054.241 |
Table 2: Linearity data of EP.
| S. No. | Concentration (µg/ml) | Area |
|---|---|---|
| 1 | 60 | 4048.701 |
| 2 | 80 | 5632.602 |
| 3 | 100 | 7256.338 |
| 4 | 120 | 8817.203 |
| 5 | 140 | 10093.89 |
Table 3: Linearity data of DF.
Correlation coefficient of linear curve obtained and the graph between concentration vs. Area for standard preparations of EP and DF is 0.997 and 0.998 respectively.
Limit of Detection (LOD) and Limit of Quantitation (LOQ)
The LOD for this method was determined to be 0.09 μg/ml for EP and 0.07 μg/ml for DF respectively. The LOQ for this method was determined to be 0.27 μg/ml for EP and 0.23 μg/ml for DF respectively.
Specificity
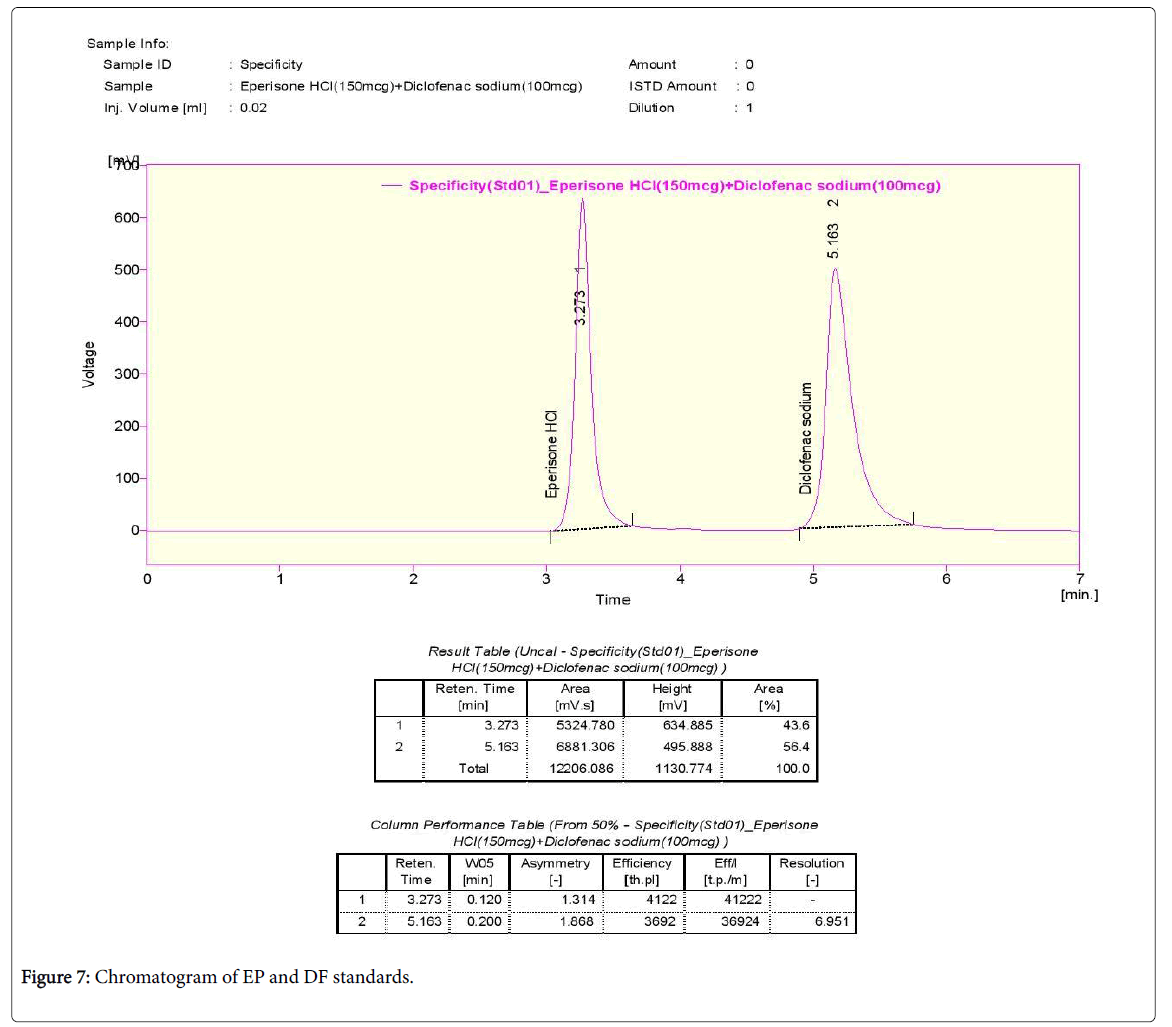
Preparation of standard stock solution: A standard stock solution of EP and DF (mg/ml) was prepared and dissolving 150 mg of EP and 100 mg of DF in 100 ml of mobile phase. The above solution is filtered by using 0.45-micro filter and sonicated for 5 min. Further dilution of 150 μg/ml of EP and 100 μg/ml.
The standard solution was injected thrice and the chromatogram was recorded and the retention times for EP and DF were found to be 2.373 and 5.163 min respectively.
Accuracy
To the formulation (pre analysed sample), the reference standards of the drugs were added at the level of 80%, 100%, 120%, the method was determined by recovery studies.
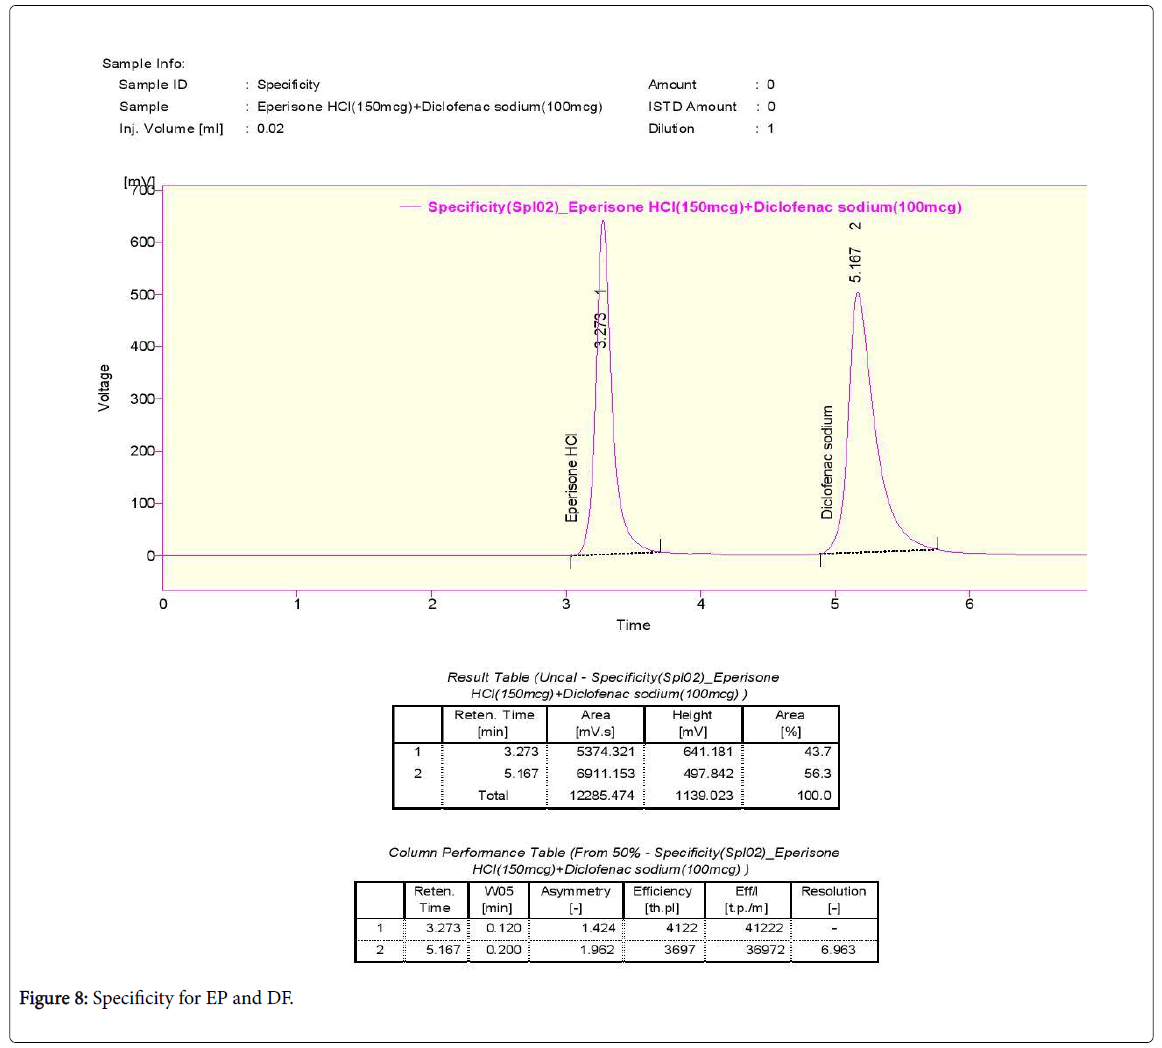
Tablet sample preparation: 150 mg of EP and 100 mg of DF combined tablets was taken into a mortar and crushed to fine powder and mixed. Tablet stock solutions of EP and DF (microgram/ml) were prepared by dissolving equivalent weight 150 mg of EP and 100 mg of DF in 50 ml of mobile phase. The above solution is filtered by using 0.45-micron syringe filter and sonicated for 5 min. Further dilution of 150 μg/ml of EP and 100 μg/ml was made.
The tablet sample solution was injected thrice and the chromatogram was recorded and the retention times for EP and DF were 3.273 and 5.167 min respectively (Table 4).
| Chromatographic changes | Retention time(min) | Tailing factor | |||
|---|---|---|---|---|---|
| EP | DF | EP | DF | ||
| Flow rate (ml/min) | 0.8 | 4.1 | 6.253 | 1.256 | 1.852 |
| 2.1 | 2.77 | 4.28 | 1.429 | 2.057 | |
| Wavelength (nm) | 219 | 2.27 | 5.137 | 1.324 | 1.963 |
| 223 | 3.25 | 5.083 | 1.294 | 1.968 | |
Table 4: Retention time and Tailing factor of EP and DF.
The tailing factor was found to be within the limits on small variation of flow rate and wavelength (Figures 6-8).
Conclusion
The optimum wavelength for the estimation of DF and EP was selected at 225 nm on the basis of isobestic point. The various trials were performed with using different mobile phases in different ratios, but Phosphate buffer (pH 5.8): Acetonitrile (55:45) was selected and find the good peak and resolution. The retention time of EP and DF were found to be 3.143 and 4.753 min respectively. The retention times for both the drugs were considerably less compared to the retention time obtained for the drugs in the other mobile phase.
Different analytical techniques used such as linearity, precision, accuracy, and specificity, LOD, LOQ were estimated and calibration curve for EP was obtained by plotting peak area versus the concentration over the range of 90-210 μg/ml For EP and 60-140 μg/ml for DF. From linearity the correlation coefficient R2 value was found to be 0.997 for EP and 0.998 for DF.
RP-HPLC method was also validated for suitability and method precision. The % RSD in the peak area of drug was found to be less than 2%. The number of theoretical plates was found to be more than 4000, which indicates efficient performance of the column. The limit of detection of EP and DF were found to be 1.55 ppm and 2.08 ppm and limit of quantitation were 4.71 ppm and 6.31 ppm respectively, indicates the sensitivity of the method. The percentage of recovery of EP and DF were found to be 99.72 and 99.84 respectively shows that the proposed method is highly accurate.
Hence the proposed method is highly accurate, precise and sensitive and it is successfully applied for the quantification methods of API formulations. This content is use full in the commercial formulations of EP and DF in Educational institutions and Quality control laboratories.
Acknowledgments
I am grateful to express my heartful thanks to my parents, VIPER Staff and also thanks for their experience advices and constant encouragement.
References
- Haritha G, Vishwanadham Y (2016) Development and validation of RP-HPLC method for simultaneous estimation of naproxen and esomeprazole in pharmaceutical dosage form. Asian J Res Chem 9: 366-368.
- Sandhya M, Vishwanadham Y, Umema (2016) Formulation and evaluation of atorvastatin calcium sustained release tablets. Int J Pharm 6: 124-130.
- Chatwal RG, Anand KS (2010) High performance liquid chromatography. Instrumental methods of chemical analysis. Himalaya Publishers.
- Sharma BK (2005) High performance liquid chromatography. Instrumental methods of chemical analysis (24th edn.). Goel Publishers, Meerut, India.
- Dong WM (2006) HPLC instrumentation and trends. Modern HPLC for practicing scientists, USA pp: 78-110.
- http://www.comsol.com/stories/waters_corp_hplc_systems/full/
- http://www.sanderkok.com/techniques/hplc/eluotropic_series_extended.html
- Swartz ME, Ira KS (2009) Analytical method development and validation (1st edn.). Marcel Dekker, Inc. 17-80, NY, USA.
- Satinder A, Dong MW (2005) Method development and validation. Pharmaceutical analysis by HPLC (15th edn.). NY, USA pp: 16-70.
- Snyder RL, Kirkland JJ, Glajch LJ (1997) Getting started. Practical HPLC method development (2nd edn.). NY, USA pp: 30-100.
- http://www.sigmaaldrich.com/etc/medialib/docs/Aldrich/General_Information/lDFbasics_pg144.Par.0001.File.tmp/lDFbasics_pg144.pdf.
- International Conference on Harmonisation (ICH) (1995) Text on validation of analytical procedures, ICH-Q2A. IFPMA, Geneva.
- International Conference on Harmonisation (ICH) (1996) Validation of analytical procedures: methodology, ICH-Q2B, International Conference on Harmonisation pp: 1-3.
- ICH Guidelines (2005) Q2 (R1)-validation of analytical procedures: Text and Methodology pp: 1-6.
Copyright: © 2017 Divya A, et al. This is an open-access article distributed under the terms of the Creative Commons Attribution License, which permits unrestricted use, distribution, and reproduction in any medium, provided the original author and source are credited.


