


Indexed In
- Genamics JournalSeek
- Academic Keys
- JournalTOCs
- China National Knowledge Infrastructure (CNKI)
- Access to Global Online Research in Agriculture (AGORA)
- Centre for Agriculture and Biosciences International (CABI)
- RefSeek
- Directory of Research Journal Indexing (DRJI)
- Hamdard University
- EBSCO A-Z
- OCLC- WorldCat
- Scholarsteer
- SWB online catalog
- Publons
- Euro Pub
- Google Scholar
Useful Links
Share This Page
Journal Flyer
Open Access Journals
- Agri and Aquaculture
- Biochemistry
- Bioinformatics & Systems Biology
- Business & Management
- Chemistry
- Clinical Sciences
- Engineering
- Food & Nutrition
- General Science
- Genetics & Molecular Biology
- Immunology & Microbiology
- Medical Sciences
- Neuroscience & Psychology
- Nursing & Health Care
- Pharmaceutical Sciences
Research Article - (2024) Volume 15, Issue 4
Determination of Vitamin C (Ascorbic Acid) in Some Fresh Fruits: A Comparative Evaluation of Methods
Adugna Nigatu Alene*, Teshager Mekonnen Tekaligne and Adere Tarekegne HabteReceived: 05-Sep-2019, Manuscript No. jfpt-24-2146; Editor assigned: 10-Sep-2019, Pre QC No. jfpt-24-2146 (PQ); Reviewed: 24-Sep-2019, QC No. jfpt-24-2146; Revised: 15-Jul-2024, Manuscript No. jfpt-24-2146 (R); Published: 12-Aug-2024, DOI: 10.35248/2157-7110.24.15.1115
Abstract
The present study deals with the determination of vitamin C (ascorbic acid) of the three fruits namely green pepper, tomato and potato using specrophotometric and titrimetric method and comparison of those of the two methods. The amount of ascorbic acid or vitamin C presented in green pepper, tomato and potato were 21.4765 g/L, 15.3907 g/L and 10.7521 g/L, respectively using spectroscopic measurement at 530 nm. While the amount ascorbic acid or vitamin C presented in green pepper, tomato and potato were 19.5360 g/L, 16.0912 g/L and 11.1351 g/L, respectively using redox titration method. The results obtained from this study revealed that there is no significant difference between the two methods, but the specrophotometric method has been preferred to determine the amount of vitamin C than the titrimetric method due to error minimization and simplicity of the measurement.
Keywords
Ascorbic acid; Fruits; Redox titration; Uv-Vis spectrophotometer
Introduction
Vitamin C, the L-enantiomer of ascorbic acid (2-oxo-L-threohexono- 1, 4-lactone-2,3enediol), is water-soluble vitamin, which is present in fresh fruits and vegetables. More than 90% of the vitamin C in human diets is supplied by fruits and vegetables. The amount of vitamin C in fruits depends on the precise variety of the fruit, the soil and climate in which it grew and the length of time since it was picked. Vitamin C is found in both reduced form (ascorbic acid) and oxidized form (dehydroascorbic acid). It is widely used food additive with many functional roles; many of those are based upon its oxidation-reduction properties [1]. Functional roles include its use as: A nutritition food additive, antioxidant (that scavenges free radicals), reducing agent, modifier and color stabilizer.
A lack of vitamin C in the diet causes the deficiency disease scurvy. This potentially fatal disease can be prevented with as little as 10 mg vitamin C per day, an amount easily obtained through consumption of fresh fruit and vegetables. Fruits and vegetables are the main sources of antioxidant vitamins, making these foods essential to human health [2].
Since green pepper, tomato and potato are major components of daily meals in many countries including Ethiopia, it is becoming increasingly important to be able to assess their nutritional value in terms of antioxidant vitamin content. Vitamin C is used to scavenge free radicals, produced through biological processes and in response to exogenous stimuli. Vitamin C also prevents oxidative stress occurs when free radical formation exceeds the ability to protect against them, what can lead to tissue injury after trauma, inflammatory events and chronic conditions, such as cardiovascular diseases, degenerative diseases and cancer.
Many analytical methods have been reported in the literature for the determination of the ascorbic acid contents in different foods sources. These include spectrophotometric, titration, chromatographic (HPLC), electrochemical, fluorimetric and chemiluminescent methods. The aim of this study was to set up a rapid spectrophotometric and a redoxtitrimetric method to quantify vitamin C or ascorbic acid concentration in green pepper, tomato and potato samples and compare the values using that of the two methods [3].
Materials and Methods
Chemicals, reagents and apparatus
All chemicals and reagents used in this study were of analytical grade. UV-visible spectrophotometer was also used for specrophotometric measurements.
Sample collection
Samples of food sources such as green pepper, tomato and potato were purchased from the local markets of Woldia town, Ethiopia. Those samples were transported in to the laboratory using ice box and then kept in the place of freezer till for further analysis [4].
Sample preparation for UV-Vis specrophotometric determination
The samples were prepared using the reported literature in with some modifications. The aqueous extracts for each edible portion of the three samples were prepared by weighing accurately 100 g of the freshly prepared fruit samples and blended vigoursly in a food processing machine to obtain the fruit juice by adding 60 mL of oxalic acid (0.5% w/v) in order to prevent the oxidation of ascorbic acid (vitamin C). Each of the mixtures was filtered through a precleaned cloth and then again filtered using wattmann no. 1 filter paper. The aliquot of each sample or the filtrates was transferred to a 100 ml volumetric flask and then completed to the mark with oxalic acid solution (0.5%). Blank was prepared by the same manner as except for the addition of fruit samples. Each of the three samples was treated separately as described under the general procedure.
Determination of ascorbic acid using UV-Vis spectrophotometer
Vitamin C or ascorbic acid concentration of the analyzed fruit samples such as green pepper, tomato and potato was measured according to the method with some modifications. Each of the three of fruit samples were accurately taken as 10.0 mL for each sample and then transferred into a small beaker and 1.0 mL of KMnO4 (100 μg/mL) was added for each as a chromogenic agent. Some amount of 5 M H2SO4 was used to dissolve the KMnO4 powder. The contents of each small beaker were mixed well and stand for 5 minutes. Ascorbic acid was used as a standard for making a calibration curve. The standard solution or stock solution of ascorbic acid (100 μg/mL) in 0.5% oxalic acid was prepared and made serious diluted solutions; 10 μg/mL, 20 μg/ mL, 30 μg/mL, 40 μg/mL and 50 μg/mL from the stock standard ascorbic acid solutions. 10 mL of each of the diluted standard solutions were taken and put in a small beaker and then 1 mL of KMnO4 solution (100 μg/mL) was added as a chromogenic agent. This solution was left to stand for 5 minutes. The absorbance of this standard solutions and prepared sample solutions were read at 530 nm against blank by spectrophotometer using a suitable concentration for the analysis [5].
Determination of ascorbic acid using titration method
Vitamin C or ascorbic acid concentration of the analyzed fruit samples was measured according to the methods with some modifications. Accurately 100 g of each of the fruit samples were weighed and blended in a food processor together with about 50 mL of oxalic acid (0.5%) and decanted off the liquid extract into a 100 mL volumetric flask. The ground fruits pulp was strained with a precleaned cloth and rinsed the pulp with a few 10 mL portions of oxalic acid. All the filtrates were collected in the volumetric flask. Then the volumetric flasks containing the filtrates were filled to 100 mL with oxalic acid. 1 mL of each of the freshly prepared fruit sample solution was transferred and then diluted to 200 mL with distilled water. Then 10 mL of each of these solutions were put into erlenmeyer flask. To this flask 5.0 mL of KI solution (0.2 M), 2.5 ml of hydrochloric acid HCl (1.0 M) and few drops of starch solution were added. Each of the three sample solutions was then titrared against KIO3 (0.015 M) until the appearance of blue-black color which indicate the end point of the reaction. The titration was done for each of the fruit samples as a triplicate [6].
Data analysis
All the data for ascorbic acid determination methods were recorded in triplicate as mean ± standard deviation and then analyzed with combination of microsoft excel 2010 and origin software.
Results and Discussion
Calibration curve of ascorbic acid
Calibration curve for the determination of ascorbic acid/ vitamin C in the prepared green pepper, tomato and potato with KMnO4 solution were constructed by plotting the absorbance versus concentrations (Beer’s Lambert law) as shown in (Figure 1).

Figure 1: Calibration curve of ascorbic acid.
Determination of ascorbic acid in the fruit samples using spectrophotometerVitamin C (ascorbic acid) concentrations of the three fruit samples such as green pepper, tomato and potato were measured in the same way for standard ascorbic acid determination using Uv-Vis spectrophotometer [7]. The absorbance of those sample solutions were measured and calculated sample solutions concentration using the calibration curve equation: y=0.017x, shown in Figure 1. Where, y=absorbance and x=concentrations to be determined.
These absorbance values and calculated concentrations of the three analyzed fruit samples were reported in (Table 1). The results obtained by UV-visible spectrophotometer were show varying amounts of vitamin C present in those fruit samples [8].
| Fruit samples | Absorbance | Concentration (mg/L) | Concentration (g/L)® |
|---|---|---|---|
| Green pepper | 0.6086 | 35.8 | 21.4765 |
| Tomato | 0.3003 | 17.665 | 15.3907 |
| Potato | 0.2479 | 14.582 | 10.7521 |
Table 1: The amount vitamin C or ascorbic acid in the three fruit samples using UV-Vis specrophotometric method.
Determination of ascorbic acid in the fruit samples by redox titration
Vitamin C or ascorbic acid content in the fruit samples was determined by titrimetric method using potassium iodate as a standard solution due to good oxidizing agent ability. The amount of ascorbic acid in the fruit samples was calculated using the following redox reactions [9].
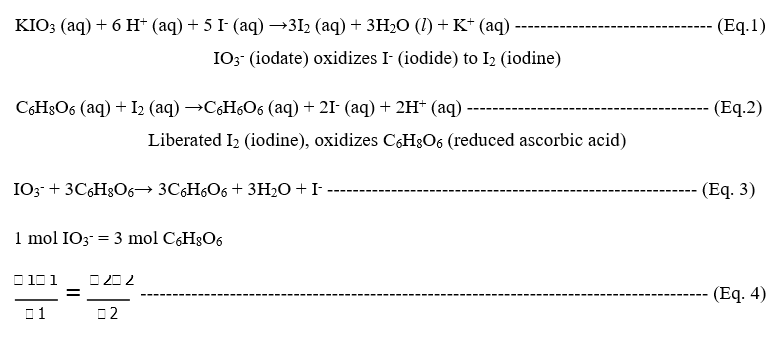
Where, M=molar concentrations, V=volumes (ml), n=number of moles in the equation
The amount of vitamin C in the fruit samples were calculated using the following equation (Eq. 4) and reported in Table 2 [10].
| Fruit samples | Average volume of KIO3 (mL) | Amount of vitamin C (M) | Amount of vitamin C (g/L) |
|---|---|---|---|
| Green pepper | 24.67 | 0.111 | 19.536 |
| Tomato | 20.22 | 0.091 | 16.0912 |
| Potato | 14 | 0.063 | 11.1351 |
Table 2: Amount of vitamin C in fruit samples as determined by titrimetric method.
Comparison of the amount of ascorbic acid determined by the two methods
The amount of ascorbic acid or vitamin C in different fruit samples such as green pepper, tomato and potato was carried out using both spectroscopic and titrimetric methods. The results were found that there is no more differences between the two methods shown in Figure 2, but in the case of the three fruit samples in which they were showed differences in the amount of vitamin C. The results in both methods showed that the amount of ascorbic acid in green pepper was higher than tomato and potato while potato contained smaller amount of ascorbic acid than green pepper and tomato [11].

Figure 2: Comparison of the two methods for the determination of ascorbic acid.
ConclusionIn summary, it is seen from the present study that green pepper, tomato and potato has measurable amount of vitamin C (ascorbic acid) especially in green pepper. It is thus concluded that green pepper, tomato and potato may lead to inhibit/ prevent oxidative damage of the body due to the presence of ascorbic acid/vitamin C. This finding may be taken as indicator of the prevention of health problems associated with free radicals or reactive oxygen species exerted on biomolecules. This finding recommended that, these fruits are always available in local markets and they are also not expensive, the considerable amount of vitamin C presents in these fruits and vegetables showed that when they are consumed in relative large amount, they will certainly contribute to the daily human dietary intake of the vitamin.
Acknowledgment
We gratefully acknowledge the department of chemistry, Woldia university, Ethiopia for giving necessary facilities.
Conflict of Interest
The author(s) declare that they have no conflict of interest.
References
- Elgailani IE, Elkareem MA, Noh E, Adam O, Alghamdi A. Comparison of two methods for the determination of vitamin C (ascorbic acid) in some fruits. Am J Chem. 2017;2(1):1-7.
- Bekele DA, Geleta GS. Iodometric determination of the ascorbic acid (vitamin C) content of some fruits consumed in Jimma town community in Ethiopia. Res J Chem Sci. 2015;2231:606X.
- Gökmen V, Kahraman N, Demir N, Acar J. Enzymatically validated liquid chromatographic method for the determination of ascorbic and dehydroascorbic acids in fruit and vegetables. J Chromatogr A. 2000;881(1-2):309-316.
[Crossref] [Google Scholar] [PubMed]
- Hernandez Y, Lobo MG, Gonzalez M. Determination of vitamin C in tropical fruits: A comparative evaluation of methods. Food Chem. 2006;96(4):654-664.
- Kapur A, Haskovc A, Copra-Janicijevic A, Klepo L, Topcagic A, Tahirovic I, et al. Spectrophotometric analysis of total ascorbic acid contetnt in various fruits and vegetables. Bulletin Chem Tech Bosnia Herzegovina. 2012;38:39-42.
- Khan MR, Rahman MM, Islam MS, Begum SA. A simple UV-spectrophotometric method for the determination of vitamin C content in various fruits and vegetables at Sylhet area in Bangladesh. J Biol Sci. 2006;6(2):388-392.
- Kumar GV, Kumar A, Raghu K, Patel GR, Manjappa S. Determination of vitamin C in some fruits and vegetables in Davanagere city,(Karanataka) India. Int J Pharm Life Sci. 2013;4(3):2489-2491.
- Padayatty SJ, Katz A, Wang Y, Eck P, Kwon O, Lee JH, et al. Vitamin C as an antioxidant: Evaluation of its role in disease prevention. J Ame Coll Nutr. 2003;22(1):18-35.
- Rasanu N, Magearu V, Matei N, Soceanu A. Determination of vitamin C in different stages of fruits growing. An Univ Bucuresti Chimie. 2005;14(1):167-172.
- Spinola V, Mendes B, Camara JS, Castilho PC. Effect of time and temperature on vitamin C stability in horticultural extracts. UHPLC-PDA vs. iodometric titration as analytical methods. LWT-Food Sci Tech. 2013;50(2):489-495.
- Suntornsuk L, Gritsanapun W, Nilkamhank S, Paochom A. Quantitation of vitamin C content in herbal juice using direct titration. J Pharm Biomed Anal. 2002;28(5):849-855.
[Crossref] [Google Scholar] [PubMed]
Citation: Alene AN, Tekaligne TM, Habte AT (2024) Determination of Vitamin C (Ascorbic Acid) in Some Fresh Fruits: A Comparative Evaluation of Method. J Food Process Technol. 15:1115.
Copyright: © 2024 Alene AN, et al. This is an open-access article distributed under the terms of the Creative Commons Attribution License, which permits unrestricted use, distribution, and reproduction in any medium, provided the original author and source are credited.