Indexed In
- Open J Gate
- RefSeek
- Hamdard University
- EBSCO A-Z
- Scholarsteer
- Publons
- Euro Pub
- Google Scholar
Useful Links
Share This Page
Journal Flyer
Open Access Journals
- Agri and Aquaculture
- Biochemistry
- Bioinformatics & Systems Biology
- Business & Management
- Chemistry
- Clinical Sciences
- Engineering
- Food & Nutrition
- General Science
- Genetics & Molecular Biology
- Immunology & Microbiology
- Medical Sciences
- Neuroscience & Psychology
- Nursing & Health Care
- Pharmaceutical Sciences
Research Article - (2024) Volume 12, Issue 4
Determinants of Profitability: A Study on Flour Manufacturing Companies in Hosanna Town
Dereje Lemma Lalisho* and Etsegenet SintayehuReceived: 13-Mar-2020, Manuscript No. IJAR-24-3622; Editor assigned: 18-Mar-2020, Pre QC No. IJAR-24-3622 (PQ); Reviewed: 01-Apr-2020, QC No. IJAR-24-3622; Revised: 15-Jul-2024, Manuscript No. IJAR-24-3622 (R); Published: 12-Aug-2024, DOI: 10.35248/2472-114X.24.12.404
Abstract
In Ethiopia the contribution of manufacturing companies to economic growth is so minimal as compared to agriculture and services sectors. They are experiencing low return which is an indicator of poor financial performance. However, to remain competitive in the globalized economy, having good financial performance is highly imperative. Therefore, this study is to identify the determinants of flour manufacturing companies’ profitability in Hosanna town. The explanatory variables used in this study were firm size, leverage, liquidity, fixed asset turnover, operating expense and sales growth rate. The dependent variables were ROA and ROE. The data was collected from 6 companies for period of 7 years from audited financial statements of the companies.
Keywords
Profitability; Firm specific variables; Flour manufacturing companies
Introduction
Profit is the driving force of the firm as well as the survival indicator of a firm. The accomplishment of its goal is entirely dependent on its profitability. The profitability is the main index of a firm’s performance [1]. Profit is very important; more profit reflects more effective management of resources and low profits can slow the pace at which a firm progresses and certain obligations or targets may not be met. For any firm to continue in a business, it should be able to generate enough revenue to cover its operating cost and make enough profit as compensation to the providers of capital. Every firm is most concerned with its profitability.
According to Hifza Malik, profitability is one of the most important objectives of financial management since one goal of financial management is to maximize the owners’ wealth; and profitability is very important determinant of performance [2]. A business that is not profitable cannot survive. Conversely, a business that is highly profitable has the ability to reward its owners with a large return on their investment. Hence, the ultimate goal of a business entity is to earn profit in order to make sure the sustainability of the business in prevailing market conditions. Pandey defined the profitability as the ability of a business, whereas it interprets the term profit in relation to other elements. It is necessary to examine the determinants of profitability to understand how companies finance their operations.
Currently, this sub-sector (flour manufacturing) is growing very fast in terms of values and volume of production. It also contributes a significant portion to the gross value of production and marketing. This prediction shows that the sub-sector will exhibit one of the highest growth rates in the manufacturing sector which is mainly dependent on locally produced raw materials such as wheat. This in return implies that sustainability will not be a challenging issue. Besides, there is an opportunity in this sub sector. This include the country’s potential to grow wheat; conducive government policy in manufacturing sector, over 4.7 million wheat producers; high demand of bread, pasta and macaroon, etc [3].
Statement of the problem
One of the biggest contributors to the economy is the manufacturing sector as it has the most important role and a significant impact over the economic development of any country at both local and international level. Most of the industrialized countries depending on the industrialization and manufacturing development by its production sector adding value to the economy and economic development bring the country in the line of industrialized developed countries as the role of the industrialization cannot be ignored even at micro level as well as macro level. This progress later plays a vital role to bring the country to achieve its long term economic growth and to fight the vicious circle of poverty which is the hurdle to the economic development and works against underdevelopment and contributes to increase national income [4].
Objectives of the study
General objective: The general objective of this study is to assess the determinants of flour manufacturing companies’ profitability in Hosanna town.
Specific objectives: The specific objectives of this study include.
• To determine the influence of firm size on profitability of
the flour manufacturing firms operating in Hosanna town.
• To examine the effect of leverage on profitability of the flour
manufacturing firms operating in Hosanna town.
• To analyze the effect of liquidity on profitability of the flour
manufacturing firms operating in Hosanna town.
• To scrutinize the effect of sales growth on profitability of the
flour manufacturing firms operating in Hosanna town.
• To investigate the effect of fixed asset, turn over on
profitability of the flour manufacturing firms operating in
Hosanna town.
• To study the effect of operating expense on profitability of
the flour manufacturing firms operating in Hosanna town.
Scope and limitation of the study
The scope of the research was limited to the relationship of selected variables that determine the profitability of flour manufacturing companies in Southern Nation Nationalities and Peoples Region (SNNPR) specifically in Hosanna town. In the sample flour manufacturing companies that have complete financial statement for the study period were included purposively. The length of time considered during the selection of companies in this study was 7 years working experience, from 2012-2018. The data for this study was gathered from the audited annual financial reports of the six flour manufacturing companies. Some of the constraints that the researcher was face during the study are time, finance and source of information, lack of enough empirical studies in the related subject area and sample inadequacy selection was other constraint because the study considered only few flour manufacturing firms at Hosanna town [5].
Material and Methods
Description of the study area
The study was conducted in Southern Nation Nationalities and People’s Region (SNNPR) specifically in Hosanna town, which is the capital town of the Hadiya zone. Hosanna is among the town of the region that have abundant resource base, which can create a favorable environment for industrial development especially for agro industry (example, cereals for flour manufacturing company). According to the data from town trade and investment office there are a total of 6 manufacturing companies in Hosanna town which found at full operation, licensing registration and implementation level, of which all companies established as a four sector [6].
Source and nature of data
For the purpose of this study, secondary data were used from internal and external sources. The internal sources are the balance sheet and income statement of six flour manufacturing companies, whereas, the external sources are the annual reports of Minister of Finance and Economic Development (MoFED). Panel data were employed to examine the effect of firm specific and macroeconomic factors on financial performance of flour companies. Panel data is favored over pure time-series or cross-section data because it can control for individual heterogeneity and there is a less degree of muticollinearity between variables. Only audited financial reports were included in this study [7].
Sampling technique
Purposive sampling technique was employed to select targeted population and complies were selected on the basis of whether they have audited financial statements. In line with this criterion, 6 flour manufacturing complies namely: Sifona Flour factory, Aba Lewi factory, Adinew four factory, Licha flour factory, Mesgan four factory, Birhanu Ahimed four factory were selected because, the aim of the consideration was to provide the reliable and most up-to-date result.
Data analysis
The main purpose of this study is scrutinize the determinants of financial performance in four manufacturing companies using annul balanced panel data in the period of 2012-2018. Thus, financial performance of the four producing c was measured by profitability ratios: ROA (Return of Asset) and ROE (Return of Equity). Regarding the determinants of financial performance of four producing companies, multiple linear regression model used. Thus, on the basis of the general regression model two multiple regression models were specified and estimated to examine the relationship between the two dependent variables-ROA and ROE-each with six independent variables [8].
Results and Discussion
Data presentation and analysis
This chapter discusses the determinants of profitability of flour manufacturing company in Hosanna town. The chapter presents the diagnostics test results of multicolinearity, heteroscedasticity, autocorrelation and normality. The chapter also presents results of the regression analysis and discusses the study results. Finally, this chapter gives a summary of the main concerns [9].
Descriptive statistics
This section presents the descriptive statistics of dependent and explanatory variables used in this study. The dependent variables used in this study are ROA and ROE while explanatory variables are, SIZE, LEV, LIQ, FAT, OPE and SGR.
Summary statistics
Table 1 shows the summary descriptive results for all the variables used in the study such as mean, maximum, minimum, standard deviation and number of observation.
| Variables | ROA | ROE | FIRMSIZE | LEV | LIQ | FAT | OPE | SGR |
|---|---|---|---|---|---|---|---|---|
| Mean | 0.0518 | 0.0611 | 6.9936 | 0.1116 | 9.0409 | 5.3609 | 0.1216 | 0.0518 |
| Maximum | 0.1444 | 0.1524 | 7.7650 | 0.6470 | 15.674 | 12.436 | 0.2683 | 2.9000 |
| Minimum | 0.0162 | 0.0174 | 6.6251 | 0.0096 | 3.5921 | 1.9645 | 0.0255 | -0.3229 |
| Std. Dev. | 0.0249 | 0.0279 | 0.2374 | 0.1789 | 3.1464 | 3.4328 | 0.0616 | 0.5213 |
| Observations | 42 | 42 | 42 | 42 | 42 | 42 | 42 | 42 |
Table 1: Summary of descriptive statistics of study variables over the period of 2012-2018.
As stated in Table 1, the average ROA and ROE for flour companies were 5.2% and 6.1% respectively indicating that flour manufacturing companies have an average positive profit over the last seven years. From the total of 42 observations, the mean of ROA equals 5.2% with a minimum of 1.6% and a maximum of 14.4%.
That means, the most profitable flour manufacturing companies earned 0.1444 cents (14.44%) of net income from each birr asset investment and the minimum profit earned by one of the sample flour manufacturing companies was 0.16 cents on each birr asset investment.
Again, from the total of 42 observations, the mean of ROE equals 6.1% with a minimum of 1.7% and a maximum of 15%. That means, the most profitable sample companies earned 0.15 cents (15%) of net income from one-birr equity investment. On the other hand, the minimum profit earned by company is 0.017 cents (1.7%) for each one-birr investment on equity.
The standard deviation statistics for ROA and ROE was 2.5% and 2.8% respectively meaning that the average ROA and ROE of 5.2% and 6.1% deviates up or down by 2.5% and 2.8% respectively [10].
Correlation matrix
This section of the study presents the results and discussions of the spearman rank correlation analysis. To identify the relationship between profitability of flour manufacturing companies and firm size of companies, leverage, liquidity, fixed asset turnover, operating expense and sales growth rate and spearman rank correlation coefficients were used. The correlation coefficients show the extent and direction of the linear relationship between profitability of flour manufacturing companies and firm size of companies, leverage, liquidity, fixed asset turnover, operating expense and sales growth rate. According to before the start of regression analysis it is important to check the correlation test between dependent variable and independent variables. In this study the researcher used spearman rank correlation coefficient matrix generated through the review 10 software which shows the crossrelationship between all of the variables. The correlation coefficients were tested in order to determine the strength of the relationship between independent and dependent variables. The correlation coefficients were also checked for the presence of high collinearity among repressors (Table 2).
| FIRMSIZE | LEV | LIQ | FAT | OPE | SGR | |
|---|---|---|---|---|---|---|
| FIRMSIZE | 1.0000 | |||||
| LEV | -0.1383 | 1.0000 | ||||
| LIQ | 0.2089 | -0.293 | 1.0000 | |||
| FAT | -0.3789 | 0.0381 | -0.022 | 1.0000 | ||
| OPE | -0.2201 | -0.0994 | -0.0938 | 0.3356 | 1.0000 | |
| SGR | 0.1686 | 0.2833 | 0.0653 | 0.3654 | -0.0629 | 1.000000 |
Table 2: Correlation summary of regression result matrix (only independent variables).
Heteroscedasticity test
It has been assumed that the variance of the errors is constant. This is known as the assumption of homoscedasticity. If the errors do not have a constant variance, they are said to be heteroscedasticity. Homoscedasticity states that the variance of the error term is constant in regression results E ( /X)=0.
Heteroskedasticity is to be present in a model if the variances of the error term of the different observation are not the same. The whites’ test was used to check for the presence of heteroscedasticity in the residuals (Table 3).
| A-heteroscedasticity test: White | B-heteroscedasticity test: White | ||||||
|---|---|---|---|---|---|---|---|
| F-statistic | 1.21474 | Prob. F (27,14) | 0.36 | F-statistic | 0.98167 | Prob. F (27,14) | 0.5354 |
| Obs*R-squared | 29.4354 | Prob. Chi-square (27) | 0.3401 | Obs*R-squared | 27.4833 | Prob. Chi-square (27) | 0.438 |
| Scaled explained SS | 17.5356 | Prob. Chi-square (27) | 0.9171 | Scaled explained SS | 18.7755 | Prob. Chi-square (27) | 0.878 |
Table 3: A-heteroscedasticity test: White (summary) and B-heteroscedasticity test: White (summary).
As shown in Table 3 both F-statistic and chi-square version of test give the same conclusion that there is no evidence for the presence of heteroscedasticity since the p-values in all of the cases were above 0.05. The third version of the test statistics “scaled explained SS”, which is based on a normalized version of the explained sum of squares from the auxiliary regression also give the same conclusion [11].
Generally, in the regression models used in this study it was proved that the test statistics is not significant and the variance of the error term is constant or homoscedastic. Based on this evidence, it is possible to accept the null hypothesis of homoscedasticity. The linear model is also correctly specified.
Normality test
The examination of the normal distribution of the data of the study is one of the fundamental requirements for linear regression analysis between the study variables. Normality tests are used to determine whether a data set is well-modeled by a normal distribution or not; or to compute how likely an underlying random variable is to be normally distributed. This assumption requires the disturbances to be normally distributed. The Jarque-Bera probability statistics is expected not to be significant. Therefore, the normality test for this study as stated in Figure 1 (model one and model two) the kurtosis is close to 3 and the Jarque-Bera statistic had a p-value of 0.1436 and 0.1509 (Figure 2).
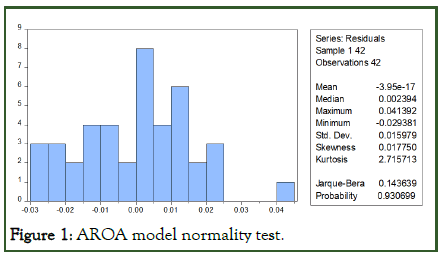
Figure 1: AROA model normality test.
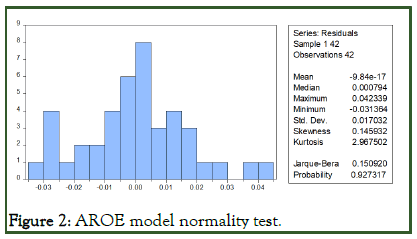
Figure 2: AROE model normality test.
Autocorrelation test
According to the objective autocorrelation test is to test the linear regression model there is a correlation between the errors in period t with bullies’ error in period t-1 (previous period). Durbin-Watson (DW) is use to test the independent variables of errors (autocorrelation) for a level of significance of 0.05. If the errors are correlated with one another, it would be stated that they are ‘serially correlated’. A test of this assumption is therefore conducted. The test for Durbin-Watson which is shown below regression output of the models. As per this test the values of Durbin-Watson for the model 1 and model 2 are 2.002612 and 2.063087 which are above two. So there is no problem of autocorrelation [12].
Fixed effect versus random effect
It is also necessary to determine whether the fixed effect or random effect approach is appropriate. A common practice in corporate governance research is to make the choice between both approaches by running a Hausman test. To conduct a Hausman test, the number of cross section should be greater than the number of coefficients to be estimated. But, in this study, the number of cross sections are not greater than the number of coefficients. Consequently, it is not possible to conduct a Hausman test. Therefore, fixed effects test was conducted to determine whether the fixed effect is appropriate for the models. As a result, the time-fixed effect approach was used.
Conclusion
Based on the findings of this study and the conclusions drawn above, the following recommendations were made. The results of significant and positive relationship between firm size and profitability in both return on asset and return on equity leads to increase in firms’ profitability. The results showed that firm size was a major determinant of profitability. This study therefore suggests that firms’ focus should be on increasing their size by boosting turnover and opening up new market for existing and new product. This simply suggests that firms need to expand in size to enhance their profit level. In summary, firms are able to enjoy large profit levels if they can increase in size and sales with a large reduction in production cost and debt ratio.
References
- Pervan M, Mlikota M. What determines the profitability of companies: Case of croatian food and beverage industry. Ekon Istraz. 2013;26(1):277-286.
- Amato L, Wilder RP. The effects of firm size on profit rates in US manufacturing. South Econ J. 1985:181-190.
- Ani WU, Ugwunta DO, Ezeudu IJ, Ugwuanyi GO. An empirical assessment of the determinants of bank profitability in Nigeria: Bank characteristics panel evidence. J Account Taxation. 2012;4(3):38-43.
- Dave AR. Financial management as a determinant of profitability: A study of Indian pharma sector. Asian J Manag. 2012;19(1):124.
- Beard DW, Dess GG. Corporate-level strategy, business-level strategy and firm performance. Acad Manag Ann. 1981;24(4):663-688.
- Bhayani SJ. Determinant of profitability in Indian cement industry: An economic analysis. Asian J Manag. 2010;17(4):6-20.
- Bottazzi L, Da Rin M, Hellmann T. Who are the active investors: Evidence from venture capital. J Financ Econ. 2008;89(3):488-512.
- Candemir A, Zalluhoglu AE. The effect of marketing expenditures during financial crisis: The case of Turkey. Procedia Soc Behav Sci. 2011;24:291-299.
- Chander S, Aggarwal P. Determinants of corporate profitability: An empirical study of Indian drugs and pharmaceutical industry. Paradigm. 2008;12(2):51-61.
- Taherdoost H. What are different research approaches? Comprehensive review of qualitative, quantitative and mixed method research, their applications, types and limitations. J Manag Sci Eng Res. 2022;5(1):53-63.
- Ostlund U, Kidd L, Wengstrom Y, Rowa-Dewar N. Combining qualitative and quantitative research within mixed method research designs: A methodological review. Int J Nurs Stud. 2011;48(3):369-383.
- Parylo O. Qualitative, quantitative or mixed methods: An analysis of research design in articles on principal professional development (1998-2008). Int J Mult Res Approaches. 2012;6(3):297-313.
Citation: Lalisho DL, Sintayehu E (2024) Determinants of Profitability: A Study on Flour Manufacturing Companies in Hosanna Town. Int J Account Res. 12:401.
Copyright: © 2024 Lalisho DL, et al. This is an open-access article distributed under the terms of the Creative Commons Attribution License, which permits unrestricted use, distribution, and reproduction in any medium, provided the original author and source are credited.
