

Indexed In
- Open J Gate
- Genamics JournalSeek
- CiteFactor
- Cosmos IF
- Scimago
- Ulrich's Periodicals Directory
- Electronic Journals Library
- RefSeek
- Hamdard University
- EBSCO A-Z
- Directory of Abstract Indexing for Journals
- OCLC- WorldCat
- Proquest Summons
- Scholarsteer
- ROAD
- Virtual Library of Biology (vifabio)
- Publons
- Geneva Foundation for Medical Education and Research
- Google Scholar
Useful Links
Share This Page
Journal Flyer

Open Access Journals
- Agri and Aquaculture
- Biochemistry
- Bioinformatics & Systems Biology
- Business & Management
- Chemistry
- Clinical Sciences
- Engineering
- Food & Nutrition
- General Science
- Genetics & Molecular Biology
- Immunology & Microbiology
- Medical Sciences
- Neuroscience & Psychology
- Nursing & Health Care
- Pharmaceutical Sciences
Research - (2024) Volume 16, Issue 1
Determinants of Insulin Resistance in Viral Hepatitis C and Hepatic Steatosis Interaction
Mpiana Mutombo Baby1, Nganga Nkanga Mireille1, Tshimpi Wola Yaba Antoine1, Kuyangisa Boloko Bienvenu1, Bikaula Ngwidiwo Jacques1, Salaboni Munzengi Vandersal-Alain1, Matondo Grace Patricia1, Bakemo Bombile Eddy1, Kisoka Lusunsi Christian1, Longo-Mbenza Benjamin1,2,3,4* and Mawalala Malengele Heritier1,52Department of Medicine, Walter Sisulu University, Mthatha, South Africa
3Department of Medicine, Lomo Research University, Kinshasa, DRC, South Africa
4Department of Internal Medicine, Kinshasa University Clinics, Kinshasa, South Africa
5Department of Medical Imaging, University Clinics of Kinshasa, Democratic Republic of the Congo, South Africa
Received: 28-Dec-2023, Manuscript No. BLM-23-24528; Editor assigned: 01-Jan-2024, Pre QC No. BLM-23-24528(PQ); Reviewed: 15-Jan-2024, QC No. BLM-23-24528; Revised: 22-Jan-2024, Manuscript No. BLM-23-24528(R); Published: 29-Jan-2024, DOI: 10.35248/0974-8369.23.16.648
Abstract
Background: The Hepatitis C virus, through its proteins, blocks the insulin signaling pathway, thus causing insulin resistance. He also interferes in lipid metabolism leading to hepatic steatosis. The objective of this study was to determine the effects of the interaction of viral Hepatitis C and hepatic steatosis on insulin resistance in non- diabetic patients in Kinshasa.
Methods: It was a cross-sectional analysis carried out between 2021 and 2022 in non-diabetic patients suffering from Hepatitis C at Biamba Marie Mutombo Hospital (HBMM), Masina/Kinshasa.
Results: Of the 120 patients, 64 were women (53%) and 56 were men (47%), the average age was 71 ± 21 years, the majority of patients, i.e. 67.5% (n=81), were characterized by advancing age, compared to a third of patients, i.e. 32.5% (n=39) without advancing age. There was an epidemic magnitude of insulin resistance estimated at 75% among 120 patients with viral Hepatitis C. The proportions of insulin resistance varied statistically unequally in the different interaction groups between Hepatitis C infection and hepatic steatosis (P<0.000 1). Advancing age ≥ 60 years and very urbanized/polluted residence were the independent determinants of insulinoreresistance. SBP and BMI significantly discriminated against viral Hepatitis C.
Conclusion: This study confirmed that Hepatitis C interacts strongly with fatty liver handled with insulinoresistance in people prearranged.
Keywords
Hepatitis C; Insulin resistance; Hepatic steatosis; HBMM, Kinshasa/Democratic Republic of the Congo
Introduction
Viral Hepatitis C is a public health problem worldwide but especially in SAA both in terms of its morbidity and mortality [1]. Her Severity is variable and can range from a mild form, lasting only a few weeks, to a serious illness that persists for life [1]. In 2016, the World Health Organization (WHO) estimated around 400,000 the number of patients died from complications of Chronic Hepatitis C [1].
Chronic Hepatitis C can lead, in 5% to 20% of cases, to hepatic steatosis, cirrhosis, liver failure or primary liver cancer, which constitute the main complications of HCV (Hepatitis C Virus) infection [1]. These complications occur after more than 20 years of disease progression and are rare in children [1]. But more and more, other extrahepatic complications are described, including insulin resistance [2-8].
The association between HCV and insulin resistance is more significant in patients aged over 40 years [8-10].The significant association with age would suggest that diabetes is the consequence of progressive liver damage and not the effect of the virus itself.
The longitudinal study by Mehta et al., demonstrated that the excess risk in the onset of diabetes during follow-up mainly concerns obese patients aged over 65 years, also suggesting that HCV would not be responsible for the development of diabetes, only in patients at risk [10].
HCV can be considered a viral disease, but also a special type of metabolic disease [11]. Indeed, HCV interferes with lipid metabolism leading to hepatic steatosis; disrupts the carbohydrate metabolism, thereby leading to 'IR or the diabetes, but also increases the risk of developing atherosclerosis [11].
The present study set itself the objectives of determining the effects of the interaction of viral Hepatitis C and hepatic steatosis on insulin resistance in non-diabetic patients in Kinshasa and of determining the influence of the components of Metabolic Syndrome/Insulin Resistance on the different types of steatosis in patients suffering from Hepatitis C.
Materials and Methods
This was a descriptive and analytical cross-sectional study which took place from April 2021 to April 2022 at the Biamba Marie Mutombo Hospital (HBMM), located in Kinshasa/Masina, Democratic Republic of Congo.
Study population
The study population consisted of patients suffering from chronic viral Hepatitis C who had developed hepatic steatosis and/or insulin resistance. All patients over 20 years old, non-diabetic, carrying anti-HCV antibodies and who consented were included in this study. has participate in the study, while patients under 20 years of age, who did not carry anti-HCV antibodies and who did not consent to participate in the study were excluded.
For convenience, all patients aged over 20 years who were seen in consultation or in the emergency room during the study period were pre-selected. Only those who had positive HCV antibodies were retained. The sample size was calculated according to the formula following schwartz [12].
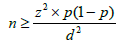
n: sample size
Z: Student's normal distribution, estimated at 1.96 for a 95% confidence interval
p: estimated prevalence of Hepatitis C (3%)
d: margin of error, estimated at 5%
Thus, the calculated sample size was 45. Given the reduced sample size calculated, the option was taken for exhaustive sampling, which is why a sample of 120 patients was retained.
Data collection
A pre-established, pre-coded form was used to collect sociodemographic data, clinical data, biological data (biochemical, serological) and imaging data (ultrasound). Non-modifiable personal attributes were age and gender. The weight, height as well as the address and the degree of environmental pollution of the study subjects constituted the sociodemographic data.
The clinical data included: The notion of smoking, the concept of alcoholism, the concept of taking IV drugs, a sedentary lifestyle, diet, Blood Pressure (BP), Body Mass Index (BMI), waist circumference, hip circumference, jaundice and the hepatomegalia.
The serological marker was characterized by the search for anti- HCV antibodies. Transaminases (GOT, GPT), gamma GT (GGT), glucose, HbA1C, total cholesterol, insulin, Homa score constituted the biochemical markers.
The determination of anti-HCV antibodies and insulin was carried out using the Mindray CL-900 i automated system. (Nanshan, Shenzhen/China). The CL-900i uses the principle of Chemiluminescence Immunoassay (CLIA).The other biochemical parameters were analyzed using the Mindray BS-240 automaton (Nanshan, Shenzhen/China) which uses the principles of spectrophotometry, turbidimetry and potentiometry. Abdominal ultrasound was performed on behalf of medical imaging data.
Operational definitions
The patient who is a chronic carrier of HCV was characterized by the presence of anti-HCV antibodies with normal or slightly elevated levels of transaminases (<3 N) [12].
Metabolic Syndrome was defined by the presence of at least 3 of the following elements (13): BP ≥ 130/85 mmHg, BMI>25 Kg/ m2, Waist circumference >94 cm in men and >80 cm in women, Fasting blood sugar >126 mg/dL or >7 mmol/L in two doses spaced at least 'one week or HbA1>7%, Triglycerides>150 mg/dL or >1.7 mmol/L, HDL<40 mg/dL or <1 mmol/L in men and <1.3 mmol/L in women [13].
Insulin resistance was the decreased response to insulin: seither normal biological response requiring a high quantity of insulin (normoglycemia at the cost of hyperinsulinism), or insufficient biological response for insulinemia (glucose intolerance or diabetes with high insulin levels).
The HOMA (Homeostasis Model Assessment of Insulin Resistance) was the ratio between [14].
Ins(μUI/mL) × Gly(mmol/L)/22.5. Resistance aI insuline si>25.
Hypoglycemia was defined as blood glucose <3.3mmol/L or <60 mg/dL [15].
Hyperglycemia was defined as blood sugar ≥ 7mmol/l or ≥ 126 mg/ dL [15].
Hyperinsulinemia was defined as an insulin value >25 μIU/mL [15].
Hypoinsulinemia was defined as an insulin value <2 μIU/mL [15].
Hepatic steatosis was defined as the presence of a bright liver on ultrasound and/or by the elevation of the ASAT/ALT ratio >1 [16].
Simple steaosis was defined as the presence of a bright liver on ultrasound, without any notion of alcohol intake or metabolic syndrome [16].
Alcoholic steatosis was defined as the presence of a bright liver on ultrasound with the notion of alcohol intake [16].
Non-alcoholic steatosis was defined as the presence of a bright liver on ultrasound associated with the presence of metabolic syndrome [16].
Steatohepatitis/cirrhosis was defined by a cirrhotic liver on ultrasound [16].
Statistical analyzes
The data was encoded using Excel 2010 software, after cleaning and verification of their consistency and their quality. They were exported to SPSS 21.0 for analyses.
Descriptive statistics consisted of calculating the mean and standard deviation for continuous and normally distributed data, the median for non-Gaussian data, and the proportions (%) for categorical data.
The chi-square test made it possible to compare the proportions that of Student's t and Man Withney's U made it possible to compare the means and medians. Predictive factors for the occurrence of insulin resistance in the study group have been researched using the logistic regression test in analysis univariate and multivariate. The calculation of the odds ratio and its confidence interval made it possible to evaluate the strength of association between the independent variables (anti-HCV viral markers, age, sex, BMI and degree of pollution) and the dependent variable (insulin resistance). For all tests used, the value of P<0.05 was the threshold for statistical significance.
Results
There was an epidemic scale of insulin resistance with 90 patients among the study population: rate of ¾ of insulinoreresistance (Figure 1). Among the entire study population (n=120), 46.7% (n=56) patients were men compared to 53.33% (n=64) women (Figure 2). The majority of patients, i.e. 67.5% (n=81), were characterized by advancing age, compared to a third of patients, i.e. 32.5% (n=39) without advancing age (Figure 3).

Figure 1: Proportion of insulin resistance in the study population. Note: ( ): OUI, (
 ): NON

Figure 2: Distribution of the study population by sex. Note: ():
HOMME, ( ): NON: FEMME

Figure 3: Distribution of patients according to age progression. Note: (): OUI ≥ 60 ans, (): NON<60 ans
The proportions of the HCV (+) group with alcoholic steatosis were higher than those of the HCV (+) groups with steatohepatitis/ Cirrhosis, CVH (+) with non-alcoholic steatosis and CVH with simple steatosis (Figure 4) (Table 1).

Figure 4: Proportions of HCV and steatosis interaction groups in the
study population. Note: (): HVC+ avec Steatose simple, (): HVC+
avec Steatose Non Alcoolique, ( ): , (
 ): HVC+ avec Steatoshepatite/
Cirrhose
): HVC+ avec Steatoshepatite/
Cirrhose
| Variables | Effective | Percentage |
|---|---|---|
| (n=120) | (%) | |
| HCV(+) with simple steatosis | 21 | 17.5 |
| HCV(+) with alcoholic steatosis | 39 | 32.5 |
| HCV(+) with non-alcoholic steatosis | 30 | 25 |
| HCV(+) with steatohepatitis/cirrhosis | 30 | 25 |
Table 1: Interaction between Hepatitis C infection and Steatoses.
Considering the degree of urbanization-pollution and human mobility, insulinoreresistance was significant (P for trend<0.000 1) in multi-ethnic sites tres urbanises with pollution and strong migration (90.9%, n=30/33) only in semi-urbanized Bantu siteses, chaotic-polluted with rural exodus (84.3%, n=43/51), and in Bantu-rural-non-migrant sites without pollution (47.2%, n=17/36) (Figure 5).

Figure 5: Distribution of proportions of insulin resistance across sites
of degree of urbanization-pollution-human mobility. Note: (): OUI,
(): NON
Insulin or proportions resistance varied statistically unequally in the different interaction groups between Hepatitis C infection and fatty liver disease (P<0.000 1) (Figure 6). So there were:
• 23.8% (n=5/21) insulinoreresistance in the HCV+ group with simple steatosis ;
• 64.1% (n=25/39) insulinoreresistance in the HCV+ group with alcoholic steatosis ;
• 100% (n=30/30) insulinoreresistance in the HCV+ group with non-alcoholic steatosis ;
• 100% (n=30/30) insulinoreresistance in the HCV+ group with steatohepatitis/cirrhosis.
There was an uneven but very significant variation in mean values (SBP, DBP, waist circumference, hip circumference, blood glucose, total cholesterol, gamma GT, SGOT, SGPT) between steatosis types.

Figure 6: Proportions of insulin resistance in the interaction between
HCV infection and steatosis. Note: ( ): OUI, (): NON
An exponential curve between PAS, THE Waist circumference, hip circumference, blood sugar, insulinemia, Homa score, Gamma GT, SGOT, SGPT and types of steatosis (the highest average values were observed in steatohepatitis/cirrhosis; intermediate values in alcoholic and non-alcoholic steatosis, while the lowest values were observed in simple steatosis) against a quadratic function with curves in U or in J between PAD, cholestetotal rol, BMI and types of steatosis (the lowest mean values were observed in the alcoholic steatosis group, while the highest values were observed in the steatohpatitis/cirrhosis groups ; stenonalcoholic atosis and simple steatosis) (Figures 7-18) [17-23].

Figure 7: HCV/Steatosis and PAS interactions.

Figure 8: HCV/Steatosis and Waist Circumference Interactions.

Figure 9: HCV/Steatosis and hip size interactions.

Figure 10: HCV/steatosis and blood glucose interactions.

Figure 11: HCV/steatosis and insulinemia interactions.

Figure 12: HCV/steatosis and insulin resistance interactions.

Figure 13: HCV/steatosis and Gamma GT interactions.

Figure 14: HCV/steatosis and SGOT interactions.

Figure 15: HCV/Steatosis and SGPT interactions.

Figure 16: HCV/steatosis and BMI interactions.

Figure 17: HCV/Steatosis and PAD interactions.

Figure 18: HCV/Steatosis and total cholesterol interactions.
By introducing all covariates into the multivariate binary logistic regression analysis as univariate associated factors of insulinoreresistance and after adjustment for sex (confounding variable), the rest of the covariates (urbanization-pollution-human mobility), the model was considered very valid and reliable according to the Hosmer and Lemeshow test (chi square=0.549).
Using Wilk's Lambda equality group tests, the canonical discriminant functions and the coefficients of the classification functions were presented in Figure 19. Therefore, some confounding factors were excluded from the equation after adjustment according to discriminant analysis [23-27].

Figure 19: Types of steatosis in multivariate discriminant analyzes. Note: ( ): HVC+ avec Steatose S, (
 ): HVC+ avec Steatose A, (
 ):
HVC+ avec Steatose N, (
):
HVC+ avec Steatose N, ( ): HVC+ avec steatophep A.
Discussion
This is the first study has Kinshasa/DRC has determine the effects of the interaction of viral Hepatitis C and hepatic steatosis on insulinoreresistance in non-diabetic patients [27-29].
Hepatitis C and insulin resistance
The present study reinforced the results of other researchers around the world who demonstrated an association between Hepatitis C and insulin resistance [2].
The present work showed an epidemic scale of insulin resistance estimated at 75% among 120 patients suffering from viral Hepatitis C, while Moucari et al., found an insulin resistance rate of 32.4%. The demographic, epidemiological, economic and nutritional transition could be the basis of these significant rates [30].
Insulinoreresistance and interaction between Hepatitis C and Steatosis
The present study revealed a statistically significant link between the interaction of Hepatitis C surmounted by steatosis with insulin resistance: An exponential function of the rate of insulin resistance starting from the group of HCV+ with simple steatosis of the order of 23.8%; tripled for the HCV+ group with alcoholic steatosis of around 64.1% towards an insulin resistance rate of around 100% for the HCV+ groups with severe and non-severe non-alcoholic steatosis. Which demonstrates that on its own, HCV is capable of causing insulin resistance to more or less 24%, while when there is the influence of alcohol and metabolic syndrome, insulin resistance is tripled and even quadrupled, thus supporting the studies of Mehta and Moucari [10,30].
Components of metabolic syndrome and types of steatosis
The univariate and multivariate analyzes of the present study confirmed the work in the literature relating to metabolic syndrome/disorders of carbohydrate and lipid metabolisms, oxidative stress, insulin resistance and fibrosis hepatient [20-23].
However, total hypercholesterolemia, not specific for metabolic syndrome [24], was not associated with the severity of insulin resistance in interactions between HCV and fatty liver disease [25-27].
Circulating biomarkers including glucose, insulin, transaminases and anthropometric parameters including waist circumference, hip circumference and BMI varied in parallel with gamma GT disturbances (marker of oxidative stress) [28] across the different types of steatosis in the present study.
Independent determinants of insulin resistance
The discriminant analysis applied by the present study instead identified increased systolic blood pressure and increased BMI/ inflammation as the only independent determinants capable of classifying the different types of steatosis. This demonstrates that hepatic steatosis due to HCV could follow in the footsteps of systolic hypertension and obesity/inflammation in the occurrence of type 2 diabetes mellitus and atherosclerosis [25,26,29].
In the present study, multivariate analysis of binary logistic regression type excluded sex, anthropometric parameters, biomarkers of cardiometabolic risk-oxidative stress from the equation while keeping age advancement ≥ 60 years and urbanization-human pollution-mobility as independent determinants of insulin resistance in patients with HCV and steatosis interaction [31-33].
This association supports the advancement in age and the increase in Gamma GT linked to oxidative stress, as well as the metabolic toxicity also linked to pollution in the city of Kinshasa supporting certain cancers [15].
Implications
The most important results of the present study will have an implication in the plans of research, personalized-precision medicine and Clinical Biology to prevent, screen, diagnose and treat Hepatitis C contributing to insulin resistance and steatoses hepatic.
The same results will be used in continuing education for understanding the pathophysiology of insulin resistance resulting from the interaction between Hepatitis C and fatty liver disease.
Conclusion
This work made it possible to confirm, on the basis of a very significant association, the involvement of the viral Hepatitis C-steatosis interaction on the occurrence of insulin resistance as has been proven in the literature. Advancing age, obesity and systolic blood pressure were predisposing factors for insulin resistance in non-diabetic patients suffering from Hepatitis C, thus confirming the data in the literature. This research validated the strong interaction between Hepatitis C and fatty liver in individuals predisposed to insulin resistance.
Ethics
The study protocol was submitted for analysis to the National Ethics Committee, and a favourable opinion was granted under number n°407/CNES/BN/PMMF/2021 of 03/04/2021.
Author Contributions
Longo Mbenza Benjamin, Nganga Nkanga Mireille and Mpiana Mutombo Baby were responsible for the conception, interpretation and writing. Mpiana Mutombo Baby, Kuyangisa Boloko Bienvenu, Bikaula Ngwidiyo Jacques, Salaboni Mungenzi Vandersal Alain, Matondo Grace Patricia, Bakemo Bombile Eddy participated in the data collection. Longo Mbenza Benjamin analyzed the data. Mpiana Mutombo Baby, Nganga Nkanga Mireille, Kisoka Lusunsi Christian, Mawalala Malengela Heritier wrote the article. Mpiana Mutombo Baby, Nganga Nkanga Mireille, Tshimpi Wola Yaba Antoine supervised the writing of the article. All authors made intellectual contributions to the draft of the manuscript and approved the final version of the manuscript for submission.
References
- World Health Organisation. Key information on hepatitis C. 2022.
- Hui JM, Sud A, Farrell GC, Bandara P, Byth K, Kench JG, et al. Insulin resistance is associated with chronic hepatitis C and virus infection fibrosis progression. Gastroenterol. 2003;125(6):1695-1704.
[Crossref] [Google Scholar] [PubMed]
- Petit JM, Poussier A, Bouillet B, Brindisi MC, Hillon P, Vergès B. Insulin resistance, diabetes and hepatitis C virus infection. Metabolic Disease Medicine. 2009;3(4):401-405.
- Gao Ting, Qin Z ling, Ren H, Zhao P, Qi Z tian. Inhibition of IRS-1 by hepatitis C virus infection leads to insulin resistance in a PTEN-dependent manner. Virol J. 2015;12:1-8.
[Google Scholar] [PubMed]
- Delgado‐Borrego A, Liu Y, Jordan SH, Agrawal S, Zhang H, Christofi M, et al. Prospective study of liver transplant recipients with HCV infection: Evidence for a causal relationship between HCV and insulin resistance. Liver Transpl. 2008;14(2):193-201.
- Seirafi M, Negro F. Hepatitis C and insulin resistance. Rev Med Switzerland. 2008;4(169):1859-1862.
[Google Scholar] [PubMed]
- Jaafar J, de Kalbermatten B, Philippe J, Scheen A, Jornayvaz FR. Chronic liver diseases and diabetes. Rev Med Switzerland. 2014;10(433):1254-1256.
[Google Scholar] [PubMed]
- Arao M, Murase K, Kusakabe A, Yoshioka K, Fukuzawa Y, Ishikawa T, et al. Prevalence of diabetes mellitus in Japanese patients chronically infected with hepatitis C virus. J Gastroenterol. 2003;38(4).
[Google Scholar] [PubMed]
- Machado MV, Cortez-Pinto H. Insulin resistance and steatosis in chronic hepatitis C. Ann Hepatol. 2009;8:67-75.
[Google Scholar] [PubMed]
- Mehta SH, Brancati FL, Strathdee SA, Pankow JS, Netski D, Coresh J, et al. Hepatitis C virus infection and incident type 2 diabetes. Hepatol Baltim Md. 2003;38(1):50-56.
[Google Scholar] [PubMed]
- Ishizaka N, Ishizaka Y, Takahashi E. Association between hepatitis C virus seropositivity, carotid-artery plaque, and intima media thickening. Lancet. 2002;359:133-135.
[Crossref] [Google Scholar] [PubMed]
- Bonita R, Beaglehole R, Kjellström T. Elements of epidemiology. Second edition. 2010.
- Equal Robert H. The metabolic syndrome. Lancet. 2005;365(9,468):1415-1428.
- Scheen AJ. Evaluation of insulinosecretion and insulinosensitivity. Therapy. 2007;62(4):311-318.
[Crossref] [Google Scholar] [PubMed]
- Alberti KGMM, Zimmet P, Shaw J. Epidemiology Task Force Consensus Group. The metabolic syndrome-a new worldwide definition. Lancet Lond Engl. 2005;366(9491):1059-1062.
[Google Scholar] [PubMed]
- D. Quilliot, P. Bohme, O. Ziegler. Non-alcoholic steatohepatitis. Influence of nutrition, from pathophysiology to treatment. 2011:35-46.
- Benaraba R. Insulin resistance and oxidative stress in metabolic syndrome: Experimental study of the protective effects of nutritional microconstituents (polyphenols from tea, cinnamon and chromium III). Biochemistry. Joseph-Fourier University-Grenoble I. 2007.
- Nkanga MSN, Longo-Mbenza B, Mambueni C. Epidemiology, biomarkers of hematologic malignancies in Kinshasa, DRC. European University Editions. 2019.
- Onkin KL. The syndrome metabolic among the black Congolese of Kinshasa and hinterland: problemematics of its diagnostic and preventive care, aggregation thesis. University of Kinshasa.
- Pazienza V, Clement S, Pugnale P, Conzelman S, Foti M, Mangia A, et al. The hepatitis C virus core protein of genotypes 3a and 1b downregulates insulin receptor substrate 1 through genotype-specific mechanisms. Hepatol Baltim Md. 2007;45(5):1164-1171.
- Andre P, Komurian-Pradel F, Deforges S, Perret M, Berland JL, Sodoyer M, et al. Characterization of low-and very-low-density hepatitis C virus RNA-containing particles. J Virol. 2002;76(14):6919-6928.
[Crossref] [Google Scholar] [PubMed]
- Monazahian M, Bohme I, Bonk S, Koch A, Scholz C, Grethe S, et al. Low density lipoprotein receptor as a candidate receptor for hepatitis C virus. J Med Virol. 1999;57(3):223-229.
[Crossref] [Google Scholar] [PubMed]
- Agnello V, Abel G, Elfahal M, Knight GB, Zhang QX. Hepatitis C viruses and other flaviviridae viruses enter cells via low density lipoprotein receptor. Proc Natl Acad Sci. 1999;96(22):12766-12771.
[Google Scholar] [PubMed]
- Junquero D, Rival Y. Metabolic syndrome: what definition for what treatments? M/S: Medicine sciences. 2005;21(12):1045-1053.
- Adinolfi LE, Gambardella M, Andreana A. Steatosis accelerates the progression of liver damage of chronic hepatitis C patients and correlates with specific HCV genotype and visceral obesity. Hepatol. 2001;33:1358-1364.
[Google Scholar] [PubMed]
- Poynard T, Ratziu V, McHutchison J. Effect of treatment with peg interferon or interferon alfa-2b and ribavirin on steatosis in patients infected with hepatitis C. Hepatol. 2003;38:75-85.
[Google Scholar] [PubMed]
- Sheikh MY, Choi J, Qadri I. Hepatitis C virus infection: Molecular pathways to metabolic syndrome. Hepatol. 2008;47:2127-2133.
[Google Scholar] [PubMed]
- Grundy S. Gamma Glutamyl Transferee: Another Biomarker for Metabolic Syndrome and Cardiovascular Risk. ATVB. 2007;27:127.
- Adinolfi LE, Restivo L, Zampino R. Chronic HCV infection is a risk of atherosclerosis. Role of HCV and HCV related steatosis. Atherosclerosis. 2012;221:496-502.
[Google Scholar] [PubMed]
- Moucari R, Asselah T, Cazals-Hatem D, Voitot H, Boyer N, Ripault M, et al. Insulin resistance in chronic hepatitis C: association with genotypes 1 and 4, serum HCV RNA level, and liver fibrosis. Gastroenterol. 2008;134(2):416-423.
[Google Scholar] [PubMed]
- Kukla M, Mazur W, Bułdak RJ. Potential role of leptin, adiponectin and three novel adipokines-visfatin, Cameron and Aspin-in chronic hepatitis. Mol med. 2011; 17:1397-1410.
[Google Scholar] [PubMed]
- Yoneda M, Saito S, Ikeda T. Hepatitis C virus directly associates with insulin resistance independent of the visceral fat area in non-obese and nondiabetic patients. J Viral Heat. 2007;14:600-607.
[Google Scholar] [PubMed]
- Vanni E, Abate ML, Gentilcore E. Sites and mechanisms of insulin resistance in non-obese, nondiabetic patients with chronic hepatitis C. Hepatol. 2009;50:697-706.
[Google Scholar] [PubMed]
Citation: Bienvenu B, Jacques BN, Vandersal-Alain SM, Patricia MG, Eddy BB, Christian KL, et al. (2024) Determinants of Insulin Resistance in Viral Hepatitis C and Hepatic Steatosis Interaction. Bio Med. 16:648.
Copyright: © 2024 Mpiana B, et al. This is an open-access article distributed under the terms of the Creative Commons Attribution License, which permits unrestricted use, distribution, and reproduction in any medium, provided the original author and source are credited.