Indexed In
- Open J Gate
- Genamics JournalSeek
- Academic Keys
- JournalTOCs
- ResearchBible
- Ulrich's Periodicals Directory
- Access to Global Online Research in Agriculture (AGORA)
- Electronic Journals Library
- RefSeek
- Hamdard University
- EBSCO A-Z
- OCLC- WorldCat
- SWB online catalog
- Virtual Library of Biology (vifabio)
- Publons
- MIAR
- Geneva Foundation for Medical Education and Research
- Euro Pub
- Google Scholar
Useful Links
Share This Page
Journal Flyer

Open Access Journals
- Agri and Aquaculture
- Biochemistry
- Bioinformatics & Systems Biology
- Business & Management
- Chemistry
- Clinical Sciences
- Engineering
- Food & Nutrition
- General Science
- Genetics & Molecular Biology
- Immunology & Microbiology
- Medical Sciences
- Neuroscience & Psychology
- Nursing & Health Care
- Pharmaceutical Sciences
Research Article - (2021) Volume 12, Issue 3
COVID-19 Vaccination: Hopes and Facts to Cover Incompetence
Umberto Cornelli1*, Giovanni Belcaro2 and Martino Recchia32Cardiovascular Clinic, D'Annunzio University of Chieti–Pescara, Chieti, Italy
3Department of Biostatistics, Stat Med, Milano, Italy
Received: 20-Apr-2021 Published: 10-May-2021, DOI: 10.35248/2155-9597.21.12.401
Abstract
Background: Vaccination programmes against COVID-19 started in December 2020 in three countries (Israel, the UK and the USA) and in the first two weeks of January in a further 137 countries. No vaccination campaigns had yet been implemented in 36 countries on 30 March 2021.
Objective: The aim of this research is to compare the death rates in the two sets of countries. The correlation between number of deaths due to the virus and LEEDELS data (Life Expectancy, Ecological, Demographic/Social and Lifestyle variables) was calculated to determine which of these variables were connected with COVID-19 deaths.
Methods: The death and vaccination data were retrieved from the WHO coronavirus dashboard. The LEEDELS data were taken from the Atlante Geografico Agostini 2020 and CIA World Facebook 2020-2021. The statistical evaluation was conducted using the Spilt-Plot variance analysis. The profiler analysis was used to assess the correlation between deaths and vaccinations and the Spearman's ρ were used to correlate the COVID-19 deaths to LEEDELS.
Results: 176 countries were considered. Death rates in the 36 countries without a vaccination programme are increasing, while in few of the other 140 which are close to herd immunity the rate seems to be flattening. However, a significant increase in number of deaths was seen in 48 of the 140 countries (34%) with vaccination programmes despite their campaigns. Death from the virus is linked to urban density and the variables that reflect prosperity (GDP, hospital beds, cars and the internet). None of the other variables were correlated.
Conclusion: COVID-19 is causing a tragic number of deaths and vaccination is only one of the tools needed to tackle the disease. It can be ineffective without an appropriate approach to health policy.The poorest countries will be the next victims.
Keywords
COVID-19; Vaccination; LEEDELS
Introduction
Data regarding deaths due to COVID-19 were available for 176 countries on 30 March 2021, along with a complete set of LEEDELS data (life expectancy, ecological, demographic/social and lifestyle variables). Only 140 countries had begun a vaccination programme before 30 March 2021, while the remaining 36 countries had not yet started a campaign [1].
There are at least nine vaccines currently available (Table 1). All are being used in their country of origin and have been delivered and administered to other countries too upon request. More than one vaccine is being used to cover the needs in some countries. As regards vaccine efficacy, we only have the data the pharmaceutical companies have given to the health authorities, and very few other published reports regarding individual countries.
| Vaccine name Country |
Kind of vaccine | Producer | Countries where it is in use | Efficacy % doses |
Ref |
|---|---|---|---|---|---|
| mRNA-1273 A USA |
mRNA | Moderna | USA, UK, Switzerland Others b |
94 | 5 |
| BNT1262b2 A USA/Germany |
mRNA | Pfizer – BioNTech | SA, EU, Others b | 95 | 6 |
| ChAdOx1 A USA/Sweden |
Non replicating Viral vector |
AstraZeneca/Oxford | UK, Brazil, EU, Others b | 67 | 7 |
| Gam-COVID-Vac Russia |
Viral vector “Sputnik” |
Gamaleya Res Center | Russia, Others b | 92 | 8 |
| Sinopharm China |
Inactivated virus |
Sinova Biothec | China, UAE c,Bahrein, Others b |
86 | 9 |
| Coronavac China |
Inactivated virus |
Sinovac Biotech | China, Others b | 50-79 | 10 |
| Ad26.COV2.S USA/Germany |
Non replicating Viral vector |
Johnson & Johnson | USA, EU, Others b | 66 | 11 |
| Ad5-nCov China |
Non replicating Viral vector |
Cansino Biologics | China, Mexico, Pakistan | 65.7 | 12 |
| BBV152 India |
Inactivated virus |
Barat | India, Iran, Zimbawe | 81 | 13 |
| EpiVacCorona Russia |
Subunit virus |
Vector Institute | Russia | 100 | 14 |
| NVX-CoV2373 USA |
Subunit virus |
Novavax | Under study | 89 | 15 |
b=other countries
Table 1: Vaccines available for COVID-19.
It is common belief that vaccines should be immediately available once approved. Moreover, the theory that herd immunity is sufficient to protect the population fully against COVID-19 still has to be confirmed since we are discovering new peculiar characteristics of this virus every day.
The aim of this research is to establish the effects of vaccination on COVID-19 mortality rates in the 136 countries which have already started vaccinating, and compare these data with those of the 36 countries where a programme has not yet been implemented. The relationship between COVID-19 death rates and LEEDELS data was also analysed.
Materials and Methods
The weekly vaccine shot and death due to COVID-19 data was taken from the WHO Coronavirus Dashboard [1]. A total of 176 countries were considered and the relationship between death rates and LEEDELS data was calculated for these countries. The LEEDELS data (Life Expectancy, Ecological, Demographic And Lifestyle variables) for the year 2020 were taken from the Atlante Geografico De Agostini and CIA World FactBook 2020-2021 [2-4].
The LEEDELS data consist of:
Life Expectancy (years): LE
Population Density (inhabitants/Km2): PD
Urban Population (% of inhabitants in cities): UP
GDP (Gross Domestic Product in USD): GDP
Education (% of GDP for education): ED
Hospital Beds (number of beds/1000 inhabitants): HB
PM 2.5-10 (mg/m3): PM
Cars (number of cars/1000 inhabitants): CA
Mobile Phones (number of mobile phones/1000 inhabitants): MP
Internet (number of connections/1000 inhabitants): IN
Percentage of land covered by forests: FT
Statistical evaluation
Mean values and standard deviations were calculated for all the LEEDELS data. The statistical significance of differences was calculated using the Mann–Whitney U test. The Split-Plot analysis of variance was used to compare the deaths of the countries using the vaccination and the other countries. The profiler analysis and the Spearman's ρ was used to assess any correlation between deaths and vaccinations. All the analyses were done using JMP14 Pro software produced by the SAS institute.
Results
The general picture
Data on the number of deaths due to COVID-19 in 176 countries were considered. However, the number of vaccine shots was only recorded for 140 [1]. The total number of deaths due to COVID-19 up to 28 December in the 176 countries concerned came to 1,835,720. On this date, vaccination had started in the UK, the USA and Israel only (7, 14, and 19 December respectively), and the effect of these campaigns on the death rate in the world on 28 December was very limited. Most of the countries which decided to aim for vaccine coverage started administrations in the first two weeks of January. The trend in deaths from January 2020 to the week ending 29 March is shown (Figure 1).
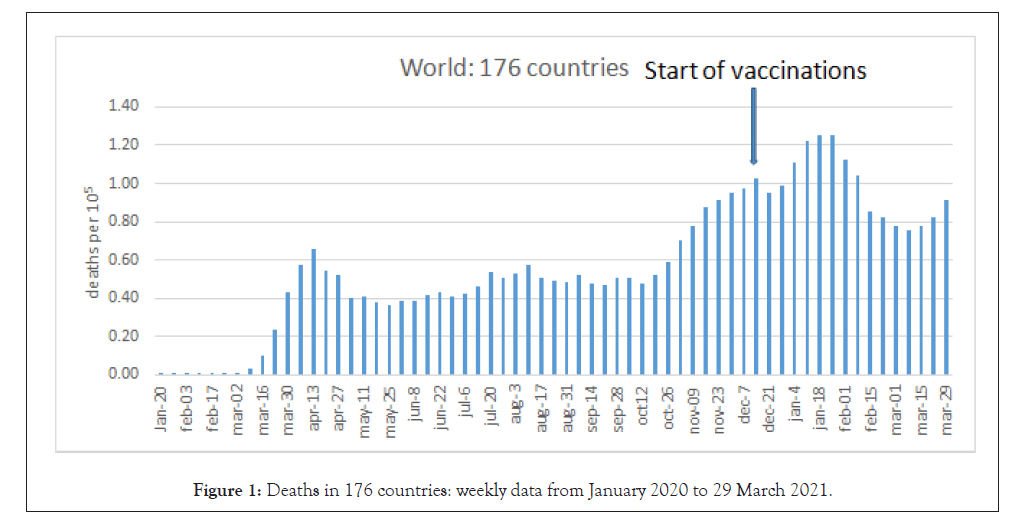
Figure 1: Deaths in 175 countries: weekly data from January 2020 to 29 March 2021.
A decrease in death rate in the world started to become evident from the week of 1 February. It slowly went down until the week ending 7 March, after which the number of deaths started to fluctuate and grow again. Nine vaccines were available for human use, but only three were approved by the FDA and EMA and were in use on 30 March. Furthermore, the three vaccines approved by China were also used in some countries other than China. The only vaccine prepared in Russia was also used in some other countries besides Russia. There is not sufficient information about the vaccines used outside their country of origin. Therefore, no data is available regarding their efficacy except for the trials carried out by the various producers [5-15]. Table shows the vaccines currently in use (Table 1). As already mentioned, some of them are only used in their country of origin and may be made available upon request.
A total of 547,727,346 shots of vaccine had been administered in the world on 30 March, and data are available on how much of each of them has been administered in all 176 countries. In the month of December and during the first two weeks of January, 140 countries decide to start the vaccine campaign and the deaths trends from January 4 up to March 29 are reported (Figure 2). The same data are reported in figure for those countries not implementing the vaccination campaign (Figure 3).
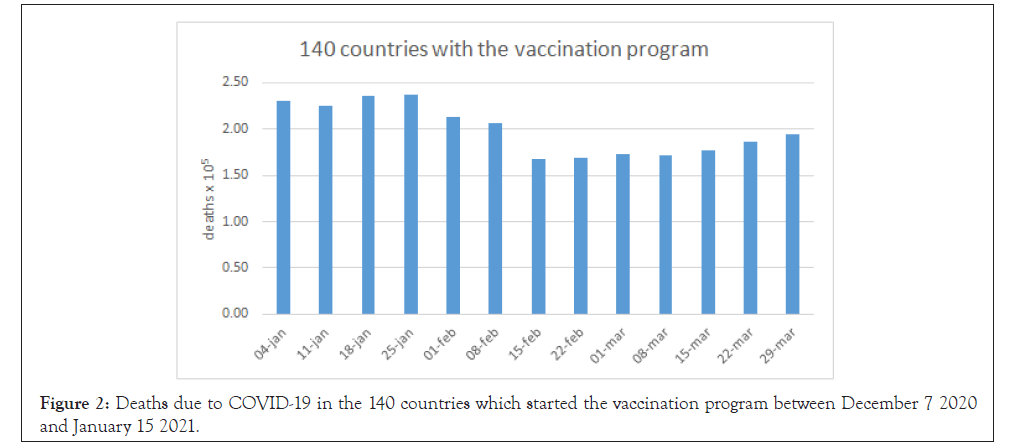
Figure 2: Deaths due to COVID-19 in the 140 countries which started the vaccination program between December 7 2020 and January 15 2021.
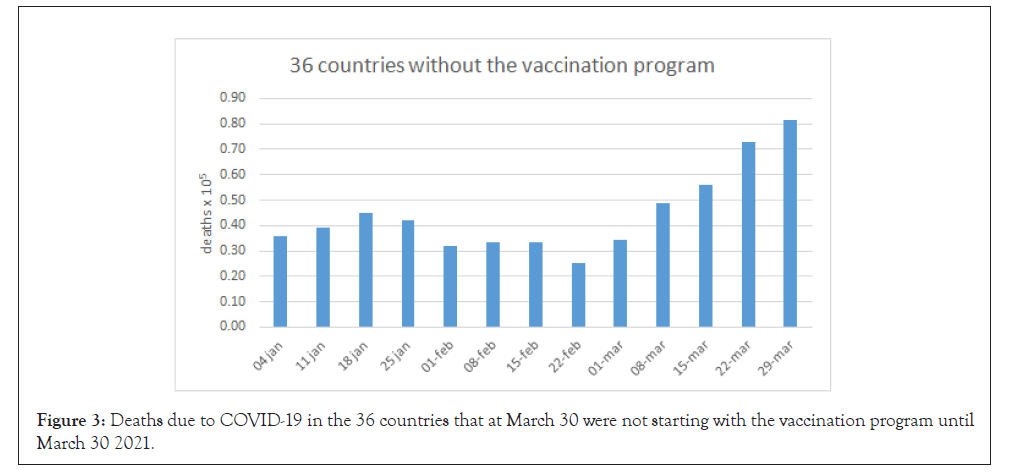
Figure 3: Deaths due to COVID-19 in the 36 countries that at March 30 were not starting with the vaccination program until March 30 2021.
From the Figures 2 and 3 it is evident that the deaths rate in those countries not using the vaccines was lower than in the countries which decided to start with the vaccinations. However, between the weeks of January 1 and March 29 in those countries not yet implementing the vaccine campaign the deaths trend started slowly to grow doubling the number of deaths, while in the countries using vaccines the deaths were slowly reduced. The data of the two sets of countries were compared using the Split-Plot variance analysis (Figure 4) and the Least Square Mean Plot analysis (Figure 5). The average values and the relative trends are summarized in Figure 5.
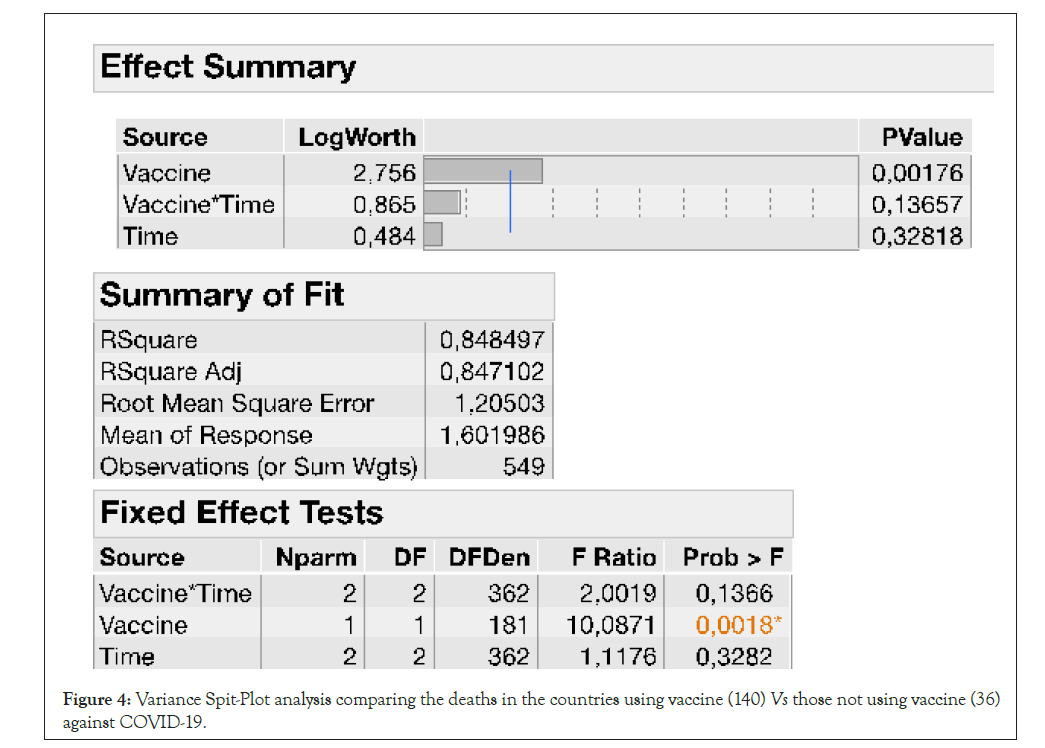
Figure 4: Variance Spit-Plot analysis comparing the deaths in the countries using vaccine (140) Vs those not using vaccine (36) against COVID-19.
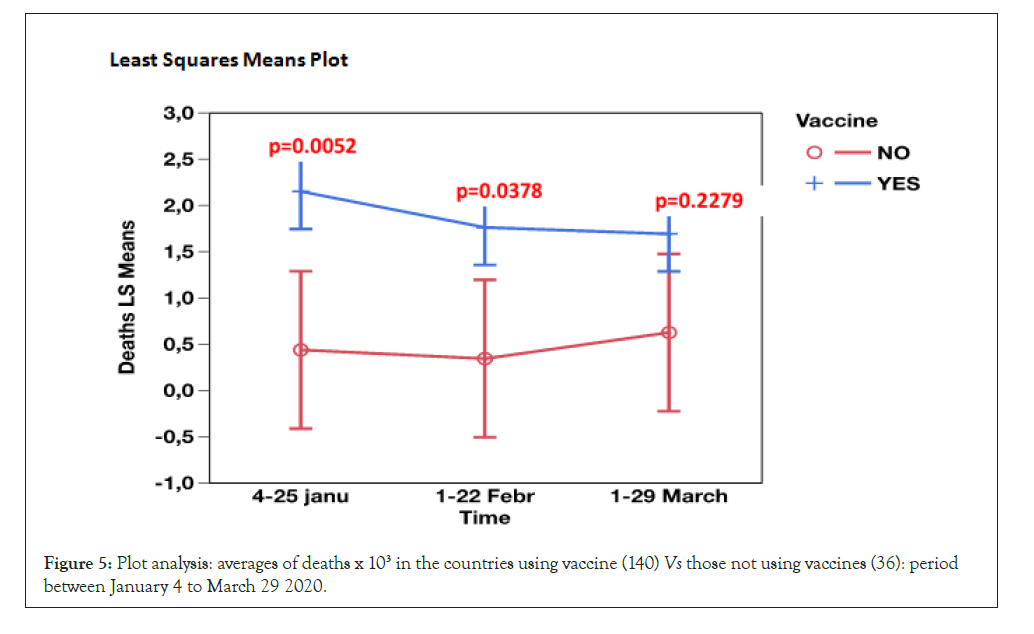
Figure 5: Plot analysis: averages of deaths x 103 in the countries using vaccine (140) Vs those 39 not using vaccines (36): Period between January 4 to March 29 2020.
In the period between 4/25 January the countries using vaccinations showed significant higher death rates than the other countries. This difference is not any more significant in the following periods (1/22 Feb and 1/22 March) due to the reduction of deaths in the countries using vaccine and the increase of deaths in the other countries.
These differences may be due to impact of the Life expectancy, Demography/Social, Ecological, and Life style variables (LEEDELS).
Deaths due to COVID-19 in relation to LEEDELS data
The relationship between number of deaths due to COVID-19 (up to 28 December) and life expectancy, ecological, demographic/ social, and lifestyle variables (LEEDELS) in the 176 countries under analysis. Table shows the results (Table 2).
| Country | COVIDn(× 103) | LE0 (years) | PDp (inh/Km2) | PUq (%) | GDPr (USD) | EDs (% GDP) | HBt (× 103) | PMu (mg/m3) | CAv (× 103) | MPz(× 103) | INw (× 103) |
|---|---|---|---|---|---|---|---|---|---|---|---|
| Afghanistan | 0.075 | 66.0 | 46 | 25.3 | 588 | 3.2 | 0.5 | 62.9 | 44 | 106 | 106 |
| Albania | 0.418 | 79.0 | 100 | 58.4 | 4583 | 3.5 | 2.9 | 14.6 | 140 | 1194 | 664 |
| Algeria | 0.066 | 77.5 | 18 | 71.3 | 4292 | 4.3 | 1.7 | 37.2 | 93 | 1207 | 429 |
| Andorra | 1.047 | 82.5 | 171 | 84.6 | 36987 | 3.3 | 2.5 | 10.9 | 686 | 1044 | 979 |
| Angola | 0.014 | 62.2 | 23 | 44.8 | 4408 | 3.4 | 1.1 | 36 | 3.3 | 447 | 130 |
| Antigua Barb.a | 0.050 | 77.5 | 227 | 23.4 | 1672 | 2.4 | 2.1 | 15.7 | nr | 1783 | 730 |
| Argentina | 0.984 | 77.2 | 16 | 91.9 | 14467 | 5.9 | 4.7 | 14 | 241 | 1398 | 710 |
| Armenia | 0.954 | 75.6 | 100 | 63.7 | 3861 | 2.8 | 4.2 | 27 | 76 | 1190 | 664 |
| Australia | 0.037 | 83.9 | 3 | 89.6 | 55707 | 5.2 | 3.8 | 6.1 | 568 | 1127 | 866 |
| Austria | 0.730 | 82.1 | 105 | 66 | 47290 | 5.4 | 7.4 | 15 | 554 | 1709 | 879 |
| Azerbaijan | 0.266 | 73.3 | 113 | 53 | 4141 | 3 | 4,9 | 33 | 118 | 1031 | 790 |
| Bahamas | 0.473 | 74.3 | 28 | 83 | 31255 | 3.6 | 2.9 | 12.8 | 258 | 894 | 800 |
| Bahrain | 0.247 | 77.7 | 1830 | 88.8 | 24029 | 2.7 | 2.0 | 79.7 | 351 | 1584 | 959 |
| Bangladesh | 0.047 | 73.6 | 1086 | 33 | 1602 | 2.5 | 0.6 | 101 | 2.4 | 881 | 182 |
| Barbados | 0.025 | 79.6 | 661 | 31.4 | 17859 | 5.1 | 6.2 | 18.4 | 292 | 1182 | 796 |
| Belgium | 1.779 | 82.2 | 371 | 97.9 | 43852 | 6.6 | 5.7 | 16 | 507 | 1046 | 877 |
| Belize | 0.642 | 75.1 | 17 | 44.8 | 4806 | 7.4 | 1.1 | 20.2 | 93 | 619 | 446 |
| Benin | 0.004 | 62.8 | 95 | 44.5 | 830 | 4.4 | 0.5 | 96 | 3.3 | 785 | 120 |
| Bhutan | 0.000 | 72.8 | 19 | 37.8 | 2903 | 7.4 | 1.7 | 55.8 | 56.3 | 905 | 418 |
| Belarus | 0.152 | 75.2 | 46 | 78.1 | 5760 | 5.0 | 8.5 | 19.8 | 320 | 1206 | 744 |
| Bolivia | 0.824 | 72.4 | 10 | 68.9 | 3353 | 7.3 | 1.1 | 22.0 | 30.4 | 992 | 397 |
| Bosnia | 1.069 | 77.9 | 67 | 39.9 | 5149 | nr | 3.5 | 39.3 | 215 | 981 | 695 |
| Botswana | 0.019 | 69.9 | 4 | 57.7 | 7787 | 9.5 | 1.8 | 23.1 | 117 | 1314 | 394 |
| Brazil | 0.941 | 76.6 | 24 | 85.9 | 9895 | 5.9 | 2.3 | 12.7 | 173 | 1130 | 609 |
| Brunei | 0.007 | 76.4 | 73 | 75.5 | 27912 | 4.4 | 3.3 | 6.4 | 296 | 1271 | 900 |
| Bulgaria | 1.902 | 75.5 | 64 | 73.5 | 8064 | 4.1 | 7.3 | 25.6 | 443 | 1204 | 634 |
| Burkina Faso | 0.004 | 63.0 | 73 | 30.7 | 664 | 4.2 | 0.4 | 110.7 | 10 | 935 | 140 |
| Burundi | 0.000 | 62.7 | 403 | 12.4 | 312 | 5.4 | 1.9 | 46.3 | 2 | 545 | 52 |
| Cambodia | 0.000 | 70.5 | 88 | 20.9 | 1390 | 1.9 | 0.7 | 26.1 | 18 | 1160 | 340 |
| Cameroon | 0.020 | 60.3 | 47 | 54.9 | 1041 | 3 | 1.3 | 139.7 | 11.6 | 819 | 232 |
| Canada | 0.425 | 83.0 | 4 | 82 | 45077 | 5.3 | 2.6 | 7.5 | 618 | 859 | 912 |
| Cabo Verde | 0.210 | 73.6 | 133 | 66.2 | 3238 | 5.4 | 2.1 | 66.6 | 59.5 | 1121 | 572 |
| Centr. Afr. R.b | 0.014 | 54.4 | 7 | 40.3 | 387 | 1.1 | 1.0 | 66.3 | 1.8 | 272 | 40 |
| Chad | 0.007 | 55.2 | 11 | 22.6 | 810 | 2.9 | 0.4 | 95.7 | 1.9 | 387 | 50 |
| Chile | 1.074 | 80.7 | 23 | 87.8 | 15070 | 4.9 | 2.1 | 22 | 162 | 1275 | 823 |
| China | 0.003 | 77.5 | 144 | 57.3 | 8643 | 2.3 | 3.8 | 56.3 | 118 | 1046 | 543 |
| Colombia | 0.882 | 77.9 | 43 | 76,7 | 6273 | 4.5 | 1.7 | 17.1 | 64 | 1268 | 623 |
| Comoros | 0.016 | 65.0 | 444 | 28.4 | 788 | 4.3 | 2.2 | 19.1 | 1 | 549 | 79 |
| Congo | 0.019 | 645.2 | 15 | 65.8 | 1858 | 6.2 | 1.6 | 55.8 | 4 | 961 | 81 |
| Congo DR. | 0.007 | 61.6 | 37 | 43.0 | 478 | 2.3 | 0.8 | 56.3 | 2 | 434 | 62 |
| Costa Rica | 0.488 | 80.9 | 97 | 77.7 | 11685 | 7.1 | 1.2 | 18.5 | 175 | 1802 | 716 |
| Croatia | 0.957 | 79.0 | 74 | 59.3 | 13138 | 4.6 | 5.5 | 19.8 | 365 | 1030 | 671 |
| Czechia | 1.130 | 79.9 | 135 | 73 | 20152 | 4 | 6.8 | 19.2 | 502 | 572 | 1190 |
| Cuba | 0.013 | 78.2 | 102 | 67.9 | 7815 | 12.8 | 4.1 | 17 | 21 | 402 | 430 |
| Cyprus | 0.106 | 81.5 | 145 | 67.5 | 24976 | 6.1 | 3.4 | 17.9 | 595 | 1385 | 807 |
| Denmark | 0.239 | 81.4 | 135 | 87.9 | 56444 | 7.6 | 2.2 | 10.3 | 419 | 1217 | 971 |
| Dominica | 0.000 | 76.0 | 98 | 69.8 | 7291 | 3.4 | 3.8 | 19.9 | nr | 1067 | 670 |
| Dominican R.c | 0.240 | 74.7 | 209 | 79.8 | 7375 | 3.7 | 1.7 | 23.7 | 109 | 814 | 639 |
| Ecuador | 0.838 | 77.7 | 65 | 63.7 | 6098 | 5.0 | 1.6 | 13.2 | 48 | 835 | 573 |
| Egypt | 0.082 | 72.5 | 94 | 42.4 | 2501 | 3.8 | 0.5 | 126 | 44.4 | 1054 | 450 |
| El Salvador | 0.205 | 74.1 | 313 | 60.2 | 4400 | 3.5 | 1.1 | 33.4 | 17 | 1565 | 290 |
| Ecuat. Guinea.d | 0.045 | 58,9 | 44 | 40.1 | 12727 | 0.6 | 2.1 | 71.2 | 3 | 471 | 238 |
| Eritrea | 0.001 | 67.5 | 44 | 22.6 | 980 | 2 | 0.7 | 50.5 | 6 | 102 | 12 |
| Estonia | 0.185 | 79.2 | 29 | 68.4 | 4491 | 7.1 | 2.1 | 5.9 | 515 | 1454 | 881 |
| Ethiopia | 0.016 | 67.8 | 96 | 19.9 | 873 | 4.5 | 6.3 | 49.7 | 1 | 597 | 154 |
| Fiji | 0.002 | 67.9 | 48 | 55.9 | 5740 | 3.9 | 2.1 | 7.7 | 106 | 1142 | 465 |
| Finland | 0.103 | 82.5 | 16 | 84.4 | 46017 | 7.2 | 4.0 | 6.0 | 608 | 1323 | 875 |
| France | 0.988 | 83.1 | 120 | 79.8 | 39869 | 5.5 | 6.0 | 12 | 496 | 1062 | 805 |
| Gabon | 0.032 | 67.0 | 7 | 87.4 | 7972 | 2.7 | 6.3 | 47.4 | 17 | 1315 | 481 |
| Gambia | 0.061 | 63.3 | 181 | 60.2 | 480 | 2.8 | 1.1 | 95 | 5 | 1392 | 185 |
| Georgia | 0.700 | 74.2 | 65 | 57.2 | 4099 | 3.8 | 3.1 | 20.7 | 220 | 1465 | 605 |
| Germany | 0.424 | 81.9 | 231 | 75.5 | 44550 | 4.9 | 8.1 | 13.5 | 548 | 1291 | 844 |
| Ghana | 0.011 | 64.9 | 121 | 54.7 | 1663 | 6.2 | 0.9 | 54.2 | 20 | 1275 | 347 |
| Greece | 0.455 | 82.8 | 81 | 78.3 | 18637 | 4.4 | 4.2 | 11.3 | 480 | 1159 | 6.1 |
| Grenada | 0.009 | 72.6 | 312 | 35.6 | 10360 | 10.3 | 3.5 | 18.5 | 156 | 1050 | 557 |
| Guatemala | 0.288 | 70.1 | 155 | 52 | 4472 | 2.8 | 0.6 | 28.5 | 41 | 1182 | 354 |
| Guinea | 0.007 | 62.6 | 48 | 35.3 | 749 | 2.4 | 0.3 | 46 | 0.4 | 871 | 98 |
| Guinea Bissau | 0.029 | 59.4 | 43 | 50.1 | 794 | 2.1 | 1.0 | 59.2 | 7 | 771 | 38 |
| Guyana | 0.202 | 70.3 | 4 | 28.7 | 4710 | 3.2 | 2.5 | 19.7 | 85 | 827 | 357 |
| Haiti | 0.022 | 65.0 | 401 | 59.8 | 784 | 1.4 | 1.3 | 23.5 | 4 | 591 | 122 |
| Honduras | 0.356 | 75.9 | 79 | 54.4 | 2766 | 5.9 | 0.8 | 29.5 | 34 | 889 | 300 |
| Hungary | 1.001 | 77.3 | 105 | 71.7 | 15331 | 4.6 | 7.0 | 24.6 | 337 | 768 | 1475 |
| Iceland | 0.000 | 83.5 | 3 | 94.2 | 70332 | 7.8 | 3.1 | 7.3 | 688 | 1126 | 982 |
| India | 0.113 | 70.4 | 403 | 33.1 | 1983 | 3.8 | 0.5 | 75.8 | 20 | 873 | 295 |
| Indonesia | 0.086 | 72.3 | 137 | 54.5 | 3876 | 3.6 | 0.9 | 16.7 | 53 | 1738 | 323 |
| Iran | 0.694 | 77.3 | 49 | 74 | 5305 | 3.4 | 0.1 | 49 | 150 | 1073 | 604 |
| Iraq | 0.399 | 71.1 | 86 | 69.6 | 5088 | 2.6 | 1.1 | 73.3 | 46 | 871 | 494 |
| Ireland | 0.489 | 82.8 | 68 | 63.5 | 23909 | 7.8 | 3.1 | 7.3 | 688 | 1226 | 982 |
| Israel | 0.385 | 83.5 | 422 | 92.2 | 40258 | 5.7 | 3.0 | 18.7 | 310 | 1267 | 816 |
| Italy | 1.233 | 84.0 | 200 | 69.1 | 31984 | 4.1 | 3.2 | 15.5 | 625 | 816 | 613 |
| Jamaica | 0.111 | 74.5 | 248 | 55 | 5048 | 5.4 | 1.7 | 15.1 | 54 | 1096 | 444 |
| Japan | 0.028 | 85.0 | 335 | 93.9 | 38440 | 3.6 | 13.1 | 13 | 311 | 1335 | 909 |
| Jordan | 0.386 | 75.0 | 113 | 90.3 | 5768 | 3.9 | 1.4 | 37.2 | 140 | 1038 | 623 |
| Kazakhstan | 0.157 | 73.9 | 7 | 57.4 | 8841 | 3.0 | 6.0 | 19.7 | 230 | 1454 | 764 |
| Kenya | 0.037 | 67.5 | 75 | 26.1 | 1702 | 5.3 | 1.4 | 16.3 | 19 | 682 | 166 |
| Korea South | 0.019 | 83.5 | 511 | 82.6 | 29891 | 5.1 | 12.0 | 28.7 | 327 | 1249 | 951 |
| Kosovo | 0.729 | 70.0 | 164 | 38 | 3811 | nr | 2.1 | nr | 156 | 258 | nr |
| Kuwait | 0.216 | 75.9 | 243 | 98.4 | 27319 | 3.8 | 1.8 | 111 | 394 | 1242 | 980 |
| Kyrgyzstan | 0.217 | 72.0 | 31 | 35.9 | 1144 | 6.0 | 4.5 | 17.9 | 149 | 1219 | 345 |
| Laos | 0.000 | 68.9 | 29 | 39.7 | 2542 | 2.9 | 1.1 | 27.7 | 11 | 541 | 219 |
| Latvia | 0.334 | 75.7 | 30 | 68.5 | 15547 | 5.3 | 5.7 | 337 | 32.6 | 813 | 814 |
| Lebanon | 0.275 | 79.3 | 514 | 87.9 | 11409 | 2.5 | 3.5 | 32.6 | 119 | 814 | 761 |
| Lesotho | 0.025 | 55.7 | 66 | 34.2 | 1425 | 13 | 1.3 | 26.9 | 6.3 | 1066 | 274 |
| Liberia | 0.018 | 65.0 | 41 | 50.1 | 729 | 2.8 | 0.8 | 17.3 | 4.5 | 676 | 73 |
| Libya | 0.236 | 73.4 | 4 | 78.8 | 4589 | 2.7 | 3.7 | 63.7 | 346 | 1217 | 203 |
| Liechtenstein | 1.158 | 81.8 | 231 | 14.3 | 152933 | 2.6 | 1.6 | 30.2 | 767 | 1043 | 952 |
| Lithuania | 0.660 | 76.4 | 43 | 67.1 | 16730 | 4.5 | 6.7 | 16.7 | 450 | 1509 | 776 |
| Luxembourg | 0.915 | 82.8 | 233 | 90.4 | 105803 | 4.0 | 4.6 | 16.1 | 678 | 1361 | 978 |
| Madagascar | 0.011 | 68.2 | 42 | 35.7 | 448 | 2.1 | 0.2 | 21.5 | 8.2 | 341 | 98 |
| Malawi | 0.014 | 65.5 | 147 | 16.5 | 324 | 4.7 | 1.3 | 28.3 | 4 | 417 | 115 |
| Malaysia | 0.015 | 76.7 | 97 | 75.4 | 9813 | 4.8 | 1.9 | 17.6 | 370 | 1339 | 801 |
| Malta | 0.515 | 83.1 | 1460 | 95.5 | 27250 | 7.2 | 4.7 | 12.1 | 615 | 1300 | 801 |
| Mauritania | 0.092 | 65.6 | 4 | 60.4 | 1318 | 2.6 | 0.4 | 123.6 | 5.5 | 922 | 180 |
| Mauritius | 0.008 | 75.5 | 618 | 39.5 | 9794 | 5.1 | 3.6 | 14.5 | 144 | 1454 | 522 |
| Mexico | 1.023 | 75.4 | 63 | 79.5 | 9304 | 5.3 | 1.5 | 18.8 | 220 | 885 | 639 |
| Moldova | 0.979 | 72.3 | 99 | 38.2 | 2280 | 6.7 | 5.3 | 19.9 | 177 | 904 | 710 |
| Monaco | 0.103 | 85.4 | 18867 | 100 | 168004 | 1.4 | 13.8 | nr | 737 | 852 | 952 |
| Mongolia | 0.000 | 70.5 | 2 | 72.8 | 3640 | 5.2 | 6.8 | 29.7 | 112 | 1264 | 223 |
| Montenegro | 1.130 | 77.3 | 45 | 64.2 | 7647 | 3.9 | 3.9 | 20 | 280 | 1661 | 713 |
| Morocco | 0.217 | 77.4 | 78 | 60.7 | 3151 | 6.3 | 0.8 | 25.4 | 75 | 1229 | 618 |
| Mozambique | 0.004 | 62.1 | 36 | 32.1 | 429 | 6.5 | 0.8 | 21 | 17.1 | 400 | 175 |
| Myanmar | 0.051 | 67.8 | 78 | 34.7 | 1264 | 2.2 | 0.9 | 48.8 | 10.1 | 899 | 251 |
| Namibia | 0.090 | 64.9 | 3 | 47.3 | 5413 | 8.3 | 2.7 | 25.9 | 42 | 1045 | 310 |
| Nepal | 0.065 | 71.7 | 197 | 19 | 834 | 3.7 | 0.3 | 78.5 | 5.2 | 1232 | 197 |
| Netherlands | 0.686 | 82.8 | 411 | 91 | 48346 | 5.5 | 3.6 | 15.2 | 484 | 1205 | 932 |
| New Zealand | 0.005 | 82.8 | 18 | 86.3 | 41593 | 6.3 | 2.7 | 5.5 | 553 | 1360 | 885 |
| Nicaragua | 0.012 | 75.2 | 49 | 58.2 | 2207 | 2.8 | 0.9 | 23 | 1316 | 1316 | 246 |
| Niger | 0.005 | 63.6 | 16 | 16.3 | 440 | 6.0 | 0.3 | 203.7 | 8.3 | 409 | 102 |
| Nigeria | 0.007 | 55.8 | 209 | 48.6 | 1994 | 0.7 | 0.5 | 122.5 | 6.3 | 759 | 257 |
| North Maced.e | 1.215 | 76.3 | 81 | 57.2 | 5474 | 3.4 | 4.4 | 32 | 180 | 1019 | 722 |
| Norway | 0.084 | 82.9 | 16 | 80.7 | 74941 | 7.7 | 3.7 | 8 | 505 | 1078 | 965 |
| Oman | 0.010 | 78.6 | 15 | 78.1 | 17973 | 6.2 | 1.6 | 78 | 172 | 1498 | 769 |
| Pakistan | 0.049 | 67.8 | 261 | 36.4 | 1541 | 2.8 | 0.6 | 75.8 | 13 | 734 | 155 |
| Panama | 1.007 | 79.1 | 54 | 66.9 | 15089 | 3.2 | 2.2 | 14.1 | 127 | 1459 | 540 |
| Papua New G.f | 0.001 | 65.2 | 17 | 13 | 2861 | nr | 4.0 | 13.7 | 8.2 | 468 | 96 |
| Paraguay | 0.325 | 74.6 | 17 | 13 | 4260 | 4.0 | 1.1 | 23.7 | 57 | 1097 | 611 |
| Peru | 1.208 | 77.7 | 24 | 78.9 | 6762 | 3.8 | 1.5 | 26.1 | 48 | 1210 | 487 |
| Philippines | 0.090 | 71.7 | 344 | 44.3 | 2976 | 2.7 | 0.97 | 23.3 | 12.2 | 1104 | 555 |
| Poland | 0.750 | 79.3 | 123 | 60.2 | 13823 | 4.9 | 6.6 | 26 | 564 | 1305 | 760 |
| Portugal | 0.685 | 82.7 | 112 | 64 | 21161 | 5.1 | 3.4 | 9.5 | 453 | 1139 | 738 |
| Qatar | 0.095 | 80.7 | 222 | 99.3 | 60804 | 3.6 | 1.2 | 148.2 | 114 | 1483 | 943 |
| Romania | 0.793 | 76.5 | 82 | 53.6 | 10757 | 3.1 | 6.8 | 19.1 | 277 | 1146 | 638 |
| Russian Fed.g | 0.403 | 73.0 | 9 | 74.3 | 10608 | 3.8 | 8.2 | 15.5 | 285 | 1579 | 760 |
| Rwanda | 0.009 | 70.0 | 448 | 25.8 | 772 | 3.5 | 1.7 | 53 | 4.3 | 722 | 200 |
| Saint K. and N.h | 0.000 | 75.1 | 202 | 32.2 | 16296 | 2.8 | 2.3 | nr | 153 | 1389 | 768 |
| San Marino | 1.830 | 85.1 | 545 | 94.2 | 47406 | 2.4 | 3.8 | nr | 1095 | 1138 | 508 |
| Santa Lucia | 0.028 | 76.7 | 289 | 18.5 | 9607 | 5.7 | 1.1 | 17.3 | 157 | 988 | 467 |
| Saint Vin. Gren.i | 0.000 | 73.0 | 282 | 50.9 | 7271 | 5.8 | 2.2 | 17.4 | 145 | 1057 | 656 |
| Sao Tome P.L | 0.085 | 66.2 | 200 | 65.6 | 1785 | 3.7 | 2.9 | 15.4 | 30 | 950 | 280 |
| Saudi Arabia | 0.192 | 75.7 | 15 | 83.3 | 21120 | 5.6 | 2.2 | 187.9 | 132 | 1221 | 801 |
| Senegal | 0.027 | 68.9 | 78 | 44.1 | 1038 | 7.1 | 0.3 | 56.8 | 16.4 | 994 | 257 |
| Serbia | 0.649 | 76.3 | 91 | 55.7 | 5899 | 4.0 | 5.6 | 18.8 | 258 | 1241 | 703 |
| Seychelles | 0.000 | 73.7 | 210 | 54.2 | 15686 | 3.6 | 3.3 | 14.8 | 141 | 1766 | 565 |
| Sierra Leone | 0.010 | 55.9 | 100 | 40.3 | 491 | 2.9 | 0.4 | 42.1 | 5.2 | 849 | 118 |
| Singapore | 0.008 | 80.1 | 5509 | 100 | 57713 | 2.9 | 3.5 | 25 | 155 | 1482 | 844 |
| Slovakia | 0.415 | 78.0 | 102 | 53.8 | 23654 | 5.3 | 4.5 | 17.8 | 531 | 1174.6 | 789 |
| Slovenia | 1.482 | 81.6 | 102 | 49.6 | 23564 | 5.3 | 4.5 | 17.8 | 531 | 1175 | 789 |
| Somalia | 0.009 | 58.3 | 22 | 40 | 92 | nr | 0.8 | 23.9 | 1.8 | 465 | 19 |
| South Africa | 0.525 | 64.9 | 46 | 65.3 | 6180 | 5.9 | 2.3 | 35.9 | 116 | 1620 | 540 |
| Spain | 1.170 | 84.0 | 92 | 64.2 | 28359 | 4.3 | 3.0 | 10 | 439 | 1132 | 846 |
| Sri Lanka | 0.010 | 77.6 | 327 | 18.4 | 4085 | 1.6 | 3.7 | 25.6 | 27.4 | 1351 | 846 |
| Sudan | 0.039 | 66.1 | 22 | 34 | 1428 | 2.2 | 0.8 | 77.7 | 1.3 | 707 | 280 |
| Suriname | 0.220 | 72.1 | 3 | 66 | 5746 | 6.7 | 3.1 | 21.5 | 148 | 1413 | 545 |
| Sweden | 1.066 | 83.3 | 23 | 86 | 53218 | 7.7 | 2.3 | 5.2 | 473 | 1255 | 964 |
| Swaziland | 0.206 | 61.1 | 63 | 21.3 | 3915 | 7.1 | 2.1 | 24.2 | 39.4 | 741 | 286 |
| Switzerland | 0.924 | 84.3 | 205 | 74 | 80591 | 5.1 | 4.5 | 10.5 | 535 | 1332 | 937 |
| Syria | 0.304 | 76.1 | 115 | 58.1 | 1203 | 5.5 | 1.5 | 43.5 | 35.5 | 857 | 319 |
| Tajikistan | 0.010 | 71.8 | 61 | 26.3 | 824 | 5.2 | 4.6 | 61.4 | 39.3 | 1076 | 205 |
| Tanzania | 0.000 | 66.4 | 55 | 32.3 | 1034 | 3.5 | 1.1 | 22.3 | 0.5 | 697 | 130 |
| Thailand | 0.001 | 77.7 | 132 | 51.5 | 6591 | 4.1 | 2.1 | 23.2 | 109 | 1760 | 529 |
| Timor Leste | 0.000 | 70.2 | 82 | 33.4 | 2104 | 7.5 | 5.9 | 17 | 9 | 1193 | 252 |
| Togo | 0.009 | 62.1 | 134 | 40.5 | 611 | 5.1 | 0.7 | 84.1 | 19.2 | 798 | 1234 |
| Trinidad Tobago | 0.094 | 79.3 | 265 | 8.4 | 15769 | 4.2 | 2.7 | 16.8 | 259 | 1483 | 733 |
| Tunisia | 0.416 | 77.4 | 676 | 70 | 3469 | 6.6 | 1.8 | 35.6 | 89 | 1243 | 555 |
| Turkey | 0.265 | 78.5 | 104 | 73.9 | 10512 | 4.4 | 2.7 | 37.3 | 142 | 968 | 647 |
| Uganda | 0.007 | 64.4 | 156 | 21.4 | 699 | 2.3 | 0.5 | 73.5 | 4.2 | 582 | 219 |
| Ukraine | 0.455 | 72.4 | 73 | 69.2 | 2583 | 5.9 | 7.8 | 19.2 | 171 | 1335 | 530 |
| Un. Arab. Emir.m | 0.115 | 78.5 | 73 | 85.8 | 37226 | 1.0 | 2.1 | 105,1 | 346 | 2109 | 948 |
| United Kingdom | 1.152 | 81.8 | 272 | 82.8 | 39735 | 5.6 | 2.6 | 11.5 | 475 | 1196 | 948 |
| United States | 1.060 | 79.1 | 35 | 81.8 | 59501 | 5.0 | 2.8 | 9.2 | 357 | 1220 | 762 |
| Uruguay | 0.055 | 78.4 | 20 | 95.5 | 16722 | 4.4 | 2.5 | 11.5 | 216 | 1475 | 664 |
| Uzbekistan | 0.020 | 72.0 | 72 | 50.6 | 1491 | 7.7 | 4.4 | 46.7 | 36.5 | 760 | 468 |
| Venezuela | 0.033 | 72.3 | 34 | 89 | 6684 | 6.9 | 0.9 | 26.3 | 114 | 766 | 600 |
| Vietnam | 0.000 | 75.8 | 280 | 34.5 | 2354 | 5.7 | 2.7 | 26.3 | 2 | 1256 | 465 |
| Yemen | 0.022 | 66.4 | 52 | 35.2 | 551 | 5.2 | 0.7 | 72.6 | 22.4 | 596 | 246 |
| Zambia | 0.024 | 64.7 | 22 | 41.4 | 1480 | 0.8 | 2.0 | 30.6 | 16 | 786 | 255 |
| Zimbabwe | 0.026 | 62.2 | 38 | 32.3 | 1176 | 8.4 | 3.9 | 24.5 | 57.3 | 826 | 213 |
| 176 countries | |||||||||||
| r Vs COVID-19 | -0.025 | -0.051 | 0.383 | 0.304 | -0.008 | 0.306 | -0.221 | 0.584 | 0.203 | 0.533 | |
| P | >0.05 | >0.05 | <0.01 | <0.01 | >0.05 | <0.001 | <0.01 | <0.01 | <0.01 | <0.01 |
aAntigua Bar: Antigua Barbuda; b Cent. Afr. R.: Central African Republic; c Dominica R.: Dominican Republic; d Ecuat. Guinea: Ecuatorial Guinea; e North Maced.: North Macedonia; g Russian Fed.: Russian Federation; f Papua New G.: Papua New Guinea; h Saint K and N.: Sain Kitts and Nevis; i Saint Vin. Gren.: Saint Vincent and Grenadines; L Sao Tome P.: Sao Tome and Principe; L Un. Arab. Emir.: United Arab Emirates; n COVID- 19: deaths × 103; o LE: life expectancy in years; p PD: population density as inhabitants/Km2; q UP: urban population%; r GDP: Gross domestic product in USD; s ED: education expenses as % of GDP; t HB: Hospital beds × 103inhabitants; u PM: particulate matter 2.5-10 μ in mg/m3; v CA: cars × 103inhabitants; v MP: mobile phones × 103inhabitants; w IN: internet × 103inhabitants
Table 2: COVID-19 Deaths × 103 at December 28 2020 in 176 world countries and the relative LEEDELS.
COVID-19 shows significant direct correlation with all variables associated with the prosperity of a country such as GDP, hospital beds, cars, mobile phones, and internet connections. The negative correlation with PM could be interpreted as a secondary effect of the tendency in the most prosperous countries to reduce pollution.
Other variables were also considered such as the percentage of people over 65 years of age, the ratio between 65-year-olds/other ages, and the percentage of land covered by forests. None of these further variables were correlated with COVID-19 deaths.
Vaccinations
In theory, the effect of any vaccination on the mortality rate will take some time to become evident. COVID-19 is a new disease, which was not around in the past, and no data are available to determine the efficacy of any vaccine. In this review we have tentatively calculated their effect considering the time needed for symptoms to emerge, which is about 5 days on average, and for death to occur, which is 2 to 3 weeks after the symptoms appear.
In other words, at least four weeks have to pass before a vaccination campaign could lead to a decrease in death rate in a population. For this reason, we compared two time periods to calculate the effect of vaccination on mortality rate:
a) The four weeks immediately after the start of the vaccination campaign, which correspond to the plateau in the world death rate curve (see Figure 1).
b) The four weeks starting from one month after the start of the vaccination campaign, which is the period in which some initial activity of the vaccinations should be seen according to the number of shots administered.
This means that the weekly values from 4 to 25 January were compared with those from 2 to 29 March. The difference between the two periods was considered to be a measure of vaccine efficacy in relation to the vaccine coverage up to 30 March (Table 3).
| Country | Vaccine 103 | Country | Vaccine 103 | Country | Vaccine 103 | Country | Vaccine 103 |
|---|---|---|---|---|---|---|---|
| Afganistan | 1.13 | Denmark | 187.30 | Laos | 2.53 | Rwanda | 29.72 |
| Albania | 8.51 | Dominica | 213.98 | Latvia | 63.07 | Saint K. and N. | 148.37 |
| Algeria | 0 | Dominican R. | 76.40 | Lebanon | 34.23 | San Marino | 237.34 |
| Andorra | 122.53 | Ecuador | 11.40 | Lesotho | 7.88 | Santa Lucia | 117.61 |
| Angola | 3.80 | Egypt | 0.01 | Liberia | 0 | Saint Vin. Gren. | 84.64 |
| Antigua Barb. | 257.52 | El Salvador | 9.97 | Libya | 0 | Sao Tome P. | 53.64 |
| Argentina | 76.42 | Ecuat. Guinea | 4.82 | Liechtenstein | 147.35 | Saudi Arabia | 109.21 |
| Armenia | 0 | Eritrea | 0 | Lithuania | 152.97 | Senegal | 19.31 |
| Australia | 24.19 | Estonia | 193.62 | Luxembourg | 163.13 | Serbia | 34.85 |
| Austria | 184.44 | Ethiopia | 0 | Madagascar | 0 | Seychelles | 984.88 |
| Azerbaijan | 26.00 | Fiji | 0 | Malawi | 6.43 | Sierra Leone | 2.35 |
| Bahamas | 0.28 | Finland | 179.29 | Malaysia | 12.47 | Singapore | 332.57 |
| Bahrein | 530.58 | France | 163.54 | Malta | 369.62 | Slovakia | 173.07 |
| Bangladesh | 32.08 | Gabon | 0.27 | Mauritania | 0 | Slovenia | 165.99 |
| Barbados | 220.23 | Gambia | 3.35 | Mauritius | 106.95 | Somalia | 0.89 |
| Belgium | 158.97 | Georgia | 1.31 | Mexico | 50.55 | South Africa | 3.24 |
| Belize | 47.49 | Germany | 158.30 | Moldova | 12.11 | Spain | 163.40 |
| Benin | 0 | Ghana | 18.04 | Mongolia | 32.05 | Sri Lanka | 40.56 |
| Belarus | 9.49 | Greece | 148.17 | Monaco | 258.49 | Sudan | 0.01 |
| Bolivia | 22.73 | Grenada | 107.22 | Montenegro | 38.23 | Suriname | 33.31 |
| Bosnia | 0 | Guatemala | 4.91 | Morocco | 222.24 | Sweden | 162.88 |
| Botswana | 0 | Guinea | 4,15 | Mozambique | 2.43 | Swaziland | 2.95 |
| Brazil | 79.71 | Guinea Bissau | 0 | Myanmar | 1.99 | Switzerland | 173.78 |
| Brunei | 0 | Guyana | 30.44 | Namibia | 0.06 | Syria | 0 |
| Bulgaria | 63.65 | Haiti | 0 | Nepal | 60.67 | TaJikistan | 0 |
| Burkina Faso | 0 | Honduras | 5.99 | Netherlands | 141.33 | Tanzania | 0 |
| Burundi | 0 | Hungary | 263.57 | New Zealand | 8.66 | Thailand | 1.78 |
| Cambodia | 25.36 | Iceland | 189.65 | Nicaragua | 0 | Timor Leste | 0 |
| Cameroon | 0 | India | 41.28 | Niger | 0 | Togo | 5.16 |
| Canada | 128.53 | Indonesia | 37.21 | Nigeria | 3.30 | Trinidad Tobago | 0.84 |
| Cabo Verde | 5.06 | Iran | 2.51 | North Maced. | 4.77 | Tunisia | 3.87 |
| Centr. Afr.R. | 0 | Iraq | 0.58 | Norway | 166.38 | Turkey | 195.95 |
| Chad | 0 | Ireland | 176.77 | Oman | 30.02 | Uganda | 1.33 |
| Chile | 603.82 | Israel | 1123.94 | Pakistan | 3.17 | Ukraina | 5.88 |
| China | 82.95 | Italy | 152.52 | Panama | 75.97 | Un. Arab. Emir. | 1353.78 |
| Colombia | 29.95 | Jamaica | 12.33 | Papua New G. | 0 | United Kingdom | 542.04 |
| Comoros | 0 | Japan | 0.37 | Paraguay | 2.63 | United States | 416.14 |
| Congo | 0.05 | Jordan | 36.44 | Peru | 25.13 | Uruguay | 137.33 |
| Congo D.R. | 0 | Kazakhstan | 14.17 | Philippines | 2.83 | Uzbekistan | 0 |
| Costa Rica | 77.38 | Kenia | 0.20 | Poland | 155.20 | Venezuela | 0 |
| Croatia | 109.16 | Korea South | 16.79 | Portugal | 164.55 | Vietnam | 0.02 |
| Czechia | 148.35 | Kossovo | 0 | Qatar | 306.38 | Yemen | 0 |
| Cuba | 0 | Kuwait | 115.47 | Romania | 146.33 | Zambia | 0 |
| Cyprus | 120.64 | Kyrgyzstan | 0 | Russian Fed. | 77.47 | Zimbawe | 2.99 |
| < 0.01 | < 0.01 | < 0.01 | < 0.01 | < 0.01 | < 0.01 | < 0.01 | < 0.01 |
Table 3: Vaccine shots per 103 inhabitants administered up to 30 March.
The number of shots administered was very different in each country, with values from 0 per 103 inhabitants (in 36 countries) up to 1353.78 per 103 inhabitants (United Arab Emirates). Values above 1000 are due to the need for two shots/inhabitant (complete coverage of the population would be 2000 per 103).
COVID-19 vaccine is rarely administered to children under 15 years old. This means that the values shown in Table 2 underestimate the real coverage of the over-15-year-old population by at least 10% (13.2% of world inhabitants are under 16 years old). In the age pyramids of world countries, the differences in the percentages of under 15-year-olds does not exceed 5%. Therefore, the number of vaccine shots/people shown in Table 2 is minimally affected by the age structure of the country.
The differences between the period January 4/22 (baseline period) and March 2/29 (after vaccinations) was calculated for each country and reported as DJM (difference January/March) as deaths × 103 inhabitants . The data are summarized (Table 4).
| Country | DMJ | Country | DMJ | Country | DMJ | Country | DMJ | ||||
|---|---|---|---|---|---|---|---|---|---|---|---|
| Afganistan | 0.441 | Denmark | 12.272 | Laos | 0 | Rwanda | 0.432 | ||||
| Albania | -5.540 | ↑ | Dominica | 0 | Latvia | 13.793 | Saint K. and N. | 0 | |||
| Algeria | 0.000 | Dominican R. | 0.576 | Lebanon | 3.520 | San Marino | -6.061 | ↑ | |||
| Andorra | 15.000 | Ecuador | -0.584 | ↑ | Lesotho | 5.082 | Santa Lucia | -5.618 | ↑ | ||
| Angola | 0.099 | Egypt | 0.372 | Liberia | 0.022 | Saint Vin. Gren. | 0 | ||||
| Antigua Barb. | -5.941 | ↑ | El Salvador | 2.066 | Libya | -1.478 | ↑ | Sao Tome P. | -2.000 | ↑ | |
| Argentina | 2.958 | Ecuat. Guinea | -0.364 | ↑ | Liechtenstein | 18.919 | Saudi Arabia | -1.014 | ↑ | ||
| Armenia | 0 | Eritrea | 0.089 | Lithuania | 20.116 | Senegal | 0.328 | ||||
| Australia | 0 | Estonia | -8.587 | ↑ | Luxembourg | -3.091 | ↑ | Serbia | -2.369 | ↑ | |
| Austria | 9.238 | Ethiopia | -0.360 | ↑ | Madagascar | -5.301 | ↑ | Seychelles | -5.208 | ↑ | |
| Azerbaijian | 0.398 | Fiji | 0 | Malawi | 2.262 | Sierra Leone | 0.041 | ||||
| Bahamas | -0.256 | ↑ | Finland | 0.567 | Malaysia | -0.015 | ↑ | Singapore | 0 | ||
| Bahrein | -2.879 | ↑ | France | 4.725 | Malta | -5.176 | ↑ | Slovakia | 2.324 | ||
| Bangladesh | -0.156 | ↑ | Gabon | -1.263 | ↑ | Mauritania | 1.401 | Slovenia | 28.163 | ||
| Barbados | 0 | Gambia | -0.041 | ↑ | Mauritius | -0158 | ↑ | Somalia | -1.760 | ↑ | |
| Belgium | 5.686 | Georgia | 9.145 | Mexico | 12.774 | South Africa | 21.201 | ||||
| Belize | 12.887 | Germany | 21.789 | Moldova | -22.582 | ↑ | Spain | 18.082 | |||
| Benin | 0 | Ghana | -0.148 | ↑ | Mongolia | -0.160 | ↑ | Sri Lanka | 0.093 | ||
| Belarus | 0.200 | Greece | -6.827 | ↑ | Monaco | 0.020 | Sudan | 0.142 | |||
| Bolivia | 4.701 | Grenada | 0 | Montenegro | -19.672 | ↑ | Suriname | 5.197 | |||
| Bosnia | -25.026 | ↑ | Guatemala | 2.499 | Morocco | 1.868 | Sweden | 19.273 | |||
| Botswana | 0 | Guinea | -0.252 | ↑ | Mozambique | 0,506 | Swaziland | 29.438 | |||
| Brazil | -18.386 | ↑ | Guinea Bissau | -0.102 | ↑ | Myanmar | 0.771 | Switzerland | 13.719 | ||
| Brunei | 0 | Guyana | -2.070 | ↑ | Namibia | 1.815 | Syria | -0.025 | ↑ | ||
| Bulgaria | -21.857 | ↑ | Haiti | 0.065 | Nepal | 0.466 | TaJikistan | 0 | |||
| Burkina Faso | 0.138 | Honduras | 0.451 | Netherlands | 9.507 | Tanzania | 0 | ||||
| Burundi | -0.027 | ↑ | Hungary | -30.282 | ↑ | New Zealand | 0 | Thailand | 0.004 | ||
| Cambodia | -0.120 | ↑ | Iceland | 0 | Nicaragua | 0 | Timor Leste | 0 | |||
| Cameroon | -0.949 | ↑ | India | -0.153 | ↑ | Niger | 0.276 | Togo | -0.145 | ↑ | |
| Canada | 8.703 | Indonesia | 1.178 | Nigeria | 0.941 | Trinidad Tobago | 0.074 | ||||
| Cabo Verde | 0.186 | Iran | 0.058 | North Maced. | -16.819 | ↑ | Tunisia | 10.056 | |||
| Centr. Af. R. | -0.196 | ↑ | Iraq | -2.081 | ↑ | Norway | 1.665 | Turkey | 1.803 | ||
| Chad | -0.069 | ↑ | Ireland | 16.139 | Oman | -1.535 | ↑ | Uganda | 0.130 | ||
| Chile | -5.124 | ↑ | Israel | 10.877 | Pakistan | -7.989 | ↑ | Ukraina | -8.171 | ↑ | |
| China | 0.002 | Italy | 3.566 | Panama | 23.235 | Uni. Arab. Emir | -0.889 | ↑ | |||
| Colombia | 12.805 | Jamaica | -4.471 | ↑ | Papua New G. | -0.557 | ↑ | United Kingdom | 44.349 | ||
| Comoros | 9.190 | Japan | 0.878 | Paraguay | -0.841 | ↑ | United States | 17.342 | |||
| Congo | 0.234 | Jordan | -17.935 | ↑ | Peru | -6.012 | ↑ | Uruguay | -4.943 | ↑ | |
| Congo D.R. | 0.055 | Kazakhstan | -0.782 | ↑ | Philippines | 0.443 | Uzbekistan | -0.009 | ↑ | ||
| Costa Rica | 6.382 | Kenia | -0.571 | ↑ | Poland | -4.029 | ↑ | Venezuela | -0.347 | ↑ | |
| Croatia | 14.443 | Korea South | 0.662 | Portugal | 46.479 | Vietnam | 0 | ||||
| Czechia | -8.011 | ↑ | Kosovo | -6.249 | ↑ | Qatar | -1.395 | ↑ | Yemen | 7.968 | |
| Cuba | -0.178 | ↑ | Kuwait | -4.550 | ↑ | Romania | -3.880 | ↑ | Zambia | 1.458 | |
| Cyprus | 3.202 | Kyrgyzstan | 0.288 | Russian Fed. | 2.195 | Zimbawe | 5.257 |
↑: increase of deaths; DJM: difference between the weeks of 4/25 January and 8/29 March
Table 4: Differences of deaths × 103 (DJM) of the period between January 4/22 and March 8/29.
Comparing the two periods, 66 of the 176 countries (37%) show an increase in death rate, and 48 of these countries were among those which started the vaccination program. The correlation between the differences in number of deaths between the two periods and the numbers of vaccine doses is not statistically significant (ρ =0.0708 p> 0.05). A few examples of trends in number of deaths during the period from 4 January to 29 March are shown in countries with different vaccine coverages: high, none, and less than 20%.
Countries with the highest vaccine coverage
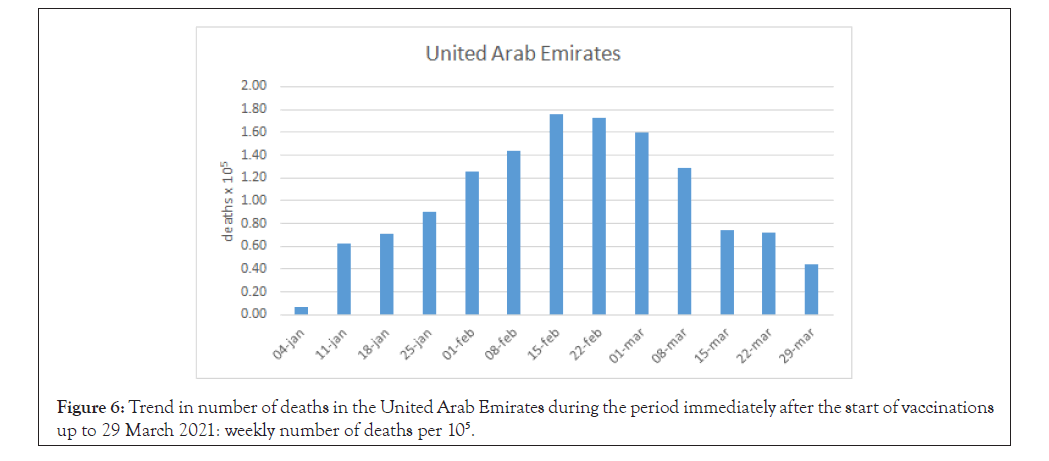
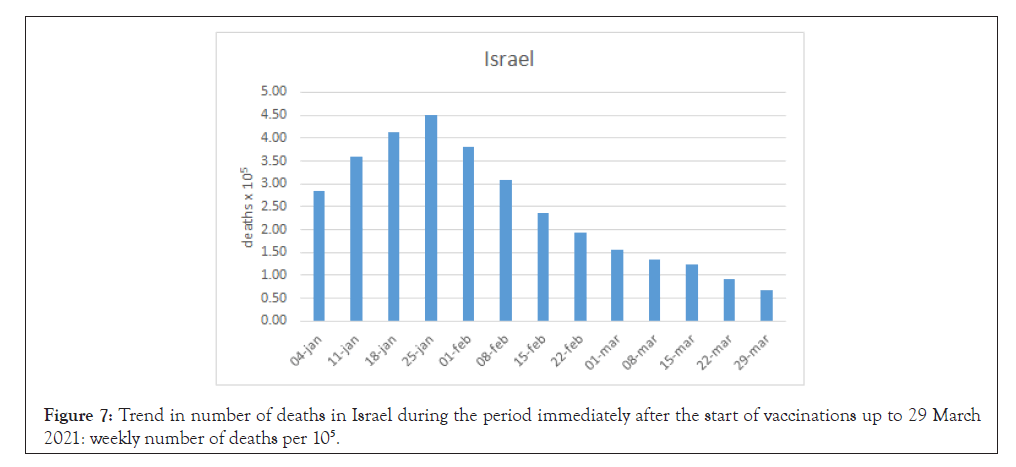
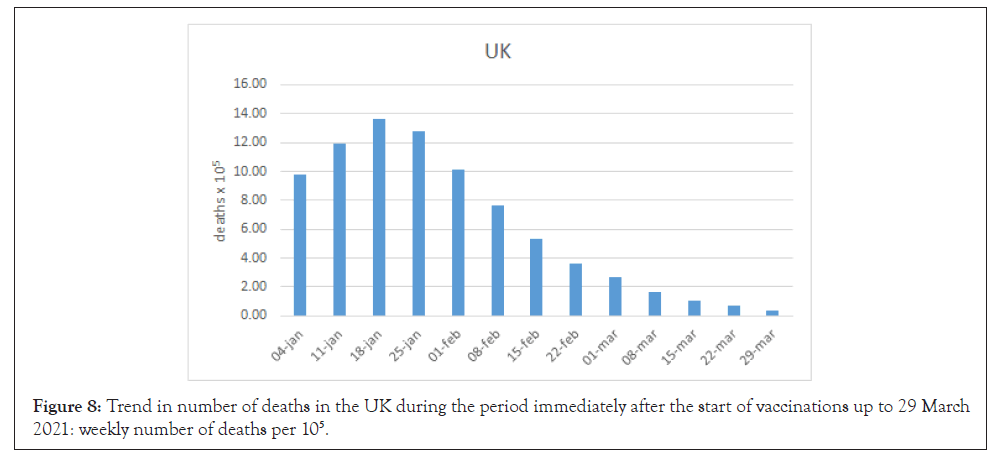
United Arab Emirates (1353.38 × 103 inhabitants - Figure 6 ); Israel (1123.94 per 103 inhabitants - Figure 7 ); the UK (542.04 per 103 inhabitans - Figure 8); and the USA (416.1 per 103 inhabitants - Figure 9 ).
Figure 6: Trend in number of deaths in the United Arab Emirates during the period immediately after the start of vaccinations up to 29 March 2021: weekly number of deaths per 105
Figure 7: Trend in number of deaths in Israel during the period immediately after the start of vaccinations up to 29 March 2021: weekly number of deaths per 105.
Figure 8: Trend in number of deaths in the UK during the period immediately after the start of vaccinations up to 29 March 2021: weekly number of deaths per 105 .
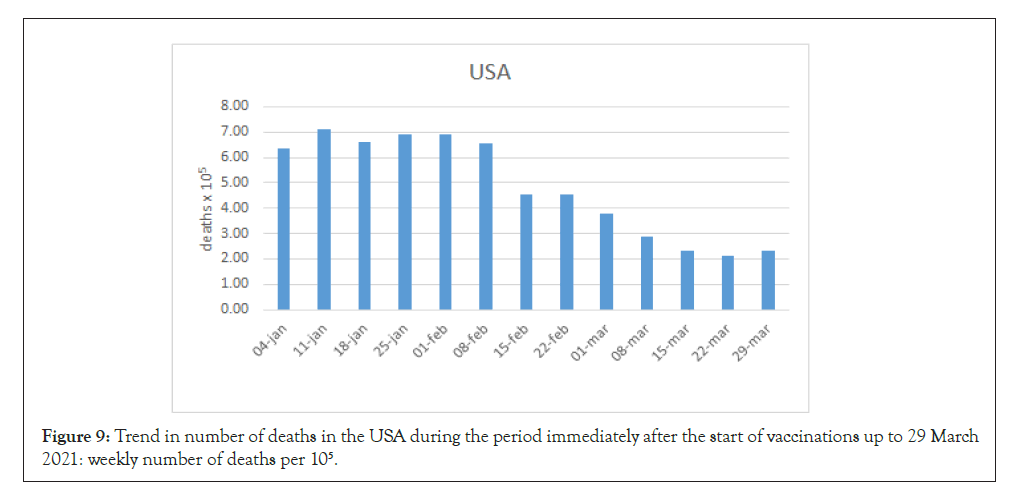
Figure 9: Trend in number of deaths in the USA during the period immediately after the start of vaccinations up to 29 March 2021: weekly number of deaths per 105
A clear decrease in the number of deaths was seen in all these countries. In the USA, values stabilized or slightly increased after the initial decrease. This may be due to a loosening of the lockdown restrictions in some parts of the country causing the viral spread to increase again.
Countries without any vaccine coverage
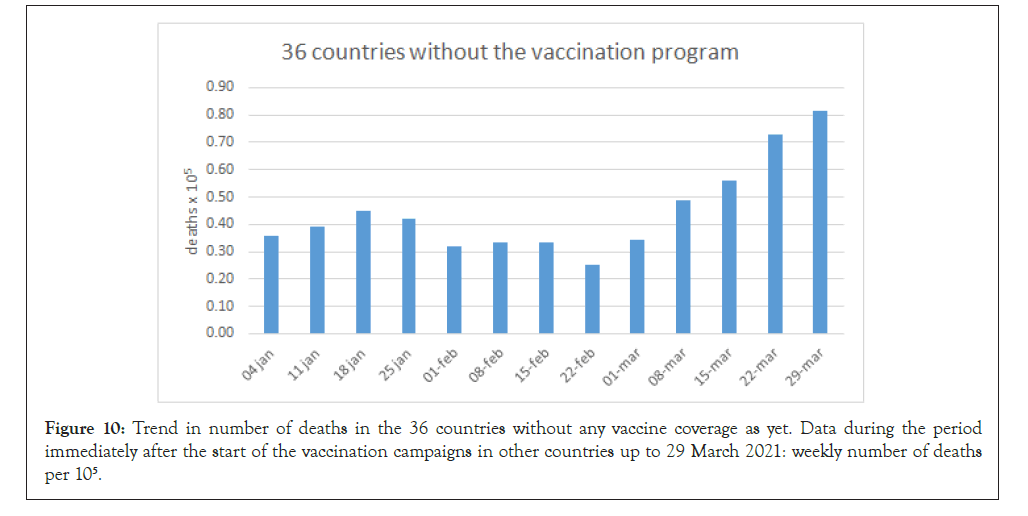
On 30 March, thirty-six countries were not using vaccines. The reasons are unknown and figure shows the trend in all of these countries taken together (Figure 10).
Figure 10: Trend in number of deaths in the 36 countries without any vaccine coverage as yet. Data during the period immediately after the start of the vaccination campaigns in other countries up to 29 March 2021: weekly number of deaths per 105.
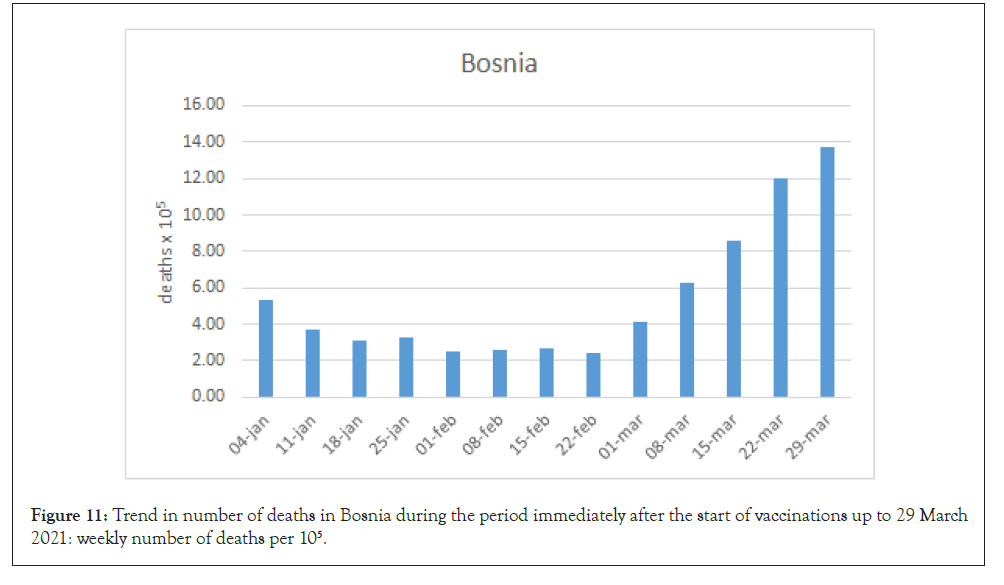
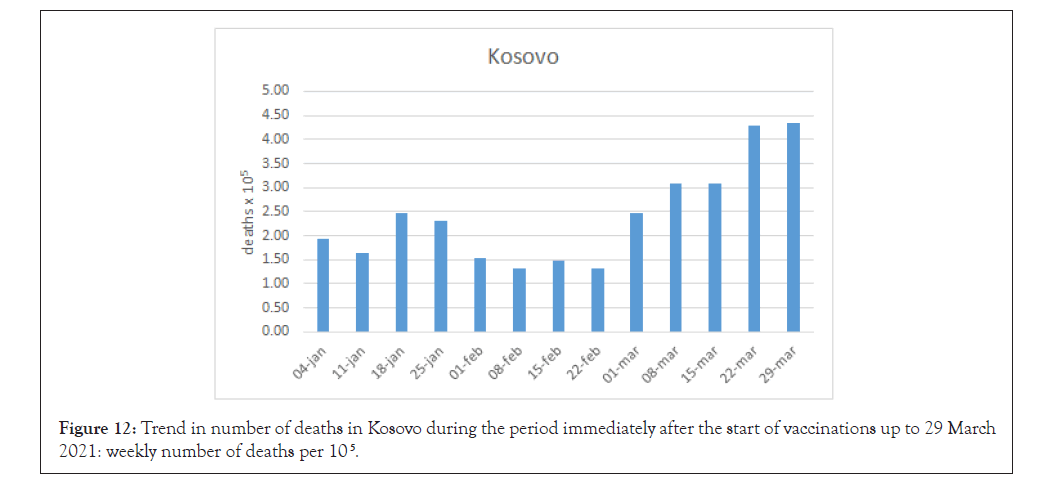
Tables 3-5 list the 36 countries. Seven of these countries, Bosnia, Kosovo, Botswana, Armenia Libya, Comoros and Zambia accounted for over 85% of the deaths in the period (Figures 7-12).
The other countries had totals amounting to less than 5 per 105 deaths. The LEEDELS data for these 36 countries were compared to those of the other countries (139) to determine any differences (Table 5).
| Variable | Unit | 36 countries with no vaccine | 140 countries with vaccine | P a |
|---|---|---|---|---|
| Life expectancy | Years | 67.9 ± 6.15 | 75.1 ± 11.23 | <0.05 |
| >65 years per 103 | N | 690.1 ± 901.95 | 3812.5 ± 9865.80 | <0.05 |
| 65 years/others | ratio | 9.8 ± 6.15 | 22.9 ± 55.78 | <0.05 |
| >65 years | % | 4.6 ± 3.30 | 10.0 ± 6.82 | <0.05 |
| Population Density | inhabitants/Km2 | 82.6 ± 108.12 | 204.7 ± 510.54 | <0.05 |
| Urban population | % of inhabitants | 44.8 ± 19.19 | 61.6 ± 22.87 | <0.05 |
| GDP | USD/inhabitant | 4624 ± 11769.8 | 18545 ±25896.7 | <0.05 |
| Education | % GDP | 4.3 ± 2.53 | 4.6 ± 1.88 | <0.05 |
| Hospital beds | N/103 inhabitants | 2.1 ± 1.70 | 3.1 ± 2.49 | <0.05 |
| PM 2.5-10.0 | mg/m3 | 50.7 ± 42.69 | 34.9 ± 39.90 | <0.05 |
| Cars | N/103 inhabitants | 54.4 ± 84.95 | 231.3 ± 227.44 | <0.05 |
| Mobile phones | N/103 inhabitants | 773.7 ± 341.95 | 1134.7 ± 311.57 | <0.05 |
| Internet | Connections/103 inhabitants | 253.6 ± 214.10 | 611.2 ± 285.13 | <0.05 |
| Forests | Percentage of land | 27.7 ± 23.65 | 32.0 ± 22.15 | >0.05 |
a: Mann–Whitney U test p values
Table 5: Comparison between the LEEDELS data for the 36 countries without vaccine programmes and the 140 countries carrying out a vaccination campaign.
Figure 11: Trend in number of deaths in Bosnia during the period immediately after the start of vaccinations up to 29 March 2021: weekly number of deaths per 105.
Figure 12: Trend in number of deaths in Kosovo during the period immediately after the start of vaccinations up to 29 March 2021: weekly number of deaths per 105.
The differences are significant for all variables, apart from the percentage of land covered by forests. The correlations between the LEEDELS data and COVID-19 death rates were calculated for the two sets of countries and the results are shown (Table 6).
| Variable | Unit | 36 countries without vaccination Spearman's ? | p | 140 countries with vaccination Spearman's ? | p |
|---|---|---|---|---|---|
| Life expectancy | Years | 0.2898 | >0.05 | 0.4691 | <0.05 |
| > 65 years x 103 | ratio | -0.1447 | >0.05 | 0.0741 | >0.05 |
| 65 years/others | % | 0.5289 | <0.05 | 0.0742 | >0.05 |
| > 65 years | inhabitants/Km2 | 0.1568 | >0.05 | 0.4698 | <0.05 |
| Density | inhabitants/Km2 | 0.0387 | >0.05 | -0.0867 | >0.05 |
| Urban population | % of inhabitants | 0.2034 | >0.05 | 0.3562 | <0.05 |
| GP total | USD/inhabitant | 0.0071 | >0.05 | 0.2646 | <0 .05 |
| Education | % total GDP | -0.1142 | >0.05 | 0.0608 | >0.05 |
| Hospital beds | N/103 inhabitants | 0.2258 | >0.05 | 0.2082 | <0.05 |
| PM 2.5-10.0 | mg/m3 | 0.1049 | >0.05 | -0.2427 | <0.05 |
| Cars | N/103 inhabitants | 0.3766 | <0.05 | 0.5093 | <0.05 |
| Mobile phones | N/103 inhabitants | 0.1280 | >0.05 | 0.0646 | >0.05 |
| Internet | Connections/103 inhabitants | 0.4129 | <0.05 | 0.4027 | <0.05 |
| Forest | Percentage of land | -0.1112 | >0.05 | 0.0502 | >0.05 |
Table 6: Correlation between LEEDELS data and COVID-19 death rates up to 28 December 2020 in countries with and without vaccination programmes.
The pattern of correlations with number of COVID-19 deaths is different in the two sets of countries. The only identical positive correlations regard cars and internet connections, which can be considered as indicators of general economic prosperity.
GDP, which is the most important wealth index, is positively correlated only in the countries which are implementing vaccine programmes. This may mean that only the countries with the most resources are able to procure vaccines, which are initially insufficient to cover the entire world demand.
We should underline one further aspect: the relationship between age and COVID-19. In the 36 countries with no vaccine programme, old age (represented by the 65 years/other variable, known as the elderly people “dependence”) is positively correlated with COVID-19 deaths, meaning that these countries are not good places to be old in. However, the number of deaths in the old age category is more substantial in the other countries, because life expectancy is significantly higher.
Countries with vaccine coverage of under 200 per 103 inhabitants
Although the vaccination programmes started in January, a decrease was still not evident or was only temporary in most of these countries at the end of March. The data for Italy (152.52 × 10³), Poland (155.2 × 10³), and Brazil (79.91 × 10³) are given as examples (Figures 12-15 ).
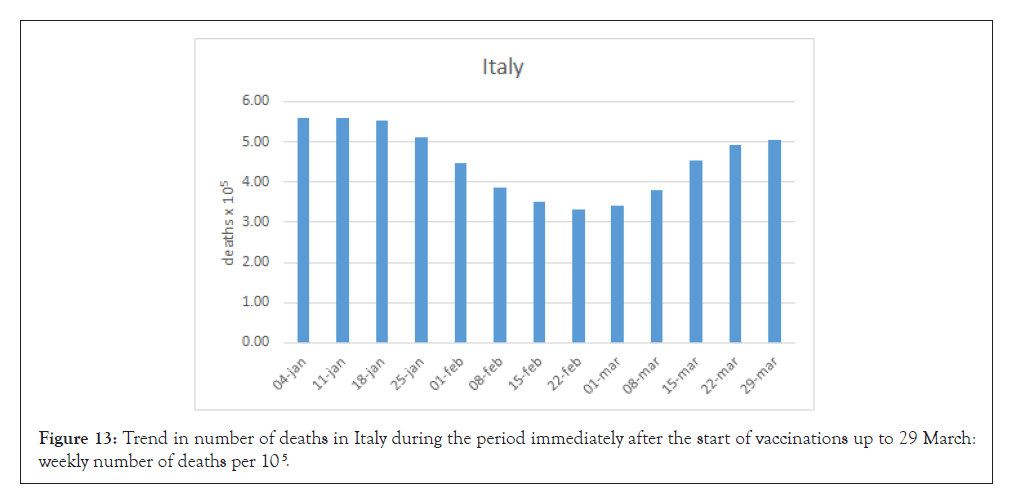
Figure 13: Trend in number of deaths in Italy during the period immediately after the start of vaccinations up to 29 March: weekly number of deaths per 105.
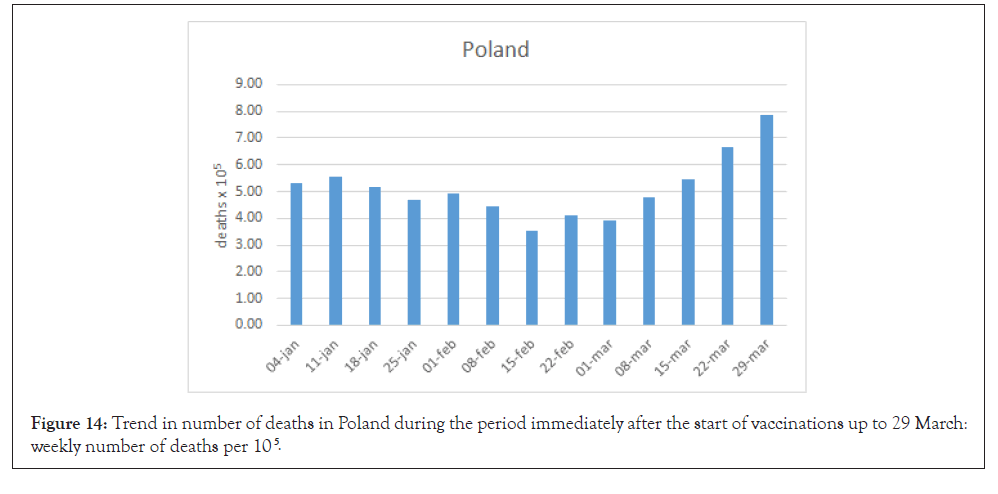
Figure 14: Trend in number of deaths in Poland during the period immediately after the start of vaccinations up to 29 March: weekly number of deaths per 105.
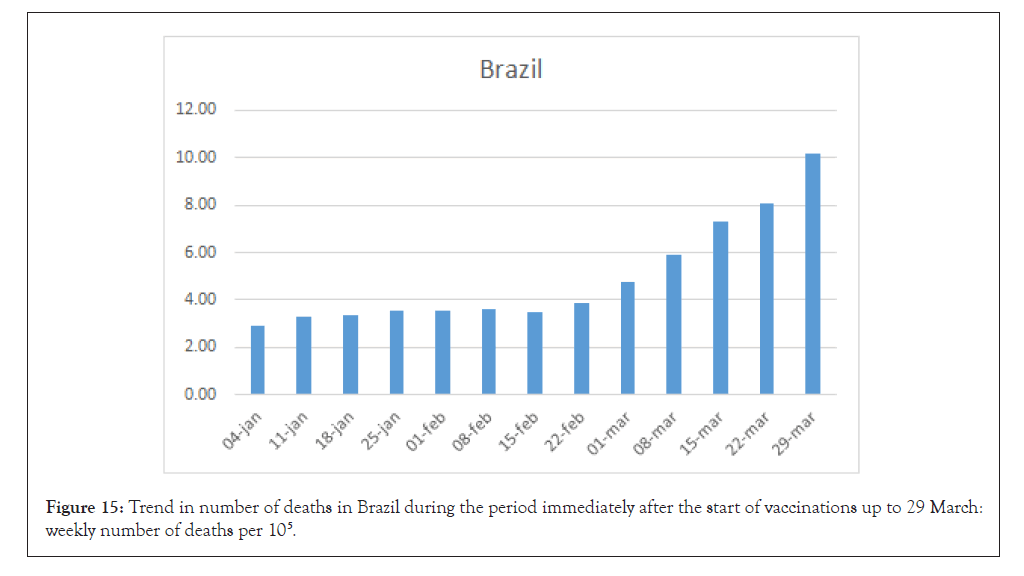
Figure 15: Trend in number of deaths in Brazil during the period immediately after the start of vaccinations up to 29 March: weekly number of deaths per 105.
The trend in these countries may be due to the limited number of shots administered and more shots are probably needed to get closer to herd immunity, which may be calculated at around 60 % of the population of a given country [16]. This means it will take several more months to cover the whole population with vaccines.
The overall picture of the relationship between vaccine and pandemia
From the data of the countries with and without the vaccine program, tentatively is possible to define a model of the viral infections once the vaccine campaign will be completed. The examples were calculated using the data of four countries with the highest vaccine coverage at March 30: Israel, Chile, UK and USA, respectively characterized by 1124, 604, 542, and 416 doses × 103 inhabitants (Figures 16-19 ). The theoretical curves were calculated simply subtracting from the real weakly values of the periods, the value of the weak immediately before the starting of the vaccination program.
In the case of Israel the real deaths in the period between December 14 2020 and April 12 2021 was 3388 : the theoretical reduction was down to 2171 (36% reduction).
In the case of Chile the real deaths in the period between December 21 2020 and April 12 2021 were 8154 : the theoretical reduction was down to 4619 (52% reduction).
In the case of UK the real deaths in the period December 8 to April 12 were 63234 : the theoretical reduction was down to 26559 (58% reduction). In the case of USA the real deaths in the period between December 14 2020 and April 12 2021 were 262177 : the theoretical death reduction was down to 175021 (33% reduction). In general, the COVID-19 infection in most of the European countries was following 5 phases: In the Phase 1 the virus starts with one (or more) outbreak/s that in a short period of time (weeks) is causing its diffusion, which is represented by the Phase 2. In few weeks the deaths reach the peak which can be stabilized in the following Phase 3 representing the most aggressive phase of the viral infection and lasting one-two weeks. The phase 4 follows represented by the decay of the deaths which can last many weeks depending upon the severity of the phase 3. The phase 5 follows in which the number of deaths is flattening at the minimum level.
The vaccination program has the following effects: a) reducing the increase of deaths, but still there is an initial increasing phase up to the stabilization in the phase; b) 3, 4 and 5 shortened up to represent one decay phase only. At the end, half of the deaths can be expected but still the figures are too high, and the non-mortal drifts seems to be the only hope. A tentative model of the virus road map is reported (Figures 15-20).
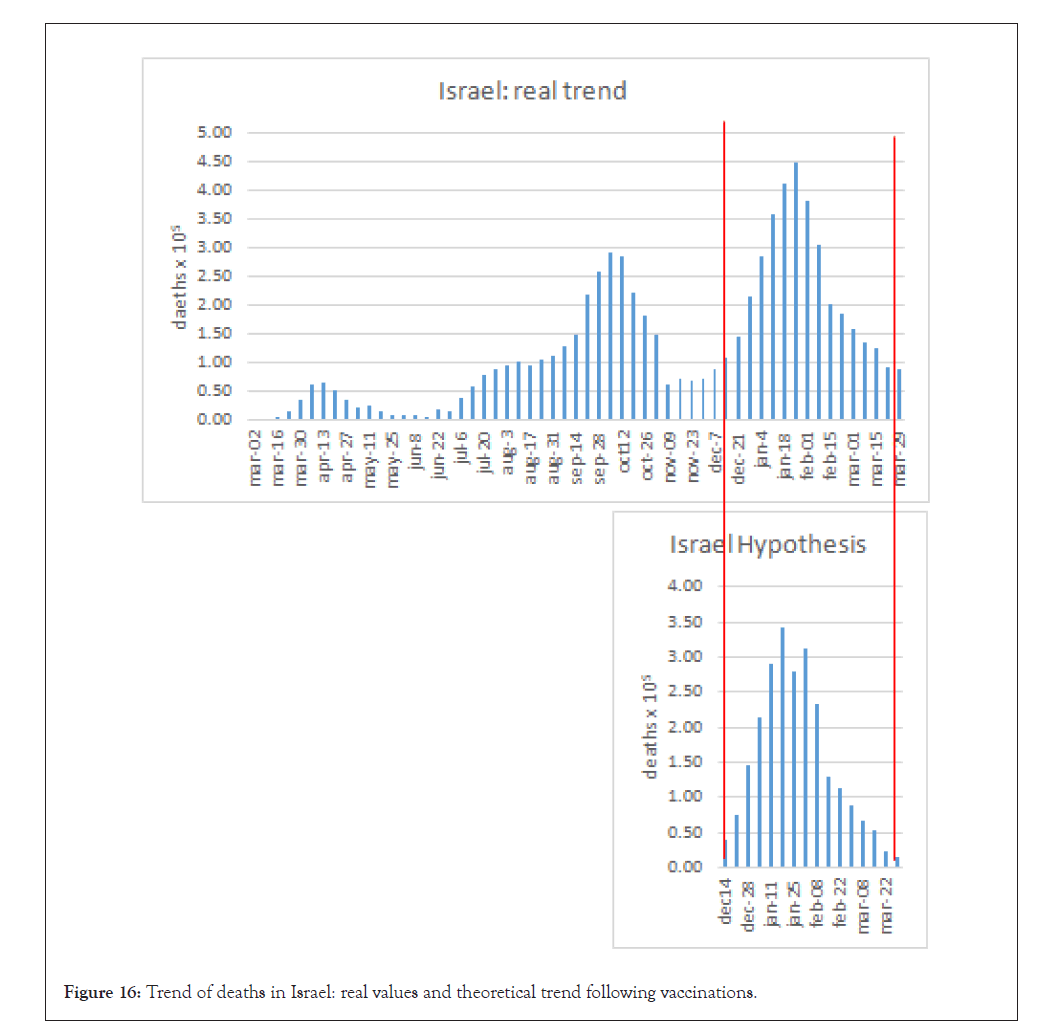
Figure 16: Trend of deaths in Israel: real values and theoretical trend following vaccinations.
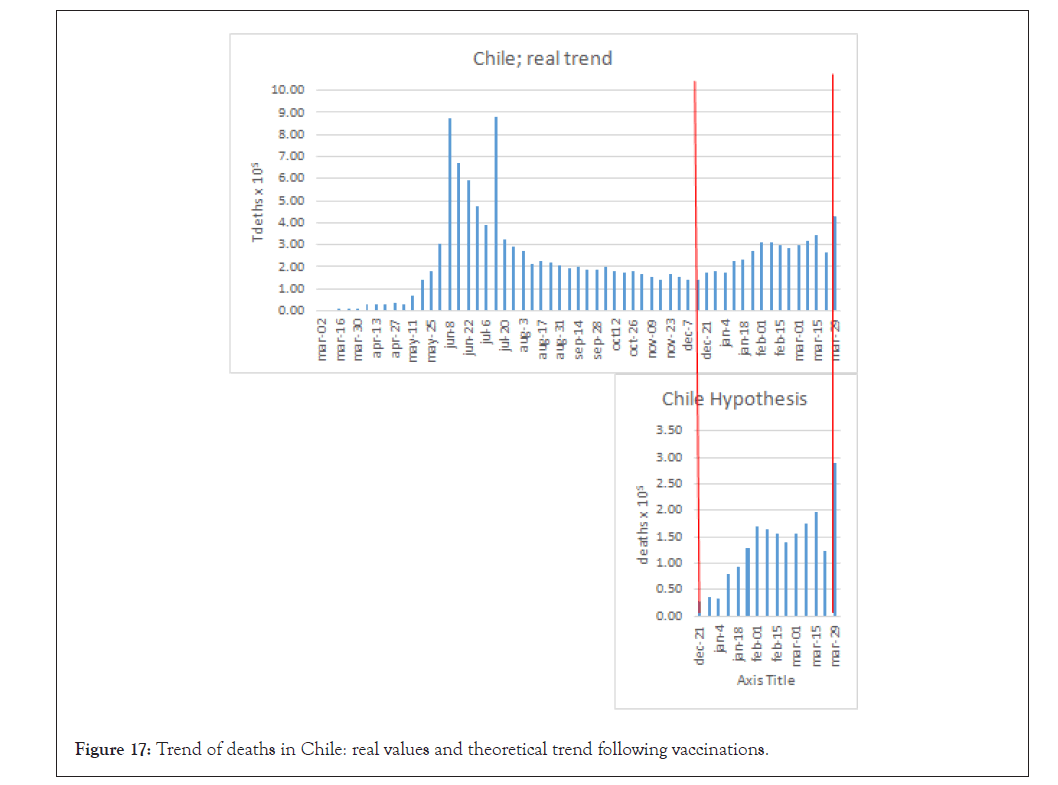
Figure 17: Trend of deaths in Chile: real values and theoretical trend following vaccinations.
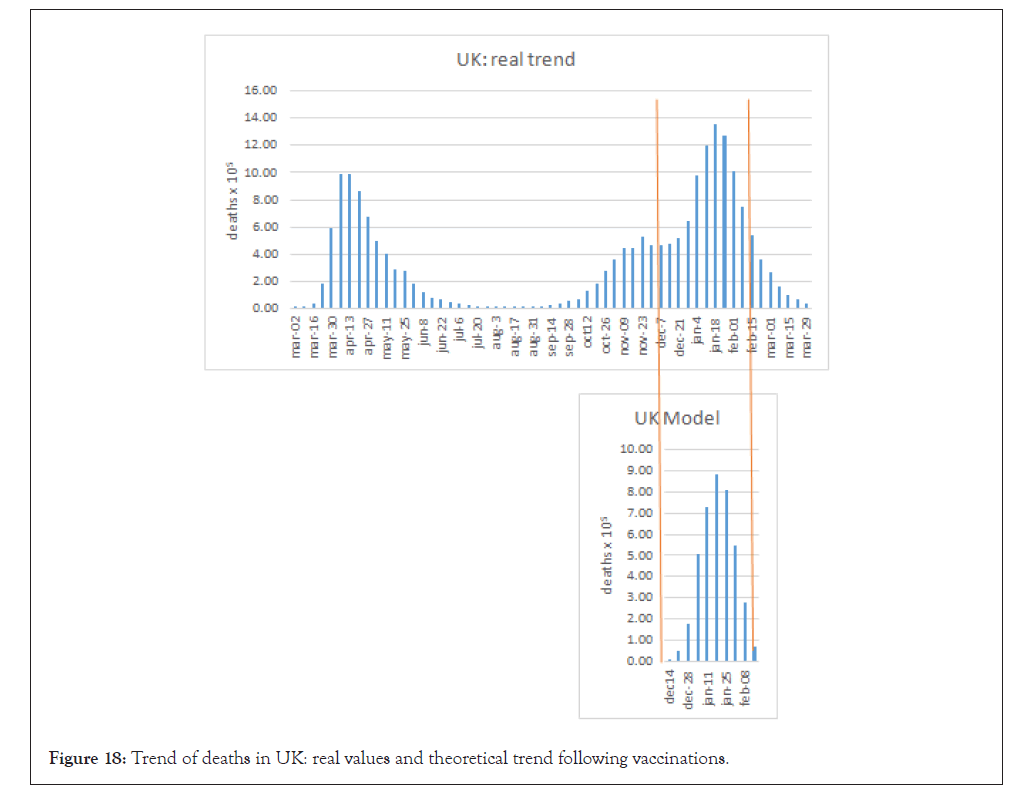
Figure 18: Trend of deaths in UK: real values and theoretical trend following vaccinations.
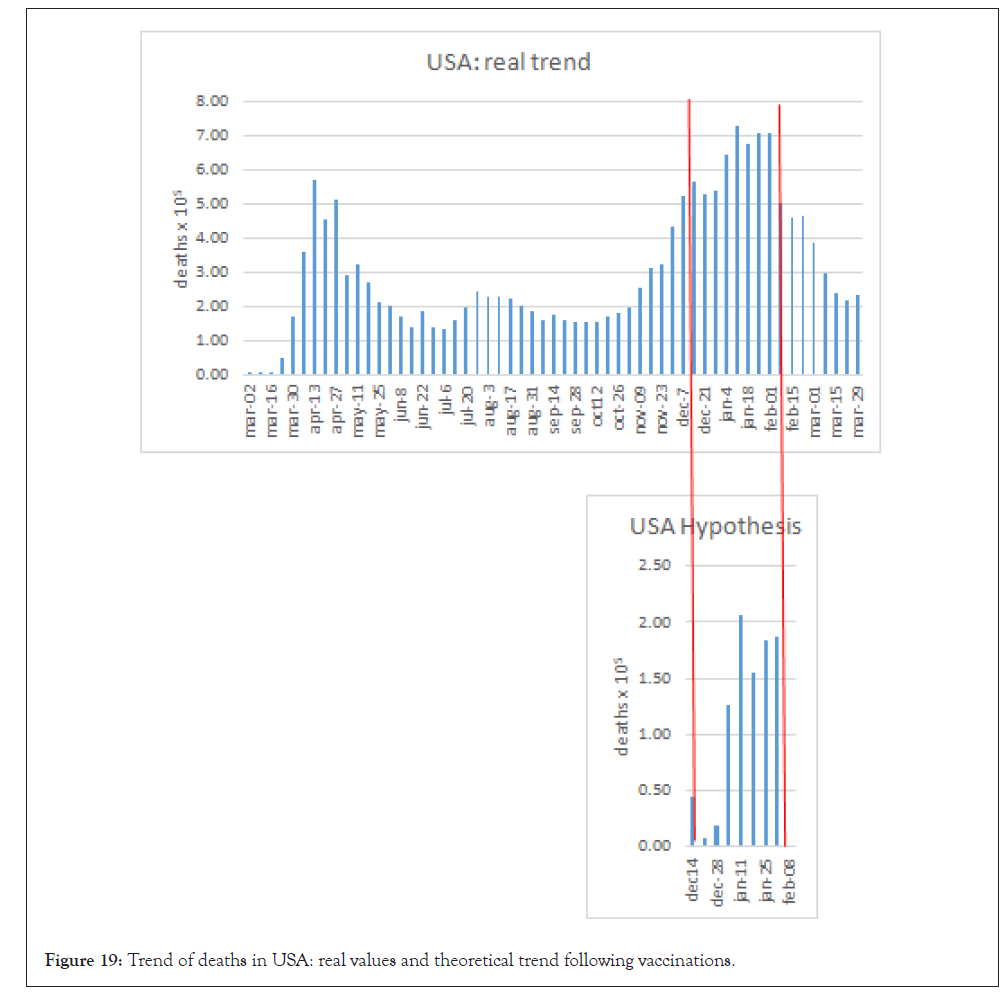
Figure 19: Trend of deaths in USA: real values and theoretical trend following vaccinations.
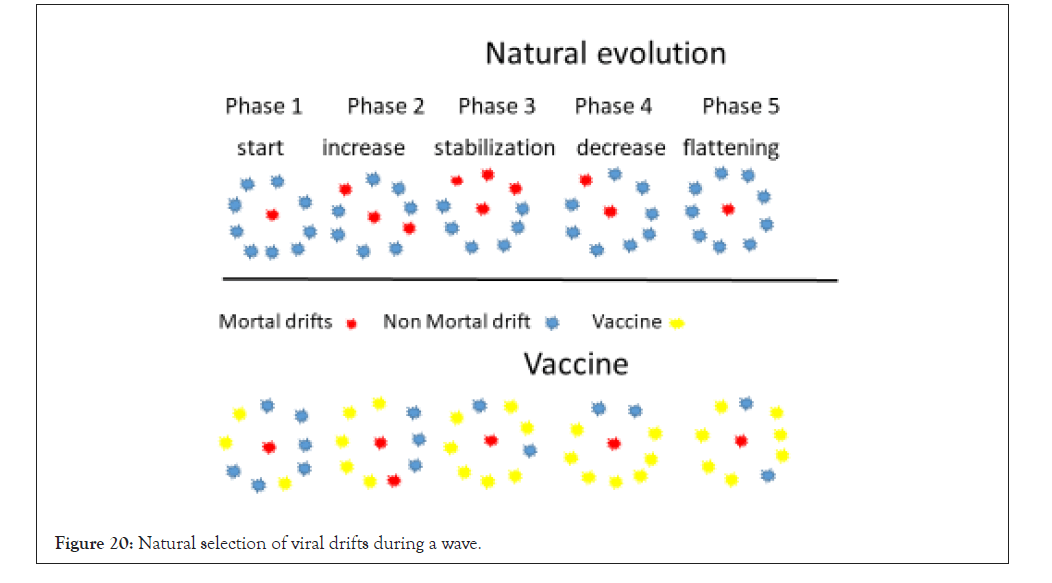
Figure 20: Natural selection of viral drifts during a wave.
Over time many outbreaks will occur and invade the environment, with the following consequences:
a) The process of viral drift is related to the number of infected cases.
b) More cases mean more drift which can initially give rise to more lethal variants, but also less lethal ones, until variants that cause infections without clinical symptoms occur.
c) However, viral transmission from the latter subjects to many other subjects can end up leading to some more lethal variants occurring again.
d) The latter cases may then again transform into less lethal variants.
e) The final result of this chain is a general trend towards a decrease in death rates, because this is the only way the virus can become part of our metaorganism.
f) The vaccines may not be effective on all variants, but they may provide some immunological defences that make the virus less lethal, thus reducing its replication and the amount of viral load in the patients that may spread it.
Discussion
Limitations of this study
The main limitation of this study is that we have considered the deaths due to COVID-19 during the first four weeks of the vaccination campaign (from the week of 4 January to the week of 28 January) with those after ten weeks of vaccination (from 2 March to 29 March). This was done considering the overall death trend in the world, which reached its highest values in the period between 8 and 28 January and lowest levels in the period between 2 and 29 March 2021 .
The vaccination programme started in the first two weeks of December in the UK, Israel and the USA only. All the other countries (136) followed, during the first two weeks of January. The number of doses administered at March 30 was about 578 million. The number of people treated was different in each country, and there were countries with a high coverage (1353.78 per 103 inhabitants) and countries with a relatively low coverage (0.01 per 103 inhabitants). The complete coverage of a country is 2000 per 103 inhabitants because all the vaccines used at present need two shots. The only vaccine that could be administered only once, Ad.COV.S, was used in USA in <3% of the people.
None of the countries were in the conditions calculated for herd immunity [16]. Therefore, theoretically we cannot expect the vaccines to have a complete effect in any of the countries. At the moment, the only way to measure the real efficacy of the current vaccines is to compare the death trends of the countries concerned following the start of the vaccination programme with those before the vaccine was in use..
Another limitation is the diagnosis of death due to or with COVID-19. The WHO indicates which countries provide suitable and approved data for number of deaths, and these are limited to 49 countries only [17]. However, the pandemic has already lasted for more than one year and the deaths due to COVID-19 were supposed to be assessed in a similar way in all countries by now. As regards deaths due to or with the virus, we can assume that the infection is at least an important concomitant cause.
It was decided to use death rates (mortality) instead of the number of positive swabs (morbidity) owing to the possibility of bias, which was considered lower in the case of death rates. The total number of positive swabs also includes subjects who have been tested more than once and false positive/negative tests. Therefore, the risk of bias was considered much higher. Despite this, the correlation between number of positive swabs and number of deaths was seen to be extremely high [18].
The overall picture
The virus originated in China in 2019 and, unfortunately, due to globalization it spread around the world more or less like a commercial product. Many waves of COVID-19 have been recorded in the world since its appearance and it has caused a total of about 3 million deaths. The hope is that vaccinations will generate a suitable barrier against its spread.
Although 550 million shots of vaccine have been administered in the world (up to 30 March), it is evident from Figure 1 that the death rate is tending to grow again after an initial decrease. This means that vaccines alone may not be sufficient to stop deaths. Although herd immunity had not been reached in any country up to 30 March, the fact the death rate has started to grow again suggests that something else is needed to control this pandemic.
Furthermore, it is very hard to justify the number of deaths that will occur up to the moment when herd immunity is reached. Is the time needed to reach herd immunity an unavoidable price to pay or is it an excuse to cover up serious shortcomings in health planning? The presence of different waves in the period between 2019 and 2021 is typical of many pandemics, and this goes towards answering the important question above.
We should remember that the mortality rate was kept under proper control in most European countries during August 2020, when it dropped to a few deaths/week/country. This result was achieved without any vaccination campaign, and the following dramatic growth was due to the virus returning from countries such as the USA, Brazil, India, and Russia (which cannot be considered a European country), which were not capable of controlling the death rate during that same period. China, where the pandemic originated, also apparently flattened its death curve to almost zero without any vaccine. The conclusion is that COVID-19 can also be controlled without vaccines, albeit at extremely high social and economic cost, and this was only not successful because of general health policy incompetence.
Vaccine yes or no
Comparison of the current data regarding countries with and without vaccination campaigns comes out clearly in favour of vaccines because the growth in number of deaths in countries not implementing a vaccination programme is dramatic (see Figure 1 and Figures 6-8). However, in Europe during the summer 2020 the deaths rate was very low and the disease was considered under control without the use of any vaccine.
At the present time, w hile the world death rate (considering all 139 countries) is going down or fluctuating, it is quite definitely growing in the 36 countries without vaccination programmes. However, no correlation between number of deaths and shots of vaccine can currently be found. This may be due to differences between countries since the number of deaths is decreasing in 60% of them, while it is increasing in the remaining 40%. Furthermore, it may be necessary to get close to herd immunity, as is happening in the UK, the USA and Israel.
Looking at the current data, these three countries have almost flattened their death rate curves. This started between 6 to 8 weeks after their vaccination programmes began, without any further rises. This trend has not been seen in countries such as Brazil, Poland and Italy, where there is an evident increase in the death rate eight weeks after the start of their vaccination programmes (Figures 13-15)
This may be due to the belief that, once vaccination has started, it is possible to go back to normal life, which is not true at all (see later). Vaccination does not mean the end of the possibility of an outbreak, even though it is understandable that people are frustrated with the nuisance of alternating periods of lockdown.
Even when a country reaches herd immunity, reinfection is still possible due to the nature of this virus, which is most probably already part of our metaorganism. This means that every year will be the same, like for seasonal influenza, and the vaccination programme will continue until true viral disappearance occurs.
This is what we hope will happen if a non-lethal variant becomes prevalent as it did for the Spanish flu [19,20]. Furthermore, more effort should be made to find a treatment for the disease, perhaps with monoclonal antibodies, antiviral drugs, or a simple spray to prevent viral infection [21,22].
The question of adverse reactions to vaccines, such as thromboses and other lethal events, is the subject of many debates and definitely comes down to their risk/benefit ratio, which is generally extremely high with effective vaccines. However, adverse reactions to a drug attract far more attention from the general public, than its efficacy. This debate is becoming a political issue.
Not just vaccines
Besides the deaths, the other dramatic aspect of COVID-19 is the political situation, which can be summarized in a few words: bad information and bad organization.
The information provided has been extremely uncoordinated and the actions taken have been different and somewhat contradictory in every country. This was understandable during the first COVID-19 wave, when the virus was new. However, even after the decrease in death rate in most of Europe during August 2020, the virus was still found and was very aggressive in big countries such as the USA, Brazil, India and Russia.
None of the European governments took this aspect seriously and nothing was done to prevent the possible return of outbreaks. By nature, viruses circulate freely, particularly in these globalized times. This means that:
a) Disinfection should have been implemented meticulously, particularly in places where people often gather.
b) Border controls should have been carried out in the country of origin and country of arrival to isolate positive cases. These controls would not have been highly detrimental to travel.
c) Hygiene should have been promoted through all media channels, considering that the virus does not only reside in saliva but can be found in all secretions.
d) Chronic treatment among the elderly should have been checked by family doctors, and the patients should have been informed that appropriate chronic treatment can ward off death from the virus [23]. Instead, the information that was perceived was that elderly people with chronic diseases were condemned to death [24-26]
e) The experts (e.g. virologists, immunologists and epidemiologists, including those in charge of Scientific Committees) which appeared on TV shows and wrote in the newspapers should have been “peer reviewed” for their specific expertise, as happens for all scientific audiences.
The organization started to show its faults during the vaccine preparation stage. Countries producing vaccines were not allowed to distribute them in the countries of origin since contracts with the big pharmaceutical companies were required as a precondition to obtaining the shots to cover needs. Production levels were lower than agreed and this led to fighting among countries. Some countries produced vaccines but the product was not available until the local regulatory authority approved it. In some cases, some regions of some countries were able to buy and administer vaccines even without local authority approval.
The picture that emerged was a sort of purgatory where everybody was fighting someone else. But the virus did not care about this fighting and carried on undaunted. The second incredibly weak point was the decision over who should administer the vaccine. Leaving aside the fact some vaccines need to be stored at -80̊C, an injection that most people can do by them was allowed to become a bottleneck. There are still arguments over who can administer the vaccine: whether you need a medical doctor, nurse, veterinary surgeon, dentist or pharmacist. Very often a lot of time is lost to comply with bureaucratic requirements.
LEEDELS data
The reason why some countries have not started a vaccination programme is beyond the scope of this research. However, analysis of the LEEDELS data makes it evident that these countries are among the poorest. The obvious consequence is that rich countries will prevail in the competition taking place to obtain vaccines. This means that the virus will be kept viable in poor countries for the next few years.
Analysis of the relationship between the COVID-19 mortality rate and LEEDELS data clearly shows that the disease is more frequent in rich countries, where exchanges due to business and gatherings are the mainframe of society. This is also evident from the positive correlation between urban density and number of deaths.
If the same analysis is carried out in countries where only some vaccination is occurring (without a clear vaccination programme), it is clear that many of them are poor countries, and since “money talks”, once the people living there are attacked by the virus, they have difficulty reacting and have to queue up to get vaccines.
The situation in Europe is also pretty much the same: the second wave was much more severe in the poorer countries, mainly located in Eastern Europe [27].
It is not hard to calculate the cost of the vaccination programmes. Considering a price of between 2 and 19 €/shot, the final amount numbers into the billions. Moreover, it is hard to understand why there is such a big difference in the cost of the various vaccines. In any case, it is very big business for the pharmaceutical industry.
Conclusion
Vaccination is one of the tools we can use against COVID-19, but it does not currently seem to be sufficient to counteract the mortality rates in many countries on its own. Herd immunity, which it is said is necessary in order to stop deaths due to the virus, is more of a hope than a fact at the moment.
Uncontrolled outbreaks can be seen in many countries and indicate that vaccination has to be accompanied by many other measures, such as disinfection of the places where people gather, hygiene (particularly of the oral cavity), and awareness that the virus is found in all secretions/excretions.
Currently, the evidence that vaccination against COVID-19 can prevent the virus from spreading is more of a hope than a scientific truth. So far only countries close to herd immunity seem to have flattened their death rate curves, while many other countries are still seeing an evident increase, even though their vaccination programmes started over three months ago. The belief that after vaccination everybody will be able to move freely is totally wrong, and proper information should be provided, along with an appropriate health policy.
The problem of health policies has made the limited ability of most governments to tackle the disease very evident. The simplest available tools were forgotten, and-in the end-vaccination became the only reference measure to cover up serious faults. The same inefficiency was seen in the lack of a common strategy for vaccine production, distribution and administration. The world will probably be threatened by this virus every year, and that threat will be particularly severe for the poorest countries until a non-lethal variant becomes predominant.
Funding
This research received no financial support.
Author's Contributions
UC conceived the trial; GB and UC retrieved all the data; MR carried out the statistical evaluation; UC wrote the text.
Conflict of Interest
There are no conflicts of interest.
Ethical Statement
This manuscript is original, has not been published before, and is not being considered for publication elsewhere. All the authors mentioned in this manuscript have agreed on its authorship, read and approved it, and given their consent for its submission and subsequent publication.
REFERENCES
- Worldwide Dashboard. World Health Organization. 2020.
- Geographical Atlas De Agostini 2020 Deluxe Edition. DeA Planeta Libri. 2020.
- Central Intelligence Agency. The CIA world factbook 2020-2021. Skyhorse Publishing, New York, USA, 2020.
- Life expectancy in the World Population. Worlddometer. 2021.
- Jackson LA, Anderson EJ, Rouphae NG, Roberts PC, Makhene M, Coler RN, et al. An mRNA Vaccine against SARS-CoV-2—Preliminary Report. N Engl J Med. 2020;383(1):1920-1931.
- Polack FP, Thomas SJ, Kitchin N, Absalon J, Gurtman A, Lockhart S, et al. Development of a remote online collaborative medical school pathology curriculum with clinical correlations. N Engl J Med. 2020;383(1):2603-2615.
- Voysey M, Clemens SAC, Madhi SA, Weckx LY, Folegatti PM, Aley PK, et al. Safety and efficacy of the ChAdOx1 nCoV-19 vaccine (AZD1222) against SARS-CoV-2: an interim analysis of four randomised controlled trials in Brazil, South Africa, and the UK. Lancet. 2021;397(10269):99-111.
- Logunov DY, Dolzhikova IV, Shcheblyakov DV, Tukhvatulin AI, Zubkova OV, Dzharullaeva AS, et al. Safety and efficacy of an rAd26 and rAd5 vector-based heterologous prime-boost COVID-19 vaccine: an interim analysis of a randomised controlled phase 3 trial in Russia. Lancet. 2021;397(10275):671-681.
- China Bio-Beijing Company’s new coronavirus inactivated vaccine phase III. Sinopharm. 2020.
- A Second Chinese Coronavirus Vaccine Is Said to Be Effective. The New York Times. 2021.
- Johnson & Johnson announces single-shot janssen COVID-19 vaccine candidate met primary endpoints in interim analysis of its phase 3 ENSEMBLE trial. Janssen. 2021.
- CanSinoBIO announces approval for its single-dose COVID-19 vaccine in China. CanSinoBIO. 2021.
- Bharat Biotech announces phase 3 results of COVAXIN®: India’s first covid-19 vaccine demonstrates interim clinical efficacy of 81%. Bharat Biotech. 2021.
- Da Sois J. Sputnik V, Epivaccorona, Kovivak: What do we know about the three Russian Vaccines?. CNews. 2021.
- Novavax COVID-19 vaccine demonstrates 89.3% efficacy in UK phase 3 trial. Novavax. 2021.
- Aguas R, Corder RM, King JG, Gonçalves G, Ferreira MU, Gomes MGM. Herd immunity thresholds for SARS-CoV-2 estimated from unfolding epidemics. BMJ. 2020;27(2):371-418.
- Global health estimated world health organization. World Health Organization. 2018.
- Cornelli U, Belcaro G, Cesarone MR, Recchia M, Cotellese R. The COVID-19 history in Italy: Correlations with environmental, demographic variables and chronic diseases therapy. J Med Case Rep. 2020;4(1):1-13.
- Taubenberger JK, Morens DM. 1918 Influenza: the mother of all pandemics. Emerg Infect Dis. 2006;12(1):15-22.
- Akin L, Gözel MG. Understanding dynamics of pandemics. Turk J Med Sci. 202;50(SI-1):515-519.
- Meyers C, Robison R, Milici J, Alam S, Quillen D, Goldenberg D, et al. Lowering the transmission and spread of human coronavirus. J Med Virol. 2021;93(3):1605-1612.
- Belcaro G, Cornelli U, Cesarone MR, Feragalli B, Bombardelli E, Dugall M, et al. Seven immediate, low-cost management strategies for Covid. Exploiting viral Thermolabity: Possible, immediate solutions. Biomed J Sci & Tech Res. 2020;27(3):20801-20808.
- Cornelli U, Belcaro G, Cesarone MR, Recchia M, Cotellese R. Covid-19 Aging and Chronic diseases. J Micribiol Infect Dis. 2020;4(6):1-6.
- Petrilli CM, Jones SA, Yang J, Rajagopalan H, O'Donnell L, Chernyak Y, et al. Factors associated with hospital admission and critical illness among 5279 people with coronavirus disease 2019 in New York City: prospective cohort study. BMJ. 2020;369(1):m1966.
- Williamson EJ, Walker AJ, Bhaskaran K, Bacon S, Bates C, Morton CE, et al. Factors associated with COVID-19-related death using OpenSAFELY. Nature. 2020;584(7821):430-436.
- O’Hearn M, Liu J, Cudhea F, Micha R, Mozaffarian D. Coronavirus disease 2019 hospitalizations attributable to cardiometabolic conditions in the United States: A comparative risk assessment analysis. J Am Heart Assoc. 2021;10(1):e019259.
- Cornelli U, Belcaro G, Recchia M. The many waves of Covid -19 in Europe. LAP Lambert Academic publishing-Mauritius. 2021.
Citation: Cornelli U, Belcaro G, Recchia M (2021) COVID-19 Vaccination: Hopes and Facts to Cover Incompetence. J Bacteriol Parasitol. 12: 401.
Copyright: © 2021 Cornelli U, et al. This is an open-access article distributed under the terms of the Creative Commons Attribution License, which permits unrestricted use, distribution, and reproduction in any medium, provided the original author and source are credited.


