Indexed In
- Academic Journals Database
- Open J Gate
- Genamics JournalSeek
- JournalTOCs
- ResearchBible
- Ulrich's Periodicals Directory
- Electronic Journals Library
- RefSeek
- Hamdard University
- EBSCO A-Z
- OCLC- WorldCat
- Scholarsteer
- SWB online catalog
- Virtual Library of Biology (vifabio)
- Publons
- MIAR
- Geneva Foundation for Medical Education and Research
- Euro Pub
- Google Scholar
Useful Links
Share This Page
Journal Flyer

Open Access Journals
- Agri and Aquaculture
- Biochemistry
- Bioinformatics & Systems Biology
- Business & Management
- Chemistry
- Clinical Sciences
- Engineering
- Food & Nutrition
- General Science
- Genetics & Molecular Biology
- Immunology & Microbiology
- Medical Sciences
- Neuroscience & Psychology
- Nursing & Health Care
- Pharmaceutical Sciences
Research Article - (2022) Volume 13, Issue 2
COVID-19 Space-Time Cluster Detection in Ethiopia Using Retrospective Analysis
Kaleab Tesfaye Tegegne1*, Eleni Tesfaye Tegegne2, Mekibib Kassa Tessema3, Geleta Abera1, Berhanu Bifato1, Kebebush Gebremichael1, Abiyu Ayalew Assefa1, Andualem Zenebe1, Wosenyeleh Semeon Bagajjo4, Musie Rike5, Belayneh Feleke Weldeyes6, Alelign Tadele Abebe7 and Argaw Getachew Alemu82College of Medicine and Health Science, School of Nursing, University of Gondar, Gondar, Ethiopia
3Leishmania Research and Treatment Centre, University of Gondar, Gondar, Ethiopia
4Hawassa College of Health Science, Hawassa, Ethiopia
5Research and Publication Directorate, Hawassa College of Health Science, Hawassa, Ethiopia
6Department of Mid Wifery, Hawassa College of Health Science, Hawassa, Ethiopia
7Department of Medical Laboratory Technology, Hawassa College of Health Science, Hawassa, Ethiopia
8Tenta Gashena Road Project Co-Ordinator, Hawassa, Ethiopia
Received: 20-Jan-2022, Manuscript No. JDMGP-22-15489; Editor assigned: 24-Jan-2022, Pre QC No. JDMGP-22-15489 (PQ); Reviewed: 07-Feb-2022, QC No. JDMGP-22-15489; Revised: 10-Feb-2022, Manuscript No. JDMGP-22-15489 (R); Published: 17-Feb-2022, DOI: 10.4172/2153-0602.22.13.250
Abstract
Background: As of the 31st of January 2021, there had been 102,399,513 confirmed cases of COVID-19 worldwide, with 2,217,005 deaths reported to WHO. The goal of this study is to uncover the spatiotemporal patterns ofCOVID- 19in Ethiopia, which will aid in the planning and implementation of essential preventative measures.
Methods: We obtained data onCOVID-19cases reported in Ethiopia from November 23 to December 29, 2021, from an Ethiopian health data website that is open to the public. Kulldorff’s retrospective space-time scan statistics were utilized to detect the temporal, geographical, and spatiotemporal clusters ofCOVID-19at the county level in Ethiopia, using the discrete Poisson probability model.
Results: In Ethiopia, between November 23 and December 29, 2021, a total of 22,199COVID-19cases were reported.
TheCOVID-19cases in Ethiopia were strongly clustered in spatial, temporal, and spatiotemporal distribution, according to the results of Kulldorff’s scan statistics. The most likely Spatio-temporal cluster (LLR=70369.783209, RR=412.48, P 0.001) was mostly concentrated in Addis Ababa and clustered between 2021/11/1 and 2021/11/30.
Conclusion: From November 23 to December 29, 2021, this study found three large COVID-19 space-time clusters in Ethiopia, which could aid in future resource allocation in high-risk locations for COVID-19 management and prevention.
Keywords
COVID-19; SaTScan; Space-time clustering
Introduction
AAs of the 31st of January 2021, there had been 102,399,513 confirmed cases of COVID-19 worldwide, with 2,217,005 deaths reported to WHO [1].Geographic Information Systems (GIS) and scan statistics are increasingly being used to evaluate and detect geographical and spatiotemporal changes and clustering of diseases, resulting in more information in terms of disease dispersion [2] COVID-19 has been found to cluster spatially and spatiotemporally in several investigations [3-13]. The Geographic Information System (GIS) is a useful tool for displaying and evaluating geographic features based on epidemiology data [14,15].
By giving scientific knowledge, establishing spatial relationships with other parameters, and identifying transmission patterns and clustering, GIS can be utilized in conjunction with spatial statistics to help limit the epidemic [16-19]. COVID-19 reports from Ethiopia suggest regional differences in trends and case notification rates, while it’s unclear if these variations are caused by the disease’s geographical and spatiotemporal pattern [20]. As a result, regardless of the illness burden in the community, the nationalCOVID-19program executes comparable Interventions have been inconsistent across places, which could be due to a lack of understanding of the disease’s distribution pattern in several circumstances. Furthermore, except for a single paper describing a geographic study of vulnerability to infection, case severity, and death, information concerning the disease’s spatial distribution is scarce [21].
Understanding the disease’s geographical pattern and spatiotemporal fluctuations across larger geographic settings, such as urban-rural areas, could aid policy and decision-making in resource-constrained situations like Ethiopia. As a result, we want to investigate the disease’s spatiotemporal clustering in Ethiopia over the last month.
Methodology
Study area and setting
• Ethiopia’s GPS coordinates are 9.1450° N and 40.4897° E.
• Ethiopia is the 26th largest country in terms of physical size, with a total area of 426,400 square miles.
• The country has a length of 1,018 miles and a width of 980 miles.
• Ethiopia has a land area of 90.5 percent and a sea area of 9.5 percent.
• In other terms, Ethiopia’s entire land area is 386,102 square miles and its total water area is 40,298 square miles [22]. Ethiopia’s population is over 117 million people [23].
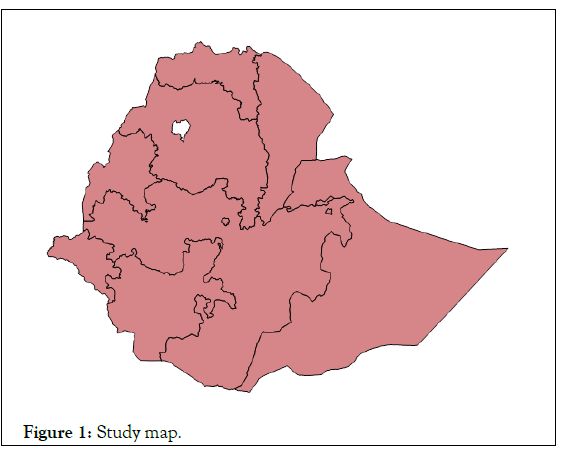
• There are eleven regional states and two chartered cities in Ethiopia: Addis Ababa, the capital, and Dire Dawa, which was chartered in 2004 (Figure 1) [24].
Figure 1: Study map.
Data collection and analysis
From November 23 through December 29, 2021, data was collected. The data came from an Ethiopian health data website that is free to the general public [20]. After importing the data into Microsoft Excel and analyzing it with SaTscan software version 10, we used ArcGIS 10.3 to illustrate the relative risk ofCOVID-19in high-risk cluster sites.
Statistical analysis
To uncover COVID-19’s temporal, geographical, and space-time clusters, as well as determine whether the geographic grouping was due to chance or not, we used Kulldorff’s space-time scan statistical analysis [25]. The scan statistics do a cluster analysis and determine cluster size and locations using Monte Carlo Simulation, as well as compute the Relative Risk (RR) and generate a P-value.
Spatial analysis
With the assumption that the number of cases at each site was Poisson distributed with a known population at risk, the discrete Poisson model, as well as the number of cases (COVID-19 instances), population, and coordinates, were used as input files. Using scan circles of various sizes, including the default value in scan statistics, the most likely spatial clusters of COVID-19 were found. The maximum spatial cluster size was calculated using an upper limit of 50% of the population at risk. The likelihood ratio was utilized to compute relative risk [26], and the most likely and secondary clusters were determined and reported when the P-value was less than 0.05. The results of the investigation were displayed in tables and on maps to illustrate where the sickness had occurred at particularly high rates.
Space-time analysis
The space-time scan statistic approach uses a cylindrical window with a circular geographic foundation that is related to space and height according to time for potential clusters [26]. COVID- 19’s RR was supposed to be the same inside the glass as it was outside. The number of occurrences in areas is poisson-distributed based on a given risk population in the poisson probability model [26]. To establish the test of significance, the likelihood ratio test was compared to a null distribution created by a Monte Carlo Simulation. The permutation count was set to 999, while the statistical significance was set at P0.05. We ran a space-time investigation for the period 2021/11/23-2021/12/29 to see if there were any recent space-time clusters of the disease.
Results
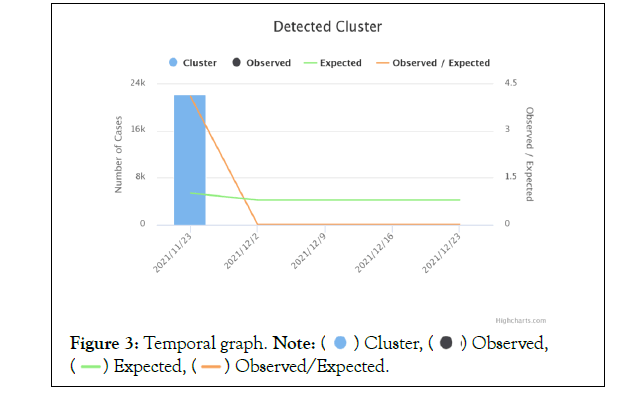
A total of 22,199 COVID-19 cases were reported from November 23 through December 29, 2021. In Ethiopia A total of eight statistically significant areas, comprising a total of 11 regions, were identified by spatial clustering analysis. Addis Ababa has the highest proportion of high-risk locations, with a relative risk of more than three. Addis Ababa. The region, 9.005401 N, 38.763611 E (LLR=56388.10451, P 0.001) was found to be the centre of the most likely cluster area (Figure 2). With a radius of 0 kilometres, this circular area exclusively covered Addis Ababa. The total number of COVID- 19cases was 19772, and the risk of COVID-19was 198.72 times (RR=198.72) higher in this location than it was elsewhere (Table 1). The temporal cluster analysis with time aggregation length of 7 days and time precision of day showed thatCOVID-19cases were low from 2021/11/23-2021/12/1 (Figure 3). The low aggregated period forCOVID-19was observed in all regions from 2021/11/23- 2021/12/1 (LLR=31382.578351, P=0.001). During this period from 2021/11/23-2021/12/1, a total of 22, 199COVID-19cases were reported, and the risk of COVID-19 was (RR=infinity) very low (Table 2).
Figure 2: Spatial clustering of COVID 19 in Ethiopia.
Figure 3: Temporal graph.

| Cluster type | Coordinates /Radius | N | Cluster regions | Observed case | Expected case | RR | LLR | P-value |
|---|---|---|---|---|---|---|---|---|
| Most likely Cluster | 9.005401 N, 38.763611 E/0 km | 1 | Addis Ababa | 19772 | 874.23 | 198.72 | 56388.1 | 0.001 |
| Secondary Cluster 1 | 6.661229 N, 43.790845 E/ 604.49 km | 5 | Somalia, Harar, Dire Dawa, Oromia, Afar | 1793 | 11095.49 | 0.088 | 9150.429 | 0.001 |
| Secondary Cluster 2 | 11.663240 N, 37.821903 E/0 km | 1 | Amhara | 366 | 5449.19 | 0.052 | 4798.102 | 0.001 |
| Secondary Cluster 3 | 6.033103 N, 36.433828 E/319.05 km | 2 | SNNPR, Gambela | 268 | 3161.17 | 0.074 | 2441.305 | 0.001 |
| Secondary Cluster 4 | 6.661229 N, 43.790845 E/0 km | 1 | Somalia | 0 | 1456.52 | 0 | 1506.498 | 0.001 |
| Secondary Cluster 5 | 14.032334 N, 38.316573 E/0 km | 1 | Tigray | 0 | 1350.48 | 0 | 1393.301 | 0.001 |
| Secondary Cluster 6 | 11.485999 N, 41.245999 E/0 km | 1 | Afar | 0 | 460.22 | 0 | 465.0574 | 0.001 |
| Secondary Cluster 7 | 10.780289 N, 35.565786 E/0 km | 1 | Benishangul Gumuz | 0 | 268.44 | 0 | 270.0756 | 0.001 |
Table 1: Spatial clustering of COVID-19 in Ethiopia from 2021/11/23-2021/12/29.
| Cluster time frame | Observed cases | Expected cases | RR | LLR | P-value |
|---|---|---|---|---|---|
| 2021/11/23-2021/12/1 | 22,199 | 5399.76 | 0 | 31382.578351 | 0.001 |
Table 2: Temporal clustering of COVID 19 cases in Ethiopia from 2021/11/23-2021/12/29.
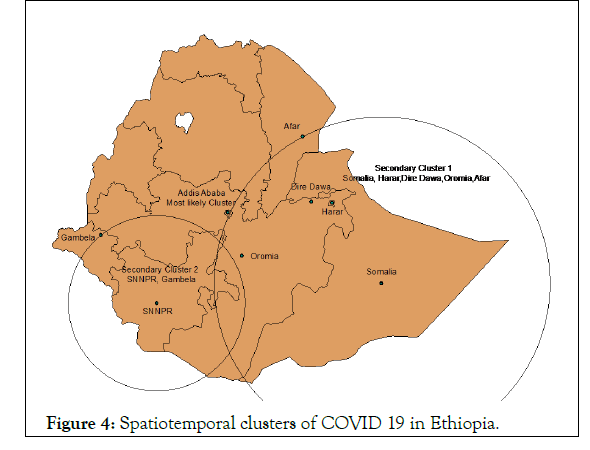
Addis Ababa was the most likely spatiotemporal cluster location, and the high-risk period was from 2021/11/1-2021/11/30 (LLR=70369.783209, P 0.001). The area’s centre was Addis Ababa, which was located at 9.005401 N and 38.763611 E, with a radius of 0 km (Figure 4). During the period 2021/11/1-2021/11/30, a total of 19772COVID-19cases were recorded in this location, with an RR of 412.48 (Table 3).
Figure 4: Spatiotemporal clusters of COVID 19 in Ethiopia.
| Cluster type | Cluster time frame | Coordinates /Radius | N | Cluster countries | Observed case | Expected case | RR | LLR | P-value |
|---|---|---|---|---|---|---|---|---|---|
| Most likely Cluster | 2021/11/1-2021/11/30 | 9.005401 N,38.763611 E /0 km | 1 | Addis Ababa | 19772 | 429.95 | 412 | 70370 | 0.001 |
| Secondary Cluster 1 | 2020/12/1-2021/12/31 | 6.661229 N,43.790845 E /604.48 km | 5 | Somalia, Harar, Dire Dawa, Oromia, Afar | 0 | 5638.7 | 0 | 6505 | 0.001 |
| Secondary Cluster 2 | 2020/12/1-2021/12/31 | 6.033103 N,36.433828 E /319.05 km | 2 | SNNPR, Gambela | 0 | 1606.5 | 0 | 1668 | 0.001 |
Table 3: Spatiotemporal clusters of COVID-19 in Ethiopia.
Discussion
Kulldorff’s scan statistical analysis was used to analyze the spatial, temporal, and spatiotemporal clusters ofCOVID-19in Ethiopia from 2021/11/23 to 2021/12/29. To our knowledge, no other study of this nature has been conducted in Ethiopia. Our research found that the distribution of COVID-19 cases in Addis Ababa was highly space-time clustered.
Addis Ababa was the epicenter of the COVID-19 outbreak. Multiple testing problems are taken into consideration in Kulldorff’s retrospective scan statistics, which is known as the most powerful method for evaluating geographical and temporal distribution utilizing routinely obtained data [27]. This approach has been used to detect disease clusters all over the world [28-31]. The results of our temporal scanning revealed that COVID-19 had a low-risk phase between November 23, 2021, and December 29, 2021. The spatiotemporal model utilized in this work examined both time and space distributions at the same time. The time-space scanning model, as opposed to the distinct spatial and temporal scanning models, produces a conclusion that is closer to the real-world situation. We discovered that COVID-19 instances were concentrated in Addis Ababa from 2021/11/23-2021/12/29 when we used this model to determine the Spatio-temporal distribution of COVID-19in Ethiopia. COVID-19 was more prevalent in Addis Ababa during this time than in other Ethiopian districts. The causes for the great magnitude of COVID-19in Addis Ababa are as follows: Addis Ababa is Ethiopia’s capital city, and it has a higher level of testing and quarantine coverage than the rest of the country. Many people, including Ethiopian long-distance vehicle drivers, traders, and others, have been traveling from Djibouti to Ethiopia via the route that connects the Amhara area, Addis Ababa, and Oromia region since the commencement of the COVID-19 pandemic, mostly owing to geographical proximity [32] SARS-CoV 2 infection is very dangerous for certain populations. Sentinel monitoring attempts to detect the early introduction and spread of COVID-19 are especially well-suited for such populations, especially in areas with low vaccination coverage or where layered preventative techniques are not used. Due to their high risk of exposure or severe illness, the CDC deems the ability to monitor COVID-19 incidence in the following populations to be particularly useful Health care workers, residents and staff members of long-term care facilities, incarcerated people, homeless people, and workers in high-density work sites, students and staff members of kindergarten-grade 12 schools and institutions of higher education, incarcerated people, homeless people, and workers in high-density work sites [33-38]. Rising case detection rates can act as an early warning indicator that prevention methods in the facility and the larger community need to be reinforced or introduced. Furthermore, strategic serial testing can aid in the prevention of SARS-CoV-2 transmission by quickly detecting asymptomatic cases, which are thought to account for at least 50% of SARS-CoV-2 transmission [39,40]. Further prevention and particular COVID-19 control methods should be addressed regarding the vaccine, testing, and prevention practices in other Ethiopian regions, according to our findings. Our research also confirmed the use of spatial and temporal clustering analysis with ArcGIS and SaTScan in identifying significant COVID-19 space-time clusters in Ethiopia. This could be utilized to develop COVID-19 preventive initiatives at the county level. However, the study’s analysis was limited. First and foremost, the data were studied at the county level, which is not the smallest administrative regionalization unit.As a result, we can rule out several important elements.Second, meteorological and socio-economic aspects were not taken into account in this study.
Conclusion
Using Kulldorff’s retrospective scan statistic approaches, we examined the geographical, temporal, and space-time clusters ofCOVID-19at the county level in Ethiopia from 201/11/23 to 2021/12/29.The results of the space-time scanning revealed that Addis Ababa is at high risk for COVID-19. These findings indicate that the Addis Ababa health office, Ethiopian Minister of Health, and Ethiopia Public Health Institute must implement preventive and control programs to reduceCOVID-19in Addis Ababa as soon as possible.
Declaration
Ethics approval and consent to participate
This research is based on secondary data from Ethiopia’s COVID-19, which is publically available at https://ethiopianhealthdata.org › COVID-19 Ethiopia Case Tracker Dashboard.
Consent for Publication
Not applicable
Availability of Data and Materials
The paper includes all data.
Competing Interest
There are no competing interests stated by the authors.
Funding
There was no financing available for this project.
Authors Contributions
KTT was responsible for the original drafting of the manuscript’s conceptualization, analysis, supervision, and development.
Methodology, Discussion, and Data Analysis were all done by KTT, ETT, AGA, and MKT.
KTT, ETT, MKT, GA, BB, KG, AT, AAA, AZ, WSB, MR, BFW, and AGA assisted with data analysis, critically revised the work, and agreed to be held accountable.
Acknowledgment
We’d like to thank Hawassa College of Health Science for assisting us with this study project.
REFERENCES
- Wang Y, Hu M, Li Q, Zhang XP, Zhai G, Yao N. Abnormal respiratory patterns classifier may contribute to large-scale screening of people infected with COVID-19 in an accurate and unobtrusive manner. ArXiv Preprint. 2002.
[crossref], [google scholar]
- Cromley EK, McLafferty SL. GIS and public health. Guilford Press. 2011.
- Manda SO, Darikwa T, Nkwenika T, Bergquist R. A spatial analysis of COVID-19 in African countries: evaluating the effects of socio-economic vulnerabilities and neighbouring. Int J Environ Res Public Health. 2021; 18(20):10783.
[crossref], [google scholar], [pubmed]
- Jesri N, Saghafipour A, Koohpaei A, Farzinnia B, Jooshin MK, Abolkheirian S, et al. Mapping and spatial pattern analysis of covid-19 in central iran using the Local Indicators of Spatial Association (LISA). BMC public health. 2021; 21(1):1-10.
[crossref], [google scholar], [pubmed]
- Ferreira MC. Spatial association between the incidence rate of COVID-19 and poverty in the Sao Paulo municipality, Brazil. Geospatial Health. 2020; 15(2).
[crossref], [google scholar], [pubmed]
- Islam J, Guo X, Ali MA, Islam MA, Qi X, Zhuang G. Spatial pattern of COVID-19 in Bangladesh: an ecological study. BMJ Open. 2021; 11(12):e047566.
[crossref], [google scholar]
- Schuler L, Calabrese JM, Attinger S. Data driven high resolution modelling and spatial analyses of the COVID-19 pandemic in Germany. MedRxiv. 2021.
[crossref], [google scholar], [pubmed]
- Wang Q, Dong W, Yang K, Ren Z, Huang D, Zhang P, et al. Temporal and spatial analysis of COVID-19 transmission in China and its influencing factors. Int J Infect Dis. 2021; 105:675-685.
[crossref], [google scholar], [pubmed]
- Zhu D, Ye X, Manson S. Revealing the spatial shifting pattern of COVID-19 pandemic in the United States. Scientific reports. 2021; 11(1):1-9.
[crossref], [google scholar], [pubmed]
- Franch-Pardo I, Napoletano BM, Rosete-Verges F, Billa L. Spatial analysis and GIS in the study of COVID-19. A review. Sci Total Environ. 2020; 739:140033.
[crossref], [google scholar], [pubmed]
- Hohl A, Delmelle EM, Desjardins MR, Lan Y. Daily surveillance of COVID-19 using the prospective space-time scan statistic in the United States. Spat Spatiotemporal Epidemiol. 2020; 34:100354.
[crossref], [google scholar], [pubmed]
- Ever W, Christina B, Yele Maweki N, Shohei R, Anirudh Venkatanarayan VV. Spatial heterogeneity of COVID-19 impacts on Urban household incomes: Between-and within-city evidence from two African Countries. The World Bank. 2021.
- Li L, Wan L. Understanding the spatial impact of COVID-19: New insights from Beijing after one year into post-lockdown recovery. Available at SSRN 3908277. 2021.
[crossref], [google scholar], [pubmed]
- Mollalo A, Vahedi B, Rivera KM. GIS-based spatial modelling of COVID-19 incidence rate in the continental United States. Sci Total Environ. 2020; 728:138884.
[crossref], [google scholar], [pubmed]
- Sarwar S, Waheed R, Sarwar S, Khan A. COVID-19 challenges to Pakistan: Is GIS analysis useful to draw solutions?. Sci Total Environ. 2020; 730:139089.
[crossref], [google scholar], [pubmed]
- Dong N, Yang X, Ye L, Chen K, Chan EW, Chen S. Genomic and protein structure modelling analysis depicts the origin and pathogenicity of 2019-nCoV, a new coronavirus which caused a pneumonia outbreak in Wuhan, China. F1000Res. 2020; 9(121):121.
- Arab-Mazar Z, Sah R, Rabaan AA, Dhama K, Rodriguez-Morales AJ. Mapping the incidence of the COVID-19 hotspot in Iran–Implications for Travellers. Travel Med Infect. 2020; 34:101630.
[crossref], [google scholar], [pubmed]
- Rezaei M, Nouri AA, Park GS, Kim DH. Application of geographic information system in monitoring and detecting the COVID-19 outbreak. Iran J Public Health. 2020; 49:114-116.
[crossref], [google scholar], [pubmed]
- Giuliani D, Dickson MM, Espa G, Santi F. Modelling and predicting the spatio-temporal spread of coronavirus disease 2019 (COVID-19) in Italy (3/20/2020). 2020.
[crossref], [google scholar], [pubmed]
- COVID19 – Ethiopia - Ethiopian Health Data. 2020.
- Alene KA, Gelaw YA, Fetene DM. COVID-19 in Ethiopia: a geospatial analysis of vulnerability to infection, case severity, and death. BMJ Open. 2021; 11:e044606.
[crossref], [google scholar], [pubmed]
- Abnormal respiratory patterns classifier may contribute to large-scale screening of people infected with COVID-19 in an accurate and unobtrusive manner.
- Ethiopia population 2021 (Demographics, Maps, Graphs)". Archived from the original on 23 May 2021. Retrieved 23 May 2021.
- Lyons, Terrence. "Closing the transition: The May 1995 elections in Ethiopia". J Modern African Studies. 1996; 34(1):121-142.
[crossref], [google scholar]
- Jones SG, Kulldorff M. Influence of spatial resolution on space-time disease cluster detection. PLoS One. 2012; 7(10):e48036.
[crossref], [google scholar], [pubmed]
- Kulldorff M. SaTScanTM User Guide for version 9.2. 2010.
- Alemu K, Worku A, Berhane Y. Malaria infection has spatial, temporal, and spatiotemporal heterogeneity in unstable malaria transmission areas in northwest Ethiopia. PloS one. 2013; 8(11):e79966.
[cross ref], [google scholar], [pubmed]
- Zhao F, Cheng S, He G, Huang F, Zhang H, Xu B, et al. Space-time clustering characteristics of tuberculosis in China, 2005-2011. PLoS One. 2013; 8(12):e83605.
[crossref], [google scholar], [pubmed]
- Areias C, Briz T, Nunes C. Pulmonary tuberculosis space–time clustering and spatial variation in temporal trends in Portugal, 2000-2010: an updated analysis. Epidemiology and Infection. 2015; 143(15):3211-3219.
[crossref], [google scholar], [pubmed]
- Wang WL, Wang HJ, Yao DE, Tie SO, Lan JM, Wu GZ, et al. Serological study of an imported case of middle east respiratory syndrome and his close contacts in China, 2015. Biomedical and Environmental Sciences. 2016; 29(3):219-223.
[cross ref], [google scholar], [pubmed]
- Zhang WY, Wang LY, Liu YX, Yin WW, Hu WB, Magalhaes RJ, et al. Spatiotemporal transmission dynamics of hemorrhagic fever with renal syndrome in China, 2005-2012. PLoS Negl Trop Dis. 2014; 8(11):e3344.
[crossref], [google scholar], [pubmed]
- Geto Z, Gebremichael S, Belete MA, Gedefie A, Molla G, Tesfaye M, et al. The escalating magnitude of covid-19 infections among the Northeastern Ethiopia Region: A community-based cross-sectional study. Int J Microbiol. 2021; 2021.
[crossref], [google scholar], [pubmed]
- David PA, Amy Z, Walensky Rochelle P. Assessment of SARS-CoV-2 Screening strategies to permit the safe reopening of college campuses in the United States. JAMA Netw Open. 2020; 3(7): e2016818.
[crossref], [google scholar], [pubmed]
- Lanier WA, Babitz KD, Collingwood A, Graul MF, Dickson S, Cunningham L, et al. COVID-19 testing to sustain in-person instruction and extracurricular activities in high schools—Utah, November 2020–March 2021. MMWR Morb Mortal Wkly Rep. 2021; 70(21):785.
[crossref], [google scholar], [pubmed]
- Bagchi S, Mak J, Li Q, Sheriff E, Mungai E, Anttila A, et al. Rates of COVID-19 among residents and staff members in nursing homes-United States, May 25-November 22, 2020. MMWR Morb Mortal Wkly Rep. 2021; 70(2):52.
[cross ref], [google scholar], [pubmed]
- Wallace M. COVID-19 in correctional and detention facilities-United States, February-April 2020. MMWR Morb Mortal Wkly Rep. 2020; 69.
[crossref], [google scholar], [pubmed]
- Mosites E, Parker EM, Clarke KE, Gaeta JM, Baggett TP, Imbert E, et al. Assessment of SARS-CoV-2 infection prevalence in homeless shelters-four US cities, March 27-April 15, 2020. MMWR Morb Mortal Wkly Rep. 2020; 69(17):521.
[cross ref], [google scholar], [pubmed]
- Dyal JW. COVID-19 among workers in meat and poultry processing facilities-19 states, April 2020. MMWR Morb Mortal Wkly Rep. 2020; 69.
[crossref], [google scholar], [pubmed]
- Moghadas SM, Fitzpatrick MC, Sah P, Pandey A, Shoukat A, Singer BH, et al. The implications of silent transmission for the control of COVID-19 outbreaks. Proceedings of the National Academy of Sciences. 2020; 117(30):17513-17515.
[crossref], [google scholar], [pubmed]
- Johansson MA, Quandelacy TM, Kada S, Prasad PV, Steele M, Brooks JT, et al. SARS-CoV-2 transmission from people without COVID-19 symptoms. JAMA Netw Open. 2021; 4(1):e2035057.
[crossref], [google scholar], [pubmed]
Citation: Tegegne KT, Tegegne ET, Tessema MK, Abera G, Bifato B, Gebremichael K, et al. (2022) COVID-19 Space-Time Cluster Detection in Ethiopia Using Retrospective Analysis. J Data Mining Genomics Proteomics. 13:250.
Copyright: © 2022 Tegegne KT, et al. This is an open-access article distributed under the terms of the Creative Commons Attribution License, which permits unrestricted use, distribution, and reproduction in any medium, provided the original author and source are credited.
