Indexed In
- Euro Pub
- Google Scholar
Useful Links
Share This Page
Journal Flyer

Open Access Journals
- Agri and Aquaculture
- Biochemistry
- Bioinformatics & Systems Biology
- Business & Management
- Chemistry
- Clinical Sciences
- Engineering
- Food & Nutrition
- General Science
- Genetics & Molecular Biology
- Immunology & Microbiology
- Medical Sciences
- Neuroscience & Psychology
- Nursing & Health Care
- Pharmaceutical Sciences
Research Article - (2023) Volume 12, Issue 2
Construction of miRNAs and Gene Expression Profiles Associated with Ischemic Cardiomyopathy: Bioinformatics Analysis
Phong Son Dinh1,2, Jun-Hua Peng1,3, ChauMy Thanh Tran2, Thanh Loan Tran4 and Shang-Ling Pan1,3*2Department of Medicine and Pharmacy, Duy Tan University, Da Nang, Vietnam
3Department of Medicine, GuSSangxi Medical University, Guangxi, China
4Department of Immunology and Pathophysiology, Hue University of Medicine and Pharmacy, Hue University, Vietnam
Received: 12-Oct-2022, Manuscript No. GJBAHS-22-18314; Editor assigned: 17-Oct-2022, Pre QC No. GJBAHS-22-18314 (PQ); Reviewed: 31-Oct-2022, QC No. GJBAHS-22-18314; Revised: 15-Feb-2023, Manuscript No. GJBAHS-22-18314 (R); Published: 20-Feb-2023, DOI: 10.35248/2319-5584.23.12.162
Abstract
Objective: Ischemic Cardiomyopathy (ICM) has ranked as the most common cause morbidity and mortality in the elderly over the past decades. One of the most important reasons for this is that its exact underlying mechanism remains poorly understood.
Method: Five datasets were downloaded from the GEO database. Differential Gene Expression (DGE) was identified by the R RobustRankAggreg package. Differential miRNA expression was evaluated by the Limma package. Gene potential functions were then determined by the clusterProfiler database. The miRNA-DGE regulatory network was predicted by cyTargetLinker. Then, a protein-protein interaction network was constructed by STRING tool, MCODE, and BiNGO tool.
Results: 91 miRNAs and 274 potential genes were identified. Of these, COL1A1, IGF1 and CCND1 were found to be involved in many signaling pathways; and miR-9-5p was found to play critical roles in ICM.
Conclusion: Our study has unraveled the potential key genes and miRNAs as well as the possible underlying molecular pathogenesis of ICM, which is a crucial step leading to a new avenue for the early intervention of this disorder.
Keywords
Ischemic cardiomyopathy; Heart failure; MiRNAs; mRNA; Network; Bioinformatics
Introduction
Cardiomyopathies are disorders in which the myocardium is structurally and functionally abnormal and may lead to Heart Failure (HF); Thr etiology can be divided into non-ischemic and ischemic causes. The former is designated cardiomyopathy independent of ischemic events, and can be caused by hypertension, valvular pathologies, toxins, or inheritance. Ischemic Cardiomyopathy (ICM) is defined as systolic dysfunction of the Left Ventricle (LV) due to Myocardial Infarction (MI), or >75% occlusion of a major coronary artery [1]. Extensive myocardial ischemia may result in acute and severe infarction of the ventricular wall and resultant HF with high mortality; whereas moderate and mild ventricular ischemia with less stenosis of the coronary artery may lead to chronic left ventricle impairment, typically presenting as myocardial stunning, hibernation and ventricular remodeling [2,3]. These manifestations have been ascribed to a series of pathological processes-inflammation, metabolic dysfunction, fibrosis and scarring of myocardial cells or extracellular matrix [4,5], resulting in progressive degradation of cardiac, contractility, ventricular dilatation, and eventually chronic heart failure.
Once initiated, a chronic pathology is progressive and irreversible. Cardiologists attempt to slow the progression of chronically ICM-derived heart failure. The limited progress to date suggests that the research directions and identified signaling pathways-including inflammatory mediators (e.g., cytokines, chemokines) profibrotic and apoptotic factors (e.g., transforming growth factor β) and remodeling associated component matrix metalloproteinases are not the sole contributors to ICM [6,7].
MicroRNAs (miRNAs) are highly conserved non-coding RNAs of approximately 22 nucleotides and are widely expressed in eukaryotes, miRNAs regulate the expression of target genes at the post-transcriptional level by binding to their 3’-untranslated regions [8,9]. Many miRNAs are implicated in the development of ICM [7-11]. Therefore, miRNAs are key players in the pathogenesis of ICM.
Based on miRNAs in public databases and bioinformatics, we constructed an interactive network between ICM associated miRNAs and related genes and signaling pathways, including genes linked to early diagnosis and prognosis of ICM.
Materials and Methods
Data acquisition and rank aggregation methods
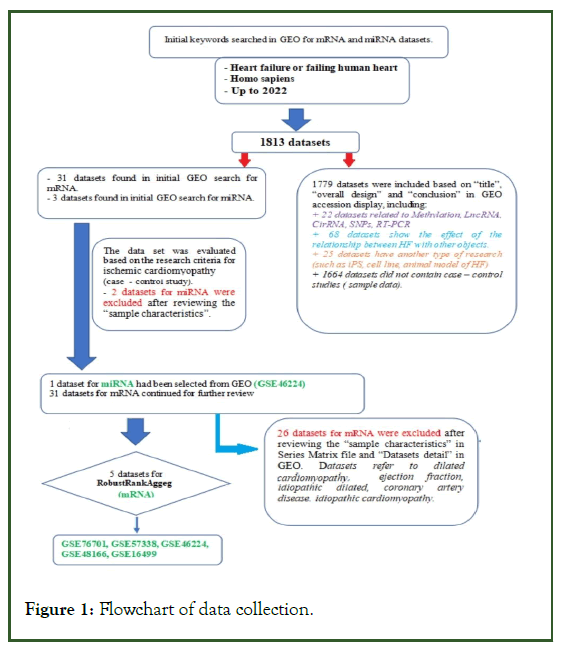
ICM Differentially Expressed Gene (DEG) datasets based on human heart tissue; more than three left ventricular samples from patients and healthy controls, and evaluation of miRNA/ mRNA expression in ICM were retrieved from the public database Gene Expression Omnibus (GEO) (Figure 1). The gene expression datasets used were GSE16499 (GPL5175), GSE48166 (GPL9115), GSE46224 (GPL11154), GSE57338 (GPL11532), and GSE76701 (GPL570) [12-16].
Figure 1: Flowchart of data collection.
A total of 315 samples (178 ICM and 137 control samples) met the criteria for analysis. Eight ICM and eight control samples from GSE46224 (GPL11154) were subjected to differential miRNA expression analysis (Table 1). The GSE ID, highthroughput data, and characteristics of the control and ICM groups were collected in a series matrix file and analyzed by R v. 3.6.2.
| GEO accession number | Subjects | Platform | ||
|---|---|---|---|---|
| control | ICM | |||
| mRNA | GSE76701 | 4 | 4 | Affymetrix human genome U133 plus 2.0 array |
| GSE57338 | 95 | 136 | Affymetrix human gene 1.1 ST array | |
| GSE46224 | 8 | 8 | Illumina hiSeq 2000 (homo sapiens) | |
| GSE48166 | 15 | 15 | Illumina genome analyzer II (Homo sapiens) | |
| GSE16499 | 15 | 15 | Affymetrix human exon 1.0 ST array | |
| miRNA | GSE46224 | 8 | 8 | Illumina hiSeq 2000 (Homo sapiens) |
Table 1: Databases used in this study.
R v.3.6.2, Bioconductor and linear model with d atasets analysis (Limma) software were used to conduct differential miRNA expression and DEG analyses [17,18]. P values were corrected using the false discovery rate (FDR) correction toolkit in R v. 3.6.2 software. A p value <0.05 and FDR <0.05 for GSE (fold change >0.5) were regarded as indicative of a significant difference. DEGs common to more than one gene expression dataset were identified and visualized using the RobustRankAggreg package in R [19].
Gene Ontology (GO) and Kyoto Encyclopedia of Genes and Genomes (KEGG) enrichment analyses
To assess the functions of Differentially Expressed Genes (DEGs) in ICM, the clusterProfiler package v.14.3 was used for GO and signaling pathway analyses. A p<0.05 was used as the cut-off to determine significant enrichment [20].
Construction of the miRNA-mRNA regulatory network and module analysis based on the Protein- Protein Interaction (PPI) network.
The KEGG pathway and miRNA analysis results were transferred to Cytoscape v.3.6.1 and used to construct a network. The regulatory network was predicted by cyTargetLinker using the targetscan-hsa-7, miRTarBase-hsa-7, and miRBase-hsa-v2.1databases [21]. A miRNA-potential gene network was constructed using a gene regulatory subnetwork. The search tool for the retrieval of interacting genes/proteins (STRING) database was used to construct a PPI network [22]. Modules comprising genes of similar biological functions were analyzed using the Mcode package in Cytoscape software (adjusted p<0.05). A K-core ≥ 2, node score cutoff =0.2, degree cutoff ≥2 and MCODE score ≥3 were the cutoff values for module analysis. Functionally associated genes in the modules were classified using the BiNGO tool.
Result
Identification of differentially expressed genes and miRNAs in ICM
The DEG analyses revealed 179 up-regulated and 95 downregulated genes in left ventricle samples (Table 2). Additionally, there were 91 differentially expressed miRNAs in ICM, comprising 45 up-regulated and 46 down-regulated miRNAs (Table 3). The top 10 up and down-regulated genes and miRNAs are listed in Tables 4 and 5, respectively.
| Up regulated | log2FC | p value | Down regulated | log2FC | p value |
|---|---|---|---|---|---|
| HBB | 2.35438 | 1.59E-14 | SERPINA3 | -1.9873 | 1.63E-16 |
| NPPA | 2.34081 | 7.78E-13 | MYH6 | -1.8239 | 1.24E-15 |
| NPPB | 1.78925 | 8.00E-10 | FCN3 | -1.4565 | 8.55E-14 |
| SFRP4 | 1.463 | 5.68E-10 | CD163 | -1.2651 | 6.30E-11 |
| HBA1 | 1.39561 | 9.99E-08 | CYP4B1 | -1.2067 | 1.21E-07 |
| EIF1AY | 1.3807 | 8.82E-06 | VSIG4 | -1.1862 | 8.79E-10 |
| MXRA5 | 1.35172 | 1.89E-12 | METTL7B | -1.1031 | 2.73E-12 |
| ASPN | 1.35018 | 4.78E-11 | PLA2G2A | -1.0512 | 3.94E-08 |
| FMOD | 1.3235 | 7.76E-11 | F13A1 | -0.9869 | 2.21E-08 |
| HBA2 | 1.31982 | 3.15E-07 | ANKRD2 | -0.9623 | 3.86E-09 |
| LUM | 1.26687 | 8.17E-12 | LYVE1 | -0.9574 | 1.52E-08 |
| THBS4 | 1.10191 | 8.24E-11 | IL1RL1 | -0.8765 | 3.21E-07 |
| MFAP4 | 1.09818 | 8.07E-10 | HMGCS2 | -0.8263 | 2.74E-07 |
| AEBP1 | 1.08107 | 2.35E-08 | S100A9 | -0.8012 | 3.92E-08 |
| POSTN | 1.05302 | 1.14E-08 | RNASE2 | -0.7968 | 2.09E-07 |
| LTBP2 | 1.04427 | 6.77E-08 | MYOT | -0.794 | 1.62E-06 |
| RPS4Y1 | 1.03748 | 0.00059 | NPTX2 | -0.7713 | 2.39E-06 |
| EGR1 | 1.03201 | 1.62E-06 | FAM46B | -0.7681 | 2.01E-06 |
| COL14A1 | 1.01691 | 4.86E-10 | BLM | -0.7356 | 5.40E-05 |
| OGN | 1.0135 | 3.86E-09 | GRB14 | -0.721 | 1.50E-06 |
| UCHL1 | 1.00595 | 3.53E-09 | DHRS7C | -0.7208 | 5.64E-06 |
| CHRDL1 | 0.99987 | 5.07E-08 | FKBP5 | -0.7076 | 2.69E-06 |
| SMOC2 | 0.98677 | 6.06E-09 | CA14 | -0.6945 | 3.60E-07 |
| PENK | 0.98451 | 1.16E-06 | AQP4 | -0.6923 | 2.04E-08 |
| FRZB | 0.98006 | 1.06E-08 | FCGBP | -0.6672 | 1.03E-08 |
| ISLR | 0.92789 | 3.04E-11 | SLCO4A1 | -0.6642 | 0.00016 |
| PI16 | 0.92399 | 7.64E-10 | TIMP4 | -0.66 | 1.62E-05 |
| USP9Y | 0.90006 | 4.26E-05 | CSDC2 | -0.6578 | 2.14E-05 |
| CTGF | 0.88894 | 1.75E-06 | XIST | -0.6556 | 0.0021 |
| PHLDA1 | 0.86589 | 8.71E-10 | CD14 | -0.6548 | 3.26E-06 |
| KDM5D | 0.85499 | 0.00088 | TUBA3D | -0.6405 | 0.00024 |
| BEX1 | 0.8449 | 2.74E-07 | FCER1G | -0.6358 | 2.07E-05 |
| PTN | 0.83506 | 1.62E-06 | MID1IP1 | -0.6346 | 9.84E-09 |
| COL1A1 | 0.81817 | 4.62E-07 | ADAMTS15 | -0.6278 | 7.09E-06 |
| OMD | 0.78574 | 2.16E-07 | GFPT2 | -0.6264 | 0.00016 |
| DPT | 0.76206 | 3.15E-08 | MGST1 | -0.6141 | 0.00022 |
| TNNT1 | 0.75214 | 2.58E-08 | SGPP2 | -0.6106 | 7.35E-06 |
| COL1A2 | 0.74222 | 4.64E-06 | AOX1 | -0.5995 | 0.00024 |
| SCN2B | 0.72956 | 1.15E-07 | ART3 | -0.5975 | 0.00018 |
| STAT4 | 0.72391 | 5.43E-05 | PLIN2 | -0.5925 | 2.53E-06 |
| SULF1 | 0.72052 | 2.83E-07 | CHST9 | -0.5892 | 0.00017 |
| COLQ | 0.71931 | 2.00E-08 | C1orf162 | -0.5812 | 1.14E-05 |
| CCDC80 | 0.71498 | 9.62E-05 | ANXA3 | -0.5773 | 0.00054 |
| COMP | 0.71388 | 0.0045 | KCND3 | -0.5758 | 4.82E-05 |
| PRELP | 0.71236 | 7.20E-07 | MRC1 | -0.5701 | 0.00784 |
| NAP1L3 | 0.70466 | 5.13E-05 | HMOX2 | -0.5701 | 7.49E-05 |
| CRYM | 0.69382 | 5.52E-08 | ALOX5AP | -0.5684 | 8.08E-06 |
| FBLN1 | 0.69134 | 2.09E-07 | HOGA1 | -0.5673 | 0.00515 |
| SDSL | 0.68971 | 2.39E-08 | CHDH | -0.5668 | 2.87E-06 |
| ECM2 | 0.68806 | 7.77E-08 | KIAA0040 | -0.563 | 1.16E-05 |
| HTRA1 | 0.68008 | 1.85E-08 | CADPS2 | -0.5628 | 0.0001 |
| ITIH5 | 0.67974 | 2.04E-07 | MPP3 | -0.5575 | 8.91E-07 |
| EXT1 | 0.66128 | 2.30E-08 | GNMT | -0.5568 | 0.00354 |
| FNDC1 | 0.6603 | 0.00019 | SLC19A2 | -0.5554 | 0.00523 |
| OGDHL | 0.6552 | 1.47E-06 | CCR1 | -0.5543 | 0.00112 |
| CFH | 0.65465 | 4.14E-06 | S1PR3 | -0.551 | 0.00079 |
| EDNRA | 0.64602 | 9.93E-08 | GALNT15 | -0.551 | 0.00685 |
| DPYSL3 | 0.6446 | 4.07E-09 | LCN6 | -0.545 | 0.00038 |
| ABCG2 | 0.63888 | 2.19E-06 | PPP1R1A | -0.5424 | 1.61E-05 |
| WNT9A | 0.63648 | 2.06E-05 | EIF4EBP1 | -0.5409 | 0.0029 |
| SCUBE2 | 0.62144 | 1.18E-06 | SHISA3 | -0.5384 | 0.00077 |
| EGR2 | 0.61965 | 0.00134 | CYBB | -0.5367 | 0.0051 |
| PLCE1 | 0.61819 | 6.36E-06 | CNTN3 | -0.5336 | 0.01049 |
| RASL11B | 0.61347 | 3.54E-08 | PTDSS1 | -0.5331 | 9.43E-05 |
| C16orf89 | 0.6103 | 1.36E-07 | CPAMD8 | -0.5294 | 0.00018 |
| FREM1 | 0.60903 | 9.26E-07 | C1QC | -0.5272 | 6.41E-05 |
| HSPA2 | 0.60624 | 2.93E-06 | LPCAT3 | -0.527 | 1.53E-05 |
| CRISPLD1 | 0.60481 | 0.00036 | CD300LG | -0.5253 | 0.00022 |
| ITGBL1 | 0.60046 | 4.44E-05 | EDNRB | -0.522 | 0.00024 |
| PROM1 | 0.59972 | 0.00196 | PPL | -0.5217 | 0.00395 |
| HSPB6 | 0.59931 | 0.00212 | LAPTM5 | -0.5205 | 0.00056 |
| NRK | 0.59814 | 0.00028 | LCN10 | -0.52 | 8.34E-05 |
| IFI44L | 0.59812 | 7.33E-05 | MT1X | -0.5191 | 2.93E-05 |
| TSPAN9 | 0.5957 | 5.89E-08 | SLA | -0.5185 | 0.00088 |
| ENO2 | 0.59357 | 1.50E-05 | NQO1 | -0.5169 | 0.00492 |
| IFIT3 | 0.59088 | 0.00013 | AASS | -0.5148 | 0.00068 |
| PLVAP | 0.5906 | 0.00347 | AGXT2L1 | -0.5143 | 4.44E-05 |
| APOA1 | 0.58927 | 0.00059 | TUBA3E | -0.5132 | 0.00095 |
| SLC16A9 | 0.58833 | 9.37E-06 | C3AR1 | -0.513 | 0.00032 |
| IRX6 | 0.58811 | 0.00472 | C1QTNF1 | -0.5095 | 0.00016 |
| CH25H | 0.58419 | 0.00079 | MT1A | -0.5091 | 2.76E-05 |
| ARHGAP1 | 0.58345 | 6.89E-06 | C1orf105 | -0.5082 | 0.00015 |
| DDX3Y | 0.58314 | 0.00011 | FAM58A | -0.508 | 2.72E-06 |
| TLL2 | 0.58177 | 0.00065 | CD38 | -0.5074 | 8.51E-05 |
| RGS4 | 0.58023 | 1.45E-05 | CHL1 | -0.5073 | 4.74E-07 |
| EPHA3 | 0.57833 | 6.44E-06 | CHRDL2 | -0.5057 | 3.91E-06 |
| SNCA | 0.57811 | 0.00066 | S100A8 | -0.5052 | 0.00034 |
| ANTXR1 | 0.57318 | 5.30E-07 | TLR2 | -0.5047 | 6.59E-06 |
| CPXM2 | 0.57315 | 2.84E-05 | ST6GALNAC3 | -0.5045 | 0.0039 |
| TMEM71 | 0.57188 | 3.80E-06 | C1QB | -0.5043 | 7.66E-05 |
| IFI6 | 0.57076 | 0.00039 | ITGAM | -0.5038 | 0.04411 |
| SYTL2 | 0.57044 | 0.00132 | CHAC2 | -0.5032 | 1.22E-05 |
| CCND1 | 0.5665 | 3.52E-05 | C19orf33 | -0.5026 | 9.66E-06 |
| IGSF10 | 0.56638 | 4.38E-06 | F8 | -0.5021 | 2.77E-06 |
| COL3A1 | 0.56411 | 0.00046 | CPM | -0.5004 | 0.00592 |
| IFIT2 | 0.56275 | 6.83E-05 | |||
| PLAT | 0.56209 | 1.41E-05 | |||
| BGN | 0.56158 | 8.87E-05 | |||
| ARRDC3 | 0.56135 | 4.11E-05 | |||
| KLHL13 | 0.56119 | 3.14E-06 | |||
| PROS1 | 0.56106 | 0.0001 | |||
| SFRP1 | 0.5596 | 0.00032 | |||
| MYH10 | 0.55905 | 1.15E-06 | |||
| CA3 | 0.55605 | 0.00176 | |||
| SOD3 | 0.55589 | 0.00115 | |||
| MXRA8 | 0.55455 | 0.00182 | |||
| APLNR | 0.55422 | 0.00991 | |||
| LEPREL1 | 0.55083 | 1.19E-05 | |||
| LTBP4 | 0.55078 | 1.02E-06 | |||
| FZD7 | 0.54696 | 0.00012 | |||
| PTGFRN | 0.54619 | 2.93E-06 | |||
| CCDC3 | 0.546 | 3.49E-06 | |||
| EPHX2 | 0.54456 | 0.00044 | |||
| MDK | 0.54427 | 5.52E-06 | |||
| OLFML1 | 0.54304 | 0.00056 | |||
| NT5E | 0.54251 | 0.00068 | |||
| F2R | 0.54109 | 1.29E-05 | |||
| PLEKHH2 | 0.54017 | 0.00065 | |||
| COL12A1 | 0.53775 | 1.04E-05 | |||
| JAK2 | 0.53761 | 7.80E-07 | |||
| ANKRD34C | 0.53662 | 0.01392 | |||
| FAP | 0.53648 | 7.17E-05 | |||
| PDE5A | 0.53558 | 0.00015 | |||
| LTBP3 | 0.53472 | 1.77E-06 | |||
| MATN2 | 0.5344 | 1.44E-06 | |||
| APLP1 | 0.53423 | 6.19E-05 | |||
| FIBIN | 0.53411 | 4.11E-05 | |||
| C10orf71 | 0.53305 | 1.50E-06 | |||
| PDGFD | 0.53295 | 5.27E-06 | |||
| USP11 | 0.53191 | 1.37E-05 | |||
| DIO2 | 0.53173 | 0.00131 | |||
| MYO1D | 0.53161 | 0.00033 | |||
| CILP | 0.53014 | 0.00313 | |||
| LMOD2 | 0.52989 | 0.00144 | |||
| HIST1H2AK | 0.52893 | 2.67E-06 | |||
| IER2 | 0.52837 | 0.00957 | |||
| TNFRSF11B | 0.52627 | 0.00397 | |||
| MSS51 | 0.52608 | 0.00034 | |||
| ANO1 | 0.52558 | 1.53E-06 | |||
| COL8A1 | 0.52459 | 0.0001 | |||
| EGLN3 | 0.52453 | 0.00018 | |||
| SLN | 0.52433 | 0.00474 | |||
| IGFBP5 | 0.52425 | 3.63E-05 | |||
| COL16A1 | 0.52323 | 0.0001 | |||
| MYOC | 0.52254 | 0.00531 | |||
| PIK3IP1 | 0.52115 | 2.57E-06 | |||
| PODN | 0.52111 | 2.14E-05 | |||
| KCNN3 | 0.52111 | 0.00011 | |||
| ENPP2 | 0.52078 | 0.00099 | |||
| PPDPF | 0.52052 | 0.00064 | |||
| GSTM5 | 0.51928 | 0.00034 | |||
| MRC2 | 0.51905 | 1.83E-06 | |||
| MLLT11 | 0.51855 | 0.00122 | |||
| FGF1 | 0.51792 | 1.55E-07 | |||
| THY1 | 0.51708 | 0.01545 | |||
| CCDC113 | 0.51619 | 0.00062 | |||
| SERPINI1 | 0.51585 | 9.62E-05 | |||
| ABI3BP | 0.51546 | 9.24E-06 | |||
| ZMYND17 | 0.51487 | 0.00044 | |||
| MAFK | 0.51392 | 0.00346 | |||
| CXCL14 | 0.51383 | 0.00126 | |||
| PCOLCE2 | 0.51364 | 0.00101 | |||
| COL21A1 | 0.51324 | 1.59E-05 | |||
| SCRN1 | 0.51001 | 0.00084 | |||
| ODC1 | 0.50986 | 0.00294 | |||
| MNS1 | 0.50955 | 0.00013 | |||
| TRIL | 0.50932 | 0.00662 | |||
| XG | 0.50844 | 4.61E-05 | |||
| CTSK | 0.50833 | 0.00012 | |||
| C1QTNF7 | 0.50747 | 1.33E-05 | |||
| SNAP47 | 0.50625 | 5.34E-06 | |||
| OAS1 | 0.50624 | 0.00011 | |||
| GLT8D2 | 0.50603 | 3.74E-06 | |||
| PLXDC2 | 0.50597 | 0.00038 | |||
| SVEP1 | 0.5057 | 0.0003 | |||
| THBS3 | 0.50481 | 1.48E-05 | |||
| SERPINE2 | 0.50481 | 0.03352 | |||
| IGF1 | 0.50418 | 0.0006 | |||
| BOC | 0.50308 | 5.34E-06 | |||
Table 2: The DGE analyses revealed 179 up-regulated and 95 down-regulated genes from 5 genetic databases.
| Up-regulated miRNA | log2FC | P value | Down-regulated miRNA | log2FC | P value |
|---|---|---|---|---|---|
| hsa-miR-144-3p | 4.606894 | 0.001406 | hsa-miR-221-5p | -2.6281 | 0.000131 |
| hsa-miR-144-5p | 4.342799 | 0.000127 | hsa-miR-378b | -2.42053 | 0.045604 |
| hsa-miR-182-5p | 3.965608 | 7.46E-05 | hsa-miR-4797-3p | -1.84247 | 0.024277 |
| hsa-miR-451a | 3.910478 | 0.0002 | hsa-miR-9-5p | -1.77943 | 0.002412 |
| hsa-miR-183-5p | 3.782411 | 0.001284 | hsa-miR-675-5p | -1.77241 | 0.002454 |
| hsa-miR-184 | 2.666112 | 0.002998 | hsa-miR-519c-3p | -1.65407 | 0.002811 |
| hsa-miR-129-5p | 2.327642 | 0.002222 | hsa-miR-222-3p | -1.60432 | 1.17E-05 |
| hsa-miR-4508 | 2.214633 | 0.004026 | hsa-miR-520c-3p | -1.58706 | 0.024758 |
| hsa-miR-34c-5p | 2.160532 | 0.00038 | hsa-miR-221-3p | -1.57555 | 2.94E-06 |
| hsa-miR-96-5p | 2.112541 | 0.033934 | hsa-miR-378f | -1.54865 | 0.005427 |
| hsa-miR-1246 | 2.007445 | 0.012235 | hsa-miR-138-5p | -1.39156 | 0.049468 |
| hsa-miR-4800-3p | 1.896722 | 0.021801 | hsa-miR-4441 | -1.3709 | 0.04521 |
| hsa-miR-190b | 1.742823 | 0.01474 | hsa-miR-1303 | -1.36701 | 0.015669 |
| hsa-miR-34c-3p | 1.509602 | 0.000921 | hsa-miR-548ao-3p | -1.36052 | 0.008756 |
| hsa-miR-4492 | 1.375878 | 0.025098 | hsa-miR-3679-5p | -1.3254 | 0.03725 |
| hsa-miR-301b | 1.331442 | 0.007796 | hsa-miR-483-5p | -1.31768 | 0.003427 |
| hsa-miR-155-5p | 1.305902 | 0.004332 | hsa-miR-1301 | -1.27307 | 0.028351 |
| hsa-miR-545-5p | 1.26616 | 0.018262 | hsa-miR-378i | -1.26763 | 0.006838 |
| hsa-miR-5002-5p | 1.207722 | 0.01083 | hsa-miR-1323 | -1.19812 | 0.02686 |
| hsa-miR-3614-5p | 1.189791 | 0.044558 | hsa-miR-1254 | -1.17484 | 0.004867 |
| hsa-miR-3938 | 1.174843 | 0.004867 | hsa-miR-378g | -1.08558 | 0.011694 |
| hsa-miR-141-3p | 1.165777 | 0.034331 | hsa-miR-1306-3p | -1.05945 | 0.041574 |
| hsa-miR-3688-3p | 1.155039 | 0.038069 | hsa-miR-20a-5p | -1.05769 | 0.00161 |
| hsa-miR-708-5p | 1.134239 | 0.005551 | hsa-miR-302a-3p | -1.05233 | 0.013938 |
| hsa-miR-542-3p | 1.132806 | 0.046154 | hsa-miR-362-5p | -0.99887 | 0.000989 |
| hsa-miR-34b-5p | 1.105441 | 0.038479 | hsa-miR-150-5p | -0.99762 | 0.00265 |
| hsa-miR-301a-5p | 1.104563 | 0.032681 | hsa-miR-1197 | -0.93648 | 0.019612 |
| hsa-miR-4707-3p | 1.094361 | 0.04481 | hsa-miR-490-5p | -0.91371 | 0.005685 |
| hsa-miR-4732-3p | 1.082722 | 0.02607 | hsa-miR-422a | -0.90036 | 0.023588 |
| hsa-miR-125b-1-3p | 1.077469 | 0.022832 | hsa-miR-4682 | -0.89624 | 0.047849 |
| hsa-miR-548h-3p | 1.040241 | 0.024013 | hsa-miR-17-5p | -0.88517 | 0.001473 |
| hsa-miR-1285-5p | 1.028602 | 0.025828 | hsa-miR-429 | -0.8846 | 0.020118 |
| hsa-miR-320b | 1.004797 | 0.002306 | hsa-miR-548l | -0.8846 | 0.020118 |
| hsa-miR-34b-3p | 0.936482 | 0.030232 | hsa-miR-302d-3p | -0.85135 | 0.02825 |
| hsa-miR-493-3p | 0.910269 | 0.025234 | hsa-miR-486-5p | -0.84345 | 0.012492 |
| hsa-miR-21-5p | 0.896306 | 0.038306 | hsa-miR-193a-5p | -0.8226 | 0.013911 |
| hsa-miR-195-3p | 0.894215 | 0.010732 | hsa-miR-338-5p | -0.80922 | 0.030131 |
| hsa-miR-130b-5p | 0.86694 | 0.041394 | hsa-miR-378e | -0.7788 | 0.046872 |
| hsa-miR-708-3p | 0.77362 | 0.033859 | hsa-miR-378h | -0.76744 | 0.008128 |
| hsa-miR-130b-3p | 0.754336 | 0.034909 | hsa-miR-665 | -0.74033 | 0.029442 |
| hsa-miR-339-5p | 0.740642 | 0.041285 | hsa-miR-29c-5p | -0.72317 | 0.020047 |
| hsa-miR-106b-3p | 0.730287 | 0.037179 | hsa-miR-378a-3p | -0.70929 | 0.004223 |
| hsa-miR-154-5p | 0.717875 | 0.046722 | hsa-miR-188-5p | -0.70922 | 0.038996 |
| hsa-miR-769-5p | 0.686929 | 0.023314 | hsa-miR-499a-5p | -0.7 | 0.030848 |
| hsa-miR-497-5p | 0.51134 | 0.021255 | hsa-miR-491-3p | -0.64498 | 0.026676 |
| hsa-miR-30c-5p | -0.53719 | 0.046957 |
Table 3: The differentially expressed miRNAs analyses revealed 45 up-regulated and 46 down-regulated miRNAs from GSE46224.
| Up regulated | log2FC | P value | Down regulated | log2FC | P value |
|---|---|---|---|---|---|
| HBB | 2.354376 | 1.59E-14 | SERPINA3 | -1.98731 | 1.63E-16 |
| NPPA | 2.34081 | 7.78E-13 | MYH6 | -1.82385 | 1.24E-15 |
| NPPB | 1.789251 | 8.00E-10 | FCN3 | -1.4565 | 8.55E-14 |
| SFRP4 | 1.462998 | 5.68E-10 | CD163 | -1.26507 | 6.30E-11 |
| HBA1 | 1.395612 | 9.99E-08 | CYP4B1 | -1.20673 | 1.21E-07 |
| EIF1AY | 1.380697 | 8.82E-06 | VSIG4 | -1.18622 | 8.79E-10 |
| MXRA5 | 1.351716 | 1.89E-12 | METTL7B | -1.10309 | 2.73E-12 |
| ASPN | 1.350178 | 4.78E-11 | PLA2G2A | -1.05118 | 3.94E-08 |
| FMOD | 1.323499 | 7.76E-11 | F13A1 | -0.98689 | 2.21E-08 |
| HBA2 | 1.31982 | 3.15E-07 | ANKRD2 | -0.96234 | 3.86E-09 |
Table 4: Top 10 up and down-regulated genes.
| Upregulated miRNA | log2FC | p value | Downregulated miRNA | log2FC | p value |
|---|---|---|---|---|---|
| hsa-miR-144-3p | 4.606894 | 0.001406 | hsa-miR-221-5p | -2.6281 | 0.000131 |
| hsa-miR-144-5p | 4.342799 | 0.000127 | hsa-miR-378b | -2.42053 | 0.045604 |
| hsa-miR-182-5p | 3.965608 | 7.46E-05 | hsa-miR-4797-3p | -1.84247 | 0.024277 |
| hsa-miR-451a | 3.910478 | 0.0002 | hsa-miR-9-5p | -1.77943 | 0.002412 |
| hsa-miR-183-5p | 3.782411 | 0.001284 | hsa-miR-675-5p | -1.77241 | 0.002454 |
| hsa-miR-184 | 2.666112 | 0.002998 | hsa-miR-519c-3p | -1.65407 | 0.002811 |
| hsa-miR-129-5p | 2.327642 | 0.002222 | hsa-miR-222-3p | -1.60432 | 1.17E-05 |
| hsa-miR-4508 | 2.214633 | 0.004026 | hsa-miR-520c-3p | -1.58706 | 0.024758 |
| hsa-miR-34c-5p | 2.160532 | 0.00038 | hsa-miR-221-3p | -1.57555 | 2.94E-06 |
| hsa-miR-96-5p | 2.112541 | 0.033934 | hsa-miR-378f | -1.54865 | 0.005427 |
Table 5: Top 10 up and downregulated miRNAs.
GO and KEGG pathway enrichment analysis of DEGs
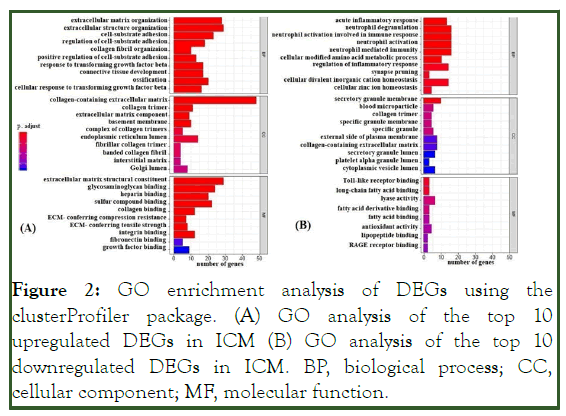
GO and pathway enrichment analyses revealed the up-regulated and down-regulated genes in ICM. Totals of 342 GO terms for up-regulated genes and 69 GO terms for down-regulated genes were identified. The GO terms for up-regulated genes indicated Molecular Function (MF) related pathways such as extracellular matrix structural constituent, collagen binding, Wnt-protein binding, proteoglycan binding, growth factor binding, glycosaminoglycan binding, and heparin binding. The GO terms for down-regulated genes indicated MF related pathways such as toll-like receptor binding, long-chain fatty acid binding, and lyase activity. The GO terms of associated genes were ranked by their adjusted p values (p<0.05; adjusted p<0.05) (Figure 2).
Figure 2: GO enrichment analysis of DEGs using the clusterProfiler package. (A) GO analysis of the top 10 upregulated DEGs in ICM (B) GO analysis of the top 10 downregulated DEGs in ICM. BP, biological process; CC, cellular component; MF, molecular function.
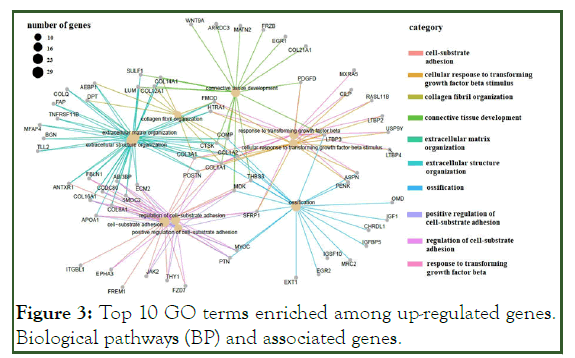
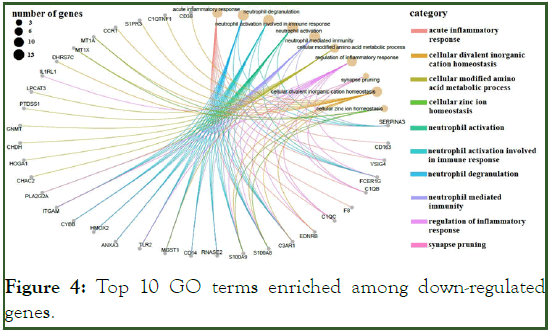
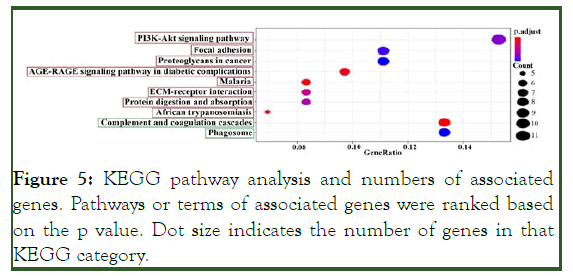
The GO terms for up-regulated genes encompassed extracellular matrix organization, extracellular structure organization, cell-substrate adhesion, regulation of cell-substrate adhesion (e.g., POSTN, SMOC2, COL1A1, CCDC80, FBLN1, ECM2, COL8A1, COL16A1, and ABI3BP) and connective tissue development (COL14A1, WNT9A, COL12A1, and PDGFD), ossification signaling pathway, cellular response to transforming growth factor beta stimulus signaling pathway, and trans-membrane receptor protein serine/threonine kinase signaling pathway (ASPN, COL1A2, LTBP3, and SFRP1) (Figure 3). Most of the down-regulated genes were involved in the acute inflammatory response, neutrophil activation (e.g. SERPINA3, FCER1G, C3AR1, and S100A8), cellular modified amino acid metabolic processes (e.g., PLA2G2A, MGST1, CHAC2, HOGA1, CHDH, and GNMT), regulation of the inflammatory response (e.g., VSIG4, IL1RL1, TLR2, and FCER1G), and acute-phase response (e.g., SERPINA3, CD163, F8, and EDNRB) (Figure 4 and Figure 5).
Figure 3: Top 10 GO terms enriched among up-regulated genes. Biological pathways (BP) and associated genes.
Figure 4: Top 10 GO terms enriched among down-regulated genes.
Figure 5: KEGG pathway analysis and numbers of associated genes. Pathways or terms of associated genes were ranked based on the p value. Dot size indicates the number of genes in that KEGG category.
KEGG enrichment analysis showed that eight pathways had up-regulated genes and two pathways had down-regulated genes (p <0.05). The pathways are shown in Figure 5.
Prediction of the miRNA-mRNA network
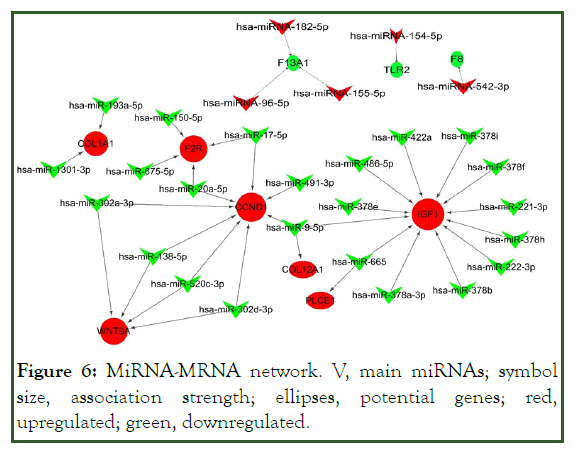
The up-regulated miRNA target gene regulatory network comprised 8292 genes, 45 up-regulated miRNAs, and 21,151 edges. The down-regulated miRNA-target gene regulatory network included 8075 genes, 46 down-regulated miRNAs, and 25,577 edges. Then, the sub-network for potential genes in KEGG was identified, which clearly showed the involvement of several miRNAs in potential gene regulation. We selected leading miRNAs and potential genes via the involvement of many candidates in the miRNA-mRNA network. In the sub-network, 5 up-regulated and 23 down-regulated miRNAs were linked to potential genes. Several leading miRNAs showed associations with multiple genes. For instance, miR-9-5p (log2FC 1.78) targets CCND1, IGF1, and COL12A1; other miRNAs were linked to IGF1, CCND1, WNT9A, F2R, and COL1A1 (Figure 6).
Figure 6: MiRNA-MRNA network. V, main miRNAs; symbol size, association strength; ellipses, potential genes; red, upregulated; green, downregulated.
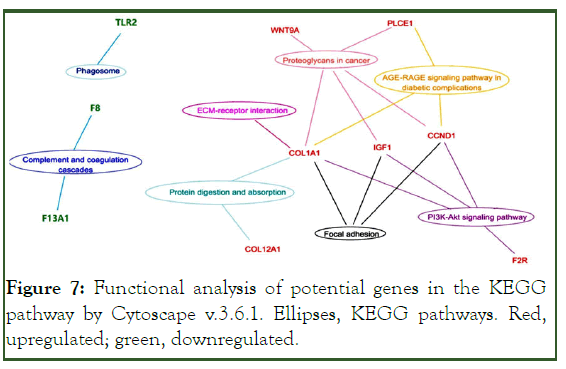
The COL1A1, IGF1, and CCND1 genes participated in major signaling pathways (Figure 7).
Figure 7: Functional analysis of potential genes in the KEGG pathway by Cytoscape v.3.6.1. Ellipses, KEGG pathways. Red, upregulated; green, downregulated.
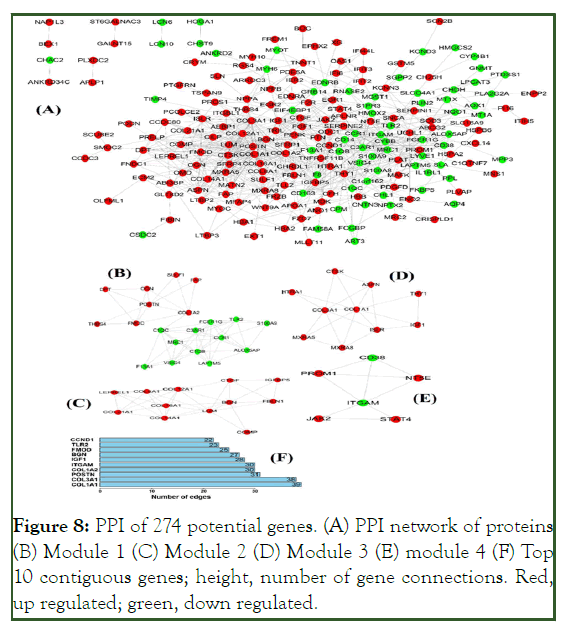
The PPI network encompassed 274 nodes corresponding to 274 genes with 1520 connecting edges (Figure 8A). Module 1 (confidence score 6.105) comprised 20 nodes and 58 connecting edges (Figure 8B). Module 2 (score 6.182) consisted of 12 nodes and 34 connecting edges (Figure 8C). Module 3 (score 4.667) comprised 10 nodes and 21 connecting edges (Figure 8D). Module 4 (score 3.6) consisted of six nodes and nine connecting edges (Figure 8E). These modules represent molecular complexes in the PPI networks and enhance the functional annotation accuracy and, thereby, increase reliability. Important subnets and genes of interest were selected (Table 6). The relationships between genes and the functional annotations of the modular genes warrant further investigation.
Figure 8: PPI of 274 potential genes. (A) PPI network of proteins (B) Module 1 (C) Module 2 (D) Module 3 (E) module 4 (F) Top 10 contiguous genes; height, number of gene connections. Red, up regulated; green, down regulated.
| Module | GO ID-Description | Count | P value | Genes in test set |
|---|---|---|---|---|
| Module 1 | 9611-response to wounding | 8/20 | 3.35E-07 | C1QB CCR1 C3AR1 F13A1 VSIG4 FMOD S100A9 C1QC |
| 2682-regulation of immune system process | 7/20 | 1.06E-06 | C1QB FAP C3AR1 VSIG4 THBS4 C1QC TLR2 | |
| 6950-response to stress | 9/20 | 3.15E-04 | C1QB CCR1 C3AR1 F13A1 VSIG4 FMOD S100A9 C1QC TLR2 | |
| Module 2 | 7155-Cell adhesion | 07/12 | 4.63E-07 | COMP COL16A1 COL14A1 COL12A1 COL21A1 COL8A1 CTGF |
| 22610-biological adhesion | 07/12 | 4.67E-07 | COMP COL16A1 COL14A1 COL12A1 COL21A1 COL8A1 CTGF | |
| 30198-extracellular matrix organization | 04/12 | 1.20E-06 | COL14A1 LUM COL12A1 CTGF | |
| Module 3 | 7275-multicellular organismal development | 06-Oct | 1.52E-03 | COL1A1 COL3A1 CTSK THY1 IGF1 ASN |
| 48856-anatomical structure development | 06-Oct | 8.08E-04 | COL1A1 COL3A1 CTSK THY1 IGF1 ASN | |
| 48519-negative regulation of biological process | 06-Oct | 1.7053-4 | COL1A1 COL3A1 HTRA1 THY1 IGF1 ASPN | |
| Module 4 | 7166-cell surface receptor linked signaling pathway | 03-Jun | 1.12E-02 | ITGAM STAT4 JAK2 |
| 10942-positive regulation of cell death | 02-Jun | 1.36E-02 | CD38 JAK2 | |
| 6928-cellular component movement | 02-Jun | 1.50E-02 | ITGAM JAK2 |
Table 6: Top 3 GO enrichment analysis for modules.
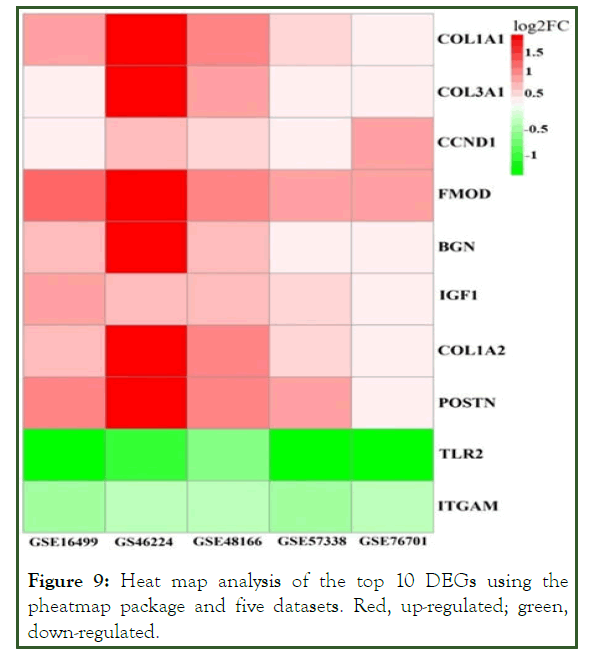
The higher the number of connecting edges, the greater the importance of the position in the network. These genes are potential targets of miRNAs in ICM. The top ten potential genes from the PPI network with the highest degree were subjected to heat map analysis (Figure 9).
Figure 9: Heat map analysis of the top 10 DEGs using the pheatmap package and five datasets. Red, up-regulated; green, down-regulated.
Discussion
We found 274 mRNAs and 91 miRNAs that were significantly differentially expressed in ICM compared with normal controls. Differentially expressed miRNAs were mapped to their target genes and the interaction of gene nodes, such as TLR2, F8, F13A1, F2R, CCND1, COL12A1, WNT9A, IGF1, COL1A1 and PLCE1 were constructed. Of these COL1A1, CCND1 and IGF1 were identified as high-level central nodes, which participate in several different cellular signaling pathways.
PPI analysis suggested that COL1A1 and IGF1 were the most influential factors, a finding supported by the miRNA-mRNA network analysis. We thus hypothesize that these master genes are part of a gene network that is altered in ICM.
Cardiac regeneration is characterized by collagen deposition in the extracellular matrix. However, excessive deposition of collagen may cause myocardial fibrosis. COL1A1 is a potential biomarker of HF progression. According to Huang et al., up-regulated mRNA levels of COL1A1, COL8A1 and COL3A1 were related to extracellular matrix (ECM), cell adhesion, collagen, and growth factor binding in the hearts of ICM patients. Up-regulation of CCND1, by contrast, is implicated in left ventricular remodeling. Alimadadi, et al. identified that CCND1 was involved in failure of heart and/or arrhythmia, contributing to HF related cardiac disorders. In study explored molecular mechanisms, Yang, et al. showed that the circCHFR/miR-370/FOXO1/CCND1/Cyclin D1 axis provides a profound understanding of the vascular smooth muscle proliferation and migration. Li, et al. showed that up-regulation of CCND1 is important in the development of ICM, which is consistent with our results. Concerning insulin-like growth factor 1 (IGF1), there is a relationship between the GH/IGF1 axis and the cardiovascular system. The GH/IGF1 axis regulates cardiac growth, myocardial contractility, and the influence of the vascular system. IGF1 is involved in the development of ICM via its atherosclerotic effect. IGF1 receptor activation reduced ischemia/reperfusion-induced apoptosis by activating the intracellular phosphoinositide 3-kinase/protein kinase B (PI3K/Akt) signaling pathway which promotes cell survival and protects organs against ischemia/reperfusion damage. Akt phosphorylation is a downstream target of PI3K and therefore, an important intermediary of cell survival. The activation of PI3K by IGF1 induces Akt phosphorylation and activation, which reduces Reactive Oxygen Species (ROS) levels and myocardial apoptosis, thereby improving left ventricular function. However, overexpression of cardiac PI3Kα or its upstream receptor IGF1 leads to myocardial enlargement and hypertrophy. Taken together, our findings suggest that COL1A1, CCND1 and IGF1 are essential in the development of ICM.
These genes and their signaling networks are involved in multiple physical and pathological processes including malaria and African trypanosomiasis, PI3K-Akt signaling, focal adhesion, protein digestion and absorption, complement and coagulation cascades, ECM-receptor interactions, and diabetic complications. Advanced glycation end products and their receptors (AGEs/RAGE), which are implicated in diabetic complications such as diabetic cardiomyopathy, were linked to ICM, implying a role in the pathogenesis of ICM. This finding is in agreement with a report that long-lived proteins such as collagen in the basement membrane are vulnerable to AGE cross-linking, leading to vascular hyper-permeability and stiffness, impaired ECM architecture, disrupted tissue homeostasis and myocardial remodeling. AGEs/RAGE may activate multiple intracellular signaling pathways including the protein kinase C (PKC), tyrosine phosphorylation of JAK-STAT, PI3K-Akt, MAPK (mitogen-activated protein kinase), and calcium signaling pathways. By activating the MAPK and PI3K-Akt signaling pathways, NAPDH increases the production of ROS, activates caspase-3, and degrades nuclear DNA, leading to apoptosis. Furthermore, at high ROS levels, AGEs/RAGE increases the transcription of NF-κB, TGF-β, Nox-1, and transcription factor activator protein-1(AP-1), further upregulating the expression of cytokines (e.g., TNF, IGF1, IFN-γ) and adhesion molecules (e.g., ICAM-1 and VCAM-1), disrupting cell function. Collectively, these findings show that AGEs/RAGE are crucial in the development of ICM.
miRNA-mRNA network analyses implicated multiple miRNAs in the regulation of potential genes and signaling pathways. Indeed, the down-regulation of miR-9-5p following ischemic injury may be related to ERMP1-mediated ER stress. miR-9-5p mediates hypoxic injury in cardiomyoblasts and its suppression prevents cardiac remodeling after acute myocardial infarction. Serum miR-9-5p is a potential diagnostic biomarker for carotid artery stenosis, and miR-9-5p expression is associated with vascular events. The serum miR-9 level was significantly higher in acute ischemic stroke patients. In an in vivo mouse model, an inhibitor of miR-9-5p ameliorated ischemic stroke. MiR-96 promoted myocardial hypertrophy including proliferation and elongation of cardiac muscle cells, resulting in cardiomegaly. Castellan, et al., reported that miR-96 regulates neovascularization following myocardial infarction and miR-regulated genes for cardiovascular disease. Moreover, miR-96 is a putative therapeutic target in myocardial infarction. Ding, et al. showed that the serum miR-96-5p level in patients with acute myocardial infarction associated with coronary artery disease was lower than in healthy controls, implicating miR-96-5p in acute myocardial infarction.
We analyzed publicly available gene expression datasets of ischemic cardiomyopathy to identify differentially expressed miRNAs and construct a miRNA-mRNA-protein regulatory network. However, evaluating the roles of miRNAs in ICM using existing tools and databases is problematic; therefore, the results are speculative and need to be confirmed.
Conclusion
We evaluated the miRNA-mRNA expression profiles and related signaling pathways in ICM. Totals of 274 mRNAs and 91 miRNAs were significantly differentially expressed in ICM. Some DEGs (e.g., COL1A1, IGF1, and CCND1) were involved in different signaling pathways. MiR-9-5p regulates the expression regulation of genes implicated in ICM progression. Further in vitro studies are needed to confirm the function of the potential genes and their regulatory networks and to identify potential therapeutic targets for ICM.
Conflict of Interest
The authors declare that they have no conflict of interests.
Onsent for Publication
Not applicable.
Availability of Data and Materials
All relevant data supporting the findings of this study are available within the article.
Funding
The study was supported by the National Natural Science Foundation of China (grant no. 81660241, 81860205).
Ethics Statement
GEO belong to public datasets. The contributors to the database have obtained ethical approval. Thus, our research has no ethical issues.
Authors’ Contributions
PSD analyzed and interpreted data, and drafted the manuscript. JHP validated data and results. TLT, and CMTT helped in data collection. SLP designed the study and revised the manuscript. All authors read and approved the final manuscript.
References
- Felker GM, Shaw LK, O'Connor CM. A standardized definition of ischemic cardiomyopathy for use in clinical research. J Am Coll Cardiol. 2002;39(2):210-218.
[Crossref] [Google Scholar] [PubMed]
- Cabac-Pogorevici I, Muk B, Rustamova Y, Kalogeropoulos A, Tzeis S, Vardas P. Ischaemic cardiomyopathy. Pathophysiological insights, diagnostic management and the roles of revascularisation and device treatment. Gaps and dilemmas in the era of advanced technology. Eur J Heart Fail. 2020;22(5):789-799.
[Crossref] [Google Scholar] [PubMed]
- Briceno N, Schuster A, Lumley M, Perera D. Ischaemic cardiomyopathy: Pathophysiology, assessment and the role of revascularisation. Heart. 2016;102(5):397-406.
[Crossref] [Google Scholar] [PubMed]
- Nehra S, Gumina RJ, Bansal SS. Immune cell dilemma in ischemic cardiomyopathy: To heal or not to heal. Curr Opin Physiol. 2021;19:39-46.
[Crossref] [Google Scholar] [PubMed]
- Frank A, Bonney M, Bonney S, Weitzel L, Koeppen M, Eckle T. Myocardial ischemia reperfusion injury: From basic science to clinical bedside. Semin Cardiothorac Vasc Anesth. 2012;16(3):123-132.
[Crossref] [Google Scholar] [PubMed]
- Broughton KM, Wang BJ, Firouzi F, Khalafalla F, Dimmeler S, Fernandez-Aviles F, et al. Mechanisms of cardiac repair and regeneration. Circ Res. 2018;122(8):1151-1163.
[Crossref] [Google Scholar] [PubMed]
- Kruska M, El-Battrawy I, Behnes M, Borggrefe M, Akin I. Biomarkers in cardiomyopathies and prediction of sudden cardiac death. Curr Pharm Biotechnol. 2017;18(6):472-481.
[Crossref] [Google Scholar] [PubMed]
- Lu YW, Wang DZ. Non-coding RNA in ischemic and non-ischemic cardiomyopathy. Curr Cardiol Rep. 2018;20(11):115.
[Crossref] [Google Scholar] [PubMed]
- Nair N, Gongora E. MicroRNAs as therapeutic targets in cardiomyopathies: Myth or reality? Biomol Concepts. 2014;5:439-448.
[Crossref] [Google Scholar] [PubMed]
- Satoh M, Minami Y, Takahashi Y, Tabuchi T, Nakamura M. Expression of microRNA-208 is associated with adverse clinical outcomes in human dilated cardiomyopathy. J Card Fail. 2010;16(5):406-410.
[Crossref] [Google Scholar] [PubMed]
- Yang KC, Yamada KA, Patel AY, Topkara VK, George I, Cheema FH, et al. Deep RNA sequencing reveals dynamic regulation of myocardial noncoding RNAs in failing human heart and remodeling with mechanical circulatory support. Circulation. 2014;129:1009-1021.
[Crossref] [Google Scholar] [PubMed]
- Liu Y, Morley M, Brandimarto J, Hannenhalli S, Hu Y, Ashley EA, T, et al. RNA seq identifies novel myocardial gene expression signatures of heart failure. Genomics. 2015;105(2):83-89.
[Crossref] [Google Scholar] [PubMed]
- Kim EH, Galchev VI, Kim JY, Misek SA, Stevenson TK, Campbell MD, et al. Differential protein expression and basal lamina remodeling in human heart failure. Proteomics Clin Appl. 2016;10(5):585-596.
[Crossref] [Google Scholar] [PubMed]
- Ritchie ME, Phipson B, Wu D, Hu Y, Law CW, Shi W, et al. Limma powers differential expression analyses for rna-sequencing and microarray studies. Nucleic Acids Res. 2015;43(7):e47.
[Crossref] [Google Scholar] [PubMed]
- Kolde R, Laur S, Adler P, Vilo J. Robust rank aggregation for gene list integration and meta-analysis. Bioinformatics. 2012;28(4):573-580.
[Crossref] [Google Scholar] [PubMed]
- Yu G, Wang LG, Han Y, He QY. ClusterProfiler: An R package for comparing biological themes among gene clusters. Omi A J Integr Biol. 2012;16(5):284-287.
[Crossref] [Google Scholar] [PubMed]
- Kohl M, Wiese S, Warscheid B. Cytoscape: software for visualization and analysis of biological networks. Methods Mol Biol. 2011;696:291-303.
[Crossref] [Google Scholar] [PubMed]
- Szklarczyk D, Franceschini A, Wyder S, Forslund K, Heller D, Huerta-Cepas J, et al. STRING v10: Protein-protein interaction networks, integrated over the tree of life. Nucleic Acids Res. 2015;43:D447-52.
[Crossref] [Google Scholar] [PubMed]
- Bader GD, Hogue CW. An automated method for finding molecular complexes in large protein interaction networks. BMC Bioinformatics. 2003;4:2.
[Crossref] [Google Scholar] [PubMed]
- Maere S, Heymans K, Kuiper M. BiNGO: A cytoscape plugin to assess overrepresentation of gene ontology categories in biological networks. Bioinformatics. 2005;21(16):3448-9.
[Crossref] [Google Scholar] [PubMed]
- Tsoutsman T, Wang X, Garchow K, Riser B, Twigg S, Semsarian C. CCN2 plays a key role in extracellular matrix gene expression in severe hypertrophic cardiomyopathy and heart failure. J Mol Cell Cardiol. 2013;62:164-78.
[Crossref] [Google Scholar] [PubMed]
- Zhao J, Lv T, Quan J, Zhao W, Song J, Li Z, et al. Identification of target genes in cardiomyopathy with fibrosis and cardiac remodeling. J Biomed Sci. 2018;25(1):63.
[Crossref] [Google Scholar] [PubMed]
Citation: Dinh PS, Peng JH, Tran CMT, Tran TL, Pan SL (2023) Construction of MiRNAS and Gene Expression Profiles Associated With Ischemic Cardiomyopathy: Bioinformatics Analysis. Glob J Agric Health Sci. 12:162.
Copyright: © 2023 Dinh PS, et al. This is an open-access article distributed under the terms of the Creative Commons Attribution License, which permits unrestricted use, distribution, and reproduction in any medium, provided the original author and source are credited.
