Indexed In
- Open J Gate
- Genamics JournalSeek
- JournalTOCs
- Ulrich's Periodicals Directory
- RefSeek
- Hamdard University
- EBSCO A-Z
- OCLC- WorldCat
- Publons
- Geneva Foundation for Medical Education and Research
- Euro Pub
- Google Scholar
Useful Links
Share This Page
Journal Flyer

Open Access Journals
- Agri and Aquaculture
- Biochemistry
- Bioinformatics & Systems Biology
- Business & Management
- Chemistry
- Clinical Sciences
- Engineering
- Food & Nutrition
- General Science
- Genetics & Molecular Biology
- Immunology & Microbiology
- Medical Sciences
- Neuroscience & Psychology
- Nursing & Health Care
- Pharmaceutical Sciences
Research Article - (2021) Volume 0, Issue 0
Comparison RNA Expression Level of HER2 (By QRT-PCR) With Protein Expression Level (Immunohistochemistry) and Investigation HER 2 Expression Level with Clinicopathological Features
Samira Shabani, Tayebeh Majidi Zadeh, Ameneh Tavakoli Koudehi and Frouzandeh Mahjoubi*Received: 16-Jul-2021 Published: 06-Aug-2021, DOI: 10.35248/2157-2518.21.s18.003
Abstract
Background: Evaluation HER2 (human epidermal growth factor receptor 2) status is considered as a standard practice in breast cancer clinical management. There are different methods for evaluation HER2 status, but currently the routine method for assessment of HER2 status is Immunohistochemistry (IHC) .The aim of the this study was to compare the results obtained by IHC and Quantitative Real Time PCR methods in determination of HER2 status to specify whether QRT- PCR can use as supplementary method in breast cancer or not.
Methods: In this regard, 48 fresh tissues from patients with breast tumor were studied. IHC, qRT- PCR technique was done in every speciman. IHC was done with DAKO HercepTest and QRT- PCR method was performed with TaqMan probes and primers in lightcyclerTMsystem (Corbett Real Time Thermal cycler).
Results: No Correlations was seen between relative HER2 mRNA expression and IHC HER2 status. Furthermore, the relation between HER2 expression level and patient's age, tumor size, lymph node involvement and tumor grade was not significant.
Conclusion: The present results show that the relative mRNA levels of HER2 by using q RT-PCR cannot discriminate between HER2 IHC positive from negative
Keywords
Breast cancer; Human epidermal; Growth factor receptor 2; Real time RT PCR
Introduction
The type I receptor tyrosine kinase which is encoded by epidermal growth factor receptor 2 (HER2) is an oncogene stimulates proliferation, migration, and invasion in breast cancer [1].
HER2 amplification and the overexpression has been observed in 15%–20% of all breast cancers [2]. Since HER2 status is considered as significant factor in clinical management of patients especially with the development of the new therapeutic agent trastuzumab,this gene amplification has attracted research attention [3]. There are different tests for assessment HER2 status, but each of these test has some limitation which leads to some concern in the clinical decision-making setting. In this regard in 2007, HER2 testing guidelines were developed by ASCO (the American Society of Clinical Oncology) and CAP (the College of American Pathologists) to reduce inaccuracy [4].
The most routine method for assessment HER2 status is Immunohistochemistry (IHC), which investigate the expression of the HER2 protein in cell membranes [5]. The intrinsic, semiquantitative nature of IHC besides to its partially subjective interpretation reduces this method accuracy [6,7].
Regarding to the QRT- PCR features such as molecular basis, sensitivity, accuracy and its independency to specific reagents like antibodies, it seems this method can be a reliable test for accurate measurement of HER2 status [8].
According to above subject, the aim of the this study was to compare the results obtained by IHC and Quantitative Real Time PCR methods in determination of HER2 status to specify whether QRT- PCR can use as supplementary method in breast cancer or not.
Materials and Methods
Patients and samples
This research was approved by the National Institute for Genetic Engineering and Biotechnology (NIGEB). Written Consent form were taken from all patients Fourty eight patients breast cancer with admitted to Khatam Hospital(a referral governmental hospital) in Tehran were enrolled in this study and underwent surgery (Table 1). Tumor and adjacent normal tissues were prospectively obtained during surgery. Then the tissue specimen was saved at -70°C for RNA extraction. All patient pathologic information was gained from Pathology Department. CRC tissues staging was carried out as stated by the International Union against Cancer (UICC) which is based on (AJCC-TNM) classification [9].
| Types of primers | Sequence | ||
|---|---|---|---|
| her 2 forward primer | 5′-GGT CCT GGA AGC CAC AAG G-3′ |
||
| her 2 reverse primer | 5′ -GGT TTT CCC ACC ACA TCC TCT -3′ |
||
| probe | 5′-FAM-AAC ACA ACA CAT CCC CCT CCT TGA CTA TCA TCA A-TAMARA3′ |
||
| b actin forward primer | 5 GAGACCTTCAACACCCCAG CC- 3 ́ |
||
| b actin reverse primer | 5 AGACGCAGGATGGCATGGG- CC-3 |
||
Table 1: Primers and probe which is used in QRT-PCR.
RNA isolation, cDNA and QRT-PCR
RNA extraction and cDNA synthesis was carried out by TriPure Isolation Reagent (Roche applied sciences) and RevertAid First Strand cDNA Synthesis Kit (Thermo Fisher Scientific, Germany) respectively according to the manufacturer’s protocol.
The expression level of HER 2, was measured in each sample by QRT-PCR amplification performed with TaqMan probes and primers in lightcyclerTMsystem (Corbett Real Time Thermal cycler). Bactin was used as the internal control gene [10-13]. All measurements were performed in triplicate. The 10 μL reaction mixture contained 2 × TaqMan® Fast Start Master Mix, 0.5 μL reverse primer, 0.5 μL forward primers, 0.5 μL probe and 2 μL of cDNA. The PCR program was as follows: an initial denaturation step at 95°C for 60 seconds followed by an amplification program (denaturation at 95°C for 10 seconds and anneal¬ing and extension at 58°C for 35 seconds) The 5′- and 3′-end nucleotides of the probe were labeled with the reporter FAM (6-carboxy-fluorescein) and the quencher dye TAMRA (6- car¬boxy-tetramethylrhodamine), respectively. The primers and probes used in this analysis are presented in Table 1.
Determination HER2 status in tumor specimens
HER2 status for tumor samples was determined by IHC after surgical removal. IHC was done by using DAKO HercepTest. IHC outcomes were divided into 4 groups, accordingly to the four-tier DAKO standard classification (0, 1+, 2+, and 3+).
Statistical analysis
The raw data from Real time RT-PCR for each gene analyzed with Linreg software Subsequently, the expression ratio results (sample group difference to control group) for significance was analyzed with REST software.Statistical analysis was performed using the SPSS software V22.0 (SPSS, Inc., Chicago, IL). The normality assumption was checked by Kolmogorov-Smirnov test. And Differences between groups were analyzed by One-Way Analysis of Variance (ANOVA) and independent sample T tests. A P value less than 0.05 were considered statistically significant. Correlations between HER2 expression level and IHC HER2 status were analysed by Spearman's rank correlation coefficient. To determine cut –off values, Receiver Operating Characteristics (ROC) curve analysis was performed for IHC and qRT-PCR.
Results
Patients clinical and pathological data
In total 48 patients with breast cancer were involved in this study. The average the patient ages were 47.4(31-72) years. Tumor grade I, grade II, and grade III were identified by pathology check in 26%, 58%, 16% and 20% of the cases, respectively. All patients had tumor size smaller than 5 cm. Seventy eight (78%) of the patients had lymph node metastasis as listed in Table 2.
| Characteristics | No.of patients (N %) | |
|---|---|---|
| Age (mean) | 47.4 | (31-72) |
| Cancer grade | Grade I | 26 |
| Grade II | 58 | |
| Grade III | 16 | |
| Lymph node status | positive | 78 |
| negative | 22 | |
| Tumor size | ≤ 5 | 100 |
| HER 2 IHC | positive | 26 |
| negative | 74 |
Table 2: Patient characteristics.
Association between HER2 expression level and clinico-patholgical characteristics
In the current research the feasible relation between her2 expression level and clinicopathologicl characteristics were studied. Based on the results, no significant relation was observed between her 2 expression level and patient's age, tumor size, lymph node involvement and tumor grade. Although there was no significant association between relative her2 expression and tumor grades, interestingly there is an inverse relationship between tumor grade and HER2 expression, So that the expression of HER2 gene is reduced with increasing tumor grade. The summary of the data are summarized in Table 3.
| Expression of HER2 | |
|---|---|
| Age | NS (P>0.05) |
| Tumor size | NS (P>0.05) |
| Lymph node involvement | NS (P>0.05) |
| Histological grade | NS (P>0.05) |
Table 3: The correlation between her 2 expression level with clinic pathological characteristics of patients (NS: no significantly important, s: significantly important).
Correlations between relative HER2 mRNA expression and IHC HER2 status were calculated
Relative her2 mRNA expression levels were measured in samples by qRT-PCR. In this regard, the changes in her 2 gene expression level in tumoral tissues were according to b actin (internal control gene) expression level were calculated according to the ΔCt method (Comparative Cycle Threshold (Ct)) using the following formula:
ΔCt: Target gene Ct-control gene Ct
No correlation was seen between ΔCt data and IHC HER2 status (positive or negative). Then, the association between ΔCt data and IHC HER2 score (0, +1, +2, +3) was analyzed. The Pvalue of the differences between the groups according to One- Way ANOVA was 0.437 and statistically was not significant.
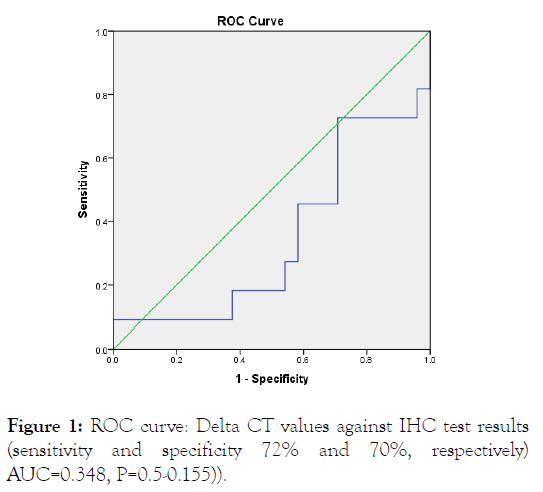
ROC curve analysis was performed in order to determine the optimal diagnostic cut-off value. For ROC investigation, patients' information and the relative expression levels of HER2 which studied by means of Real Time RT-PCR were used (HER2 IHC positive and negative) as shown in Figure 1.

Figure 1: ROC curve: Delta CT values against IHC test results (sensitivity and specificity 72% and 70%, respectively) AUC=0.348, P=0.5-0.155)).
ROC curves gotten by samples had sensitivity and specificity of 72% and 70%, respectively) AUC=0.348, p=0.5-0.155). This curve and the corresponding AUC shows that the relative mRNA levels of HER2 by using q RT-PCR cannot discriminate between HER2 IHC positive from negative.
Discussion
Overexpression of human epidermal growth factor 2 gene (HER2) occurs in 15%-20% of breast patients. Up to 30% of HER2 amplification have described in patients with breast cancer [14-16]. It also has been stated that amplification of HER2 is related to clinicopathological characteristics such as tumor size, lymph nodes metastases, and tumor grade [17]. Anti- HER2 therapy with the humanized monoclonal antibody trastuzumab is one of the effective in breast cancer therapy which developed overall survival up to 87% in HER2 positive patients with stage I,II,III [18]. Therefore, breast cancer medical decision is based on precise valuation of HER2 status, which can be through DNA, mRNA, or protein level. One of the common method for assessment of HER2 status is IHC analyse [18,19].
This investigation purpose was searching the usefulness of q RT PCR for assessing HER2 status at RNA level in patients with breast cancer, and to match the outcomes with the parallel results found in IHC at protein level. In this investigation, we assessed the possibility of q RT PCR to detect HER2 status in fresh tissue of breast cancers. We noticed 72% sensitivity and 70%, specificity between the results of real-time PCR and IHC, as a result the relative mRNA levels of HER2 by using q RT-PCR cannot discriminate between HER2 IHC positive from negative. Several studies have used RT-qPCR for the evaluating of HER2 mRNA expression and the results are conflicting. Bergqvist et al found RNA expression profiles by q RT-PCR were slightly higher sensitivity compared to IHC/ISH in fresh-frozen breast cancer tissue [20] and Cuadros et al. stated that quantifying mRNA expression is not a appropriate substitute to the regular IHC/FISH approaches [21]. An interpretation for these conflicting results is although q PCR is a cost-efficient and quickly technique and many specimen can be evaluated simultaneously .However, RNA is at risk to fragmentation and degradation, and the method of preparing the cDNA, along with tumor dilution of normal cells, can cause different outputs. Additionally, we observed that overexpression of HER2 is upper in initial grades of breast tumor than in more progressive grades, suggesting that variations in HER2 expression cannot result in development of breast malignancy from a benign to a more malignant phenotype.
Conclusion
The present results show that the relative mRNA levels of HER2 by using q RT-PCR cannot discriminate between HER2 IHC positive from negative. However, as a result of the restricted level of this research, it will be necessary to approve our finding in a greater reserch which can provide evidence for the response to anti-HER2 therapy
REFERENCES
- Perez EA, Cortes J, Angulo AMG, Bartlett JMS. HER2 testing: currentstatus and future directions. Cancer Treat Rev. 2014;40(2):276-284.
- Olsson H, Agenta J, Birgitta H, Cecilia G. Methods for evaluatingHER2 status in breast cancer: comparison of IHC, FISH, and real-time PCR analysis of formalin-fixed paraffin-embedded tissue. PatholLab Med Int. 2013;2013(5):31-37.
- Wolff AC, Hammond MEH, Hicks DG, Dowsett M, Mcshane LM,Allison KH, et al. Recommendations for human epidermal growthfactor receptor 2 testing in breast cancer: American Society of ClinicalOncology/College of American Pathologists clinical practice guidelineupdate. J Clin Oncol. 2013;31(31):3997-4013.
- Hammond MEH, Hayes DF, Dowsett M, Allred DC, Hagerty KL,Badve S, et al. American Society of Clinical Oncology/College of
- American Pathologists guideline recommendations forimmunohistochemical testing of estrogen and progesterone receptorsin breast cancer. J Clin Oncol. 2010;28(16):2784-2795.
- Press MF, Salmon DJ, Flom KJ, Park J, Zhou JY, Bernstein L.Evaluation of HER-2/neu gene amplification and overexpression:comparison of frequently used assay methods in a molecularlycharacterized cohort of breast cancer specimens. J Clin Oncol.2002;20(14):3095-3105.
- Krop IE, Winer EP. Ten years of HER2-directed therapy: still questions after all these years. Breast Cancer Res Treat. 2009;113(2):207-209.
- Dowsett M, Allred C, Knox J, Quinn E, Salter J, Wale C, et al.,Relationship between quantitative estrogen and progesterone receptorexpression and human epidermal growth factor receptor 2 (HER-2)status with recurrence in the Arimidex, Tamoxifen, Alone or inCombination trial. J Clin Oncol. 2008;26(7):1059-1065.
- Gospodarowicz MK, Wittekind C. TNM classification of malignant tumours. John Wiley & Sons. 2011;4(3)336.
- Garuti A, Rocco I, Cirmena G, Chiramondia M, Baccini, CalabreseM, et al. Quantitative Real Time PCR assessment of hormonalreceptors and HER2 status on fine-needle aspiration pre-operatoryspecimens from a prospectively accrued cohort of women with suspectbreast malignant lesions. Gyn Oncol. 2014;132(2):389-396.
- Motalebzadeh J, Shabani S, Rezayathi S, Shakournia N, Mirazaei R,Mahjoubi B, et al. Prognostic Value of FBXO39 and ETS-1 but notBMI-1 in Iranian Colorectal Cancer Patients. Asian Pacific J CancerPrev. 2018;19(5):1357-1362.
- Shabani S, Mahjoubi F, Mahjoubi B, Mirzaee R. Investigation ofhTERT Expression Level and its Relation with ClinicopathologicalFeatures and Resistance to Chemotherapy in Colorectal CancerPatients. J Mol Bio Diag. 2014;5(3):1.
- Koudehi AT, Mahjoubi B, Mirzaei R, Shabani S, Mahjoubi F et al.AKAP4, SPAG9 and NY-ESO-1 in Iranian Colorectal Cancer Patientsas Probable Diagnostic and Prognostic Biomarkers. Asian Pacific JCancer Prev. 2018;19(2):463.
- Siyasi M, Mahjoubi F, Mahjoubi B, Shabani S. Study of VCAM-1Gene Expression in Normal and Tumoral Tissues in Patients withColorectal Cancer. J Biotechnol Biomed Sci. 2017;1(1):19.
- Slamon DJ, Clark JM, Wong SG, Levin WJ, Ulrich A, McguireWL. Human breast cancer: correlation of relapse and survival with amplification of the HER-2/neu oncogene. Science, 1987;235(4785):177-182.
- Slamon DJ, Godolphin W, Jones LA, Holt JA, Wong SG, et al., Studies of the HER-2/neu proto-oncogene in human breast and ovarian cancer. Science. 1989;244(4905):707-712.
- Revillion F, Bonneterre J, Peyrat JP. ERBB2 oncogene in human breastcancer and its clinical significance. European J Cancer. 1998;34(6):791-808.
- Yarden Y, Sliwkowski MX, Untangling the ErbB signalling network.Nature Rev Mol Cell Biol. 2001;2(2):127.
- Nahta R, Esteva FJ. Herceptin: mechanisms of action and resistance.Cancer Lett. 2006;232(2):123-138.
- Dowsett M, Houghton J, Iden C, Salter J, Farndon J, Hern RA, et al.,Benefit from adjuvant tamoxifen therapy in primary breast cancerpatients according oestrogen receptor, progesterone receptor, EGFreceptor and HER2 status. Annals Oncol. 2006;17(5):818-826.
- Bergqvist J, Ohd JF, Smeds J, Klarr S, Isola J, Nordgren H, et al,Quantitative real-time PCR analysis and microarray-based RNAexpression of HER2 in relation to outcome. Annals oncol. 2007;18(5):845-850.
Citation: Shabani S, Majidi Zadeh T, Tavakoli Koudehi A, Mahjoubi F (2021) Comparison RNA Expression Level of HER 2 (By QRT-PCR) with Protein Expression Level (Immunohistochemistry) and Investigation HER2 Expression Level with Clinicopathological Features. J Carcinog Mutagen. S18:003.
Copyright: © 2021 Shabani S, et al. This is an open-access article distributed under the terms of the Creative Commons Attribution License, which permits unrestricted use, distribution, and reproduction in any medium, provided the original author and source are credited.


