Indexed In
- Open J Gate
- Academic Keys
- RefSeek
- Hamdard University
- EBSCO A-Z
- OCLC- WorldCat
- Publons
- Euro Pub
- Google Scholar
- SHERPA ROMEO
Useful Links
Share This Page
Journal Flyer

Open Access Journals
- Agri and Aquaculture
- Biochemistry
- Bioinformatics & Systems Biology
- Business & Management
- Chemistry
- Clinical Sciences
- Engineering
- Food & Nutrition
- General Science
- Genetics & Molecular Biology
- Immunology & Microbiology
- Medical Sciences
- Neuroscience & Psychology
- Nursing & Health Care
- Pharmaceutical Sciences
Research Article - (2024) Volume 12, Issue 5
Classic versus Deep Learning Computer Vision Methods CT Scan Lung Cancer Detection: Meta-Analysis
Benson A. Babu*Received: 05-May-2020, Manuscript No. JVMS-24-4120; Editor assigned: 08-May-2020, Pre QC No. JVMS-24-4120 (PQ); Reviewed: 22-May-2020, QC No. JVMS-24-4120; Revised: 15-Jul-2024, Manuscript No. JVMS-24-4120 (R); Published: 12-Aug-2024, DOI: 10.35248/2329-6925.24.12.567
Abstract
Lung cancer is the number one cause of cancer-related deaths in the United States and worldwide. It also has this highest burden of cost globally. The current state of the healthcare system and physicians alike are under considerable financial and operative pressure; thus at high risk for burn out. Computer-aided diagnosis systems can assist physicians in the medical decision-making process during patient care, as well as improving hospital operative efficiency while reducing burn out.
Methods: A total of 638 studies were extracted. 62 (9.7%) deep learning and 83 (13%) classic learning methods out of the 638 total cross-sectional studies were selected based on the study eligibility protocol. I2 measure of consistency/ heterogeneity was applied to the results of random-effects meta-analysis. Based on this selected model studies, the mean accuracy for deep learning is 86% whereas for classical methods is 90%. The results we received are 1) deep learning is not a single method, it is a variety of modern methods, thus we have a high heterogeneity of accuracy (I squared=89%); a good level of accuracy: 0.862, 95% CI (0.844-0.883), 2) for classic methods, it is a variety of methods, thus have a high heterogeneity of accuracy (I squared=85%); a good level of accuracy: 0.897, 95% CL (0.897-0.923). The funnel plot method for identifying publication bias does not show a significant publication bias among these studies.
Conclusion: Meta-analytic statistical methods may help provide statistical power to select the computer vision method that performs the best. The mean accuracy for deep learning is 86% whereas for classical methods is 90% this difference is attributed to high heterogeneity. Future studies can be performed by extending the number of studies; using a broader range of performance measures. Meta-analytic methods can guide in deciding which models to take to production and define the direction of future innovative research.
Keywords
Lung cancer; Lung nodule; Lung tumor; Malignancy; Metastasis; Computer-aided detection; Pulmonary nodule; Pulmonary adenocarcinoma; CADe; CADx; CT; Convolutional Neural Networks (CNN); 3D residual CNN; Deep Belief Networks (DBN); Stack Auto-Encoders (SAE); Linear regression; Logistic regression; Decision trees; Naive Bayes; Reinforcement learning; Ensemble learning; Support Vector Machines (SVM); Linear Discriminant Analysis (LDA); Random forests; Artificial neural networks; Adaptive boosting; XGboost; Bayesian classifier; Knearest neighbor
Introduction
Lung cancer is the number one cause of cancer-related deaths in the United States and worldwide. Furthermore, lung cancer has the highest public burden of cost worldwide. Furthermore, lung cancer has the highest public burden of cost worldwide. Healthcare cost to medicare beneficiaries was analyzed. The highest costs are related to surgery an estimated $30,000 over 15 years. Similarly, patients receiving chemotherapy and radiation therapy experienced $4000-$8000 per month cost; with an average life expectancy of 14 months since the time of diagnosis. Europe’s incidence of lung cancer with estimates is 60 per 100,000 inhabitants. Its costs of healthcare and management for the patient post-intervention are estimated to be 17000 euros [1].
The National Lung Screening Trial (NLST) found that examination with Low-Dose Computed Tomography (LDCT) instead of the standard chest X-ray, in a high-risk population, lead to a 20% reduction in mortality rate. Additionally, the detection rate of lung cancer screening with low-dose CT is 2.6 to tenfold higher than that with chest radiography. The key to reducing lung-cancer related deaths is early diagnosis and this relies on fast and accurate detection of lung nodules and careful examination of chest CT scans to determine malignancy: A process that requires considerable time and effort on behalf of radiologists and physicians. Computer-aided diagnosis can assist physicians with this complex oncologic decision-making process [2].
Systematic reviews, meta-analysis, thus statistical methods can help select the computer vision method that performs the best. These statistical methods can also help in deciding which models to take to production. We conducted a meta-analysis to compare the classic versus deep learning computer vision methods performance.
Materials and Methods
This meta-analysis is registered in PROSPERO International prospective register of systematic reviews. This study follows the PICO framework, problem: Lung cancer, intervention: Machine and deep learning, comparison: Deep learning methods vs. classic computer vision model performance, outcomes: Accuracy measures the proportion of data that were classified correctly (Figure 1) [3].
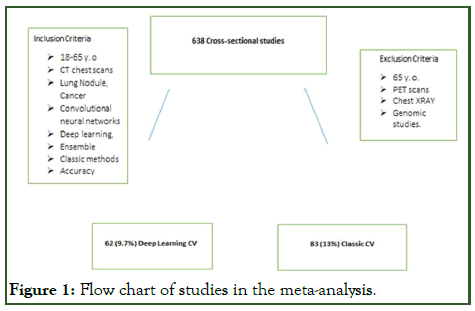
Figure 1: Flow chart of studies in the meta-analysis.
Eligibility criteria
The publication articles considered under selection ranged from the years 2008 to 2020. The study inclusion criteria: 18-65 years old, CT chest scans, lung nodule, lung cancer, convolutional neural networks, deep learning, ensemble and classic methods. Exclusion criteria: Greater than 65 years old, PET hybrid scans, chest radiographs, genomic studies [4].
Search term strategies used are 1) Boolean logic. Use connecting words like "AND," "OR" and "NOT" in various combinations to expand or narrow down your search results: AND between terms returns only records containing all of the search terms, OR between terms returns all records with any of the search terms and NOT between search terms returns only records that contain the first term and not the second. 2) Fuzzy logic. We used search terms like "lung cancer" near "deep learning" or "lung cancer" within 5 words of "deep learning" to search for particular articles. 3) Truncate terms. We placed an asterisk (*) at the end of a string of characters to search for all terms that being with that string. For example: Detect* will find all terms that begin with d-e-t-e-c-t-; e.g., detect, detector, detection, etc. We also used a wildcard. Use a “?” to replace a letter or denote an extra letter where spelling or word variation is possible. For example, behavior? will find behavior or behavior [5].
Databases
Databases used: Embase, LUNA, LUNA 16, Lung Image Consortium Database (LIDC), LIDC-IDRI, LIDC-IDR, Kaggle data science, Bowl, Kaggle data science bowl 2017, US National Lung Screening Trial (NLST), COPDGene, LungX, ANODE06, MBAN, NSCLC, DBLP, English lung cancer dataset, Japanese Society of Radiological Technology (JSRT) Dataset, SPIELUNGx, Google Scholar, TCIA, SPIE-AAPM, IEEE Xplore, SPIE-AAPM-LungX data, Tianchi medical AI challenge, COCO dataset, National lung screening trial, MAASTRO clinic in Maastricht, ELCAP, NBIA, Alibaba tianchi lung cancer detection competition dataset, MDCT, The Cancer Imaging Archive (TCIA), ACRIN 6684.
Study selection
A total of 638 published articles in the English language were extracted from the databases. Two experienced physicians of over 10 years were the independently blinded reviewers. They selected 62 (9.7%) deep learning and 83 (13%) classic learning models out of the 638 total cross-sectional studies based on the study eligibility criteria. Furthermore, a third independent reviewer broke ties in disagreements of any article selection between the two independent physician reviewers [6].
Summary measures
As a summary measure, we took a risk ratio comparing deep learning methods and classic computer vision methods in the outcomes of lung cancer detection.
Results
Synthesis of results
I2 measure of consistency/heterogeneity was applied to the results of random-effects meta-analysis (Figures 2 and 3) [7].
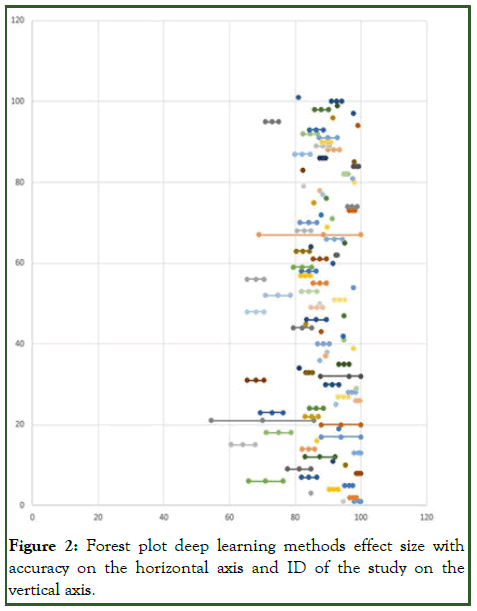
Figure 2: Forest plot deep learning methods effect size with accuracy on the horizontal axis and ID of the study on the vertical axis.
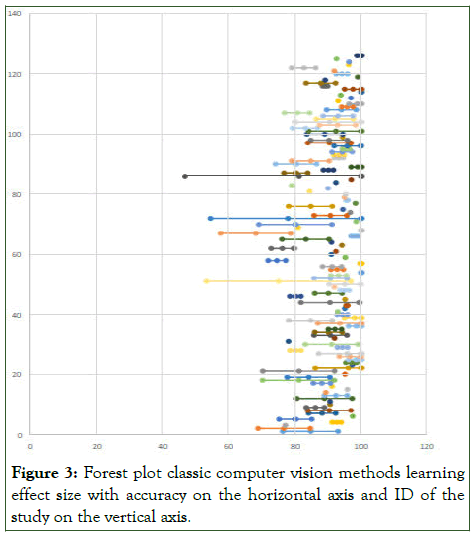
Figure 3: Forest plot classic computer vision methods learning effect size with accuracy on the horizontal axis and ID of the study on the vertical axis.
Present results of each meta-analysis done for deep learning and classic methods respectively, including confidence intervals and measures of consistency [8]. Weighted mean accuracy (back from risk ratio) for deep learning methods according to random-effect meta-analysis: 86.2%. 95% confidence interval: (84.3%; 88.2%). I2 measure of heterogeneity=89.3% means high heterogeneity (>75%). Weighted mean accuracy (back from risk ratio) for classic methods according to random-effect meta-analysis: 90%. 95% confidence interval: (89.7%; 92.3%). I2 measure of heterogeneity=84.5% means high heterogeneity (>75%) (Figure 4) [9].
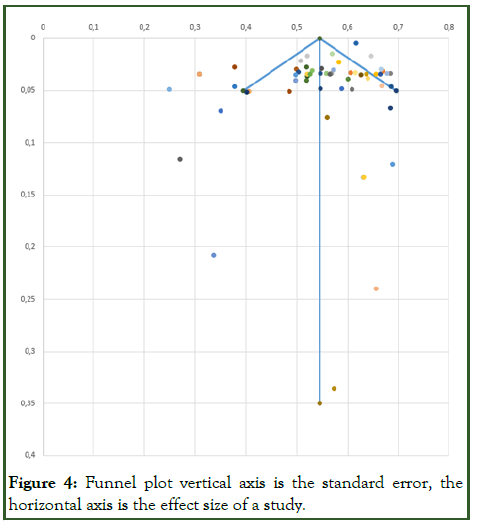
Figure 4: Funnel plot vertical axis is the standard error, the horizontal axis is the effect size of a study.
Risk of bias across studies
The funnel plot was plotted with effect size on the X-axis and the standard error on the Y-axis. Large studies appear toward the top of the graph and generally cluster around the mean effect size. Smaller studies appear toward the bottom of the graph and since smaller studies have more sampling error variation in effect sizes; they tend to be spread across a broad range of values. This pattern resembles a funnel pattern.
In the absence of publication bias, the studies will be distributed symmetrically about the mean effect size, since the sampling error is random. In the presence of publication bias, the studies are expected to follow the model, with symmetry at the top, a few studies missing in the middle and more studies missing near the bottom. No significant asymmetry is observed on the funnel plot diagram [10].
Discussion
Computer vision, machine learning model performance validation using statistical methods have been known and used for some time. Meta-analysis represents the highest level of research evidence by comparison to other research study designs. Similarly, meta-analysis provides an increased statistical power, precision and validation to detect an effect with each machine learning model. Furthermore, it reduces subjectivity in the deep convolution network model study comparisons. Heterogeneity in effects among several studies and its summary measure provides valuable knowledge insights, gaps and any directions in future research.
Based on selected model studies, the mean accuracy for deep learning is 86% whereas for classical methods is 90%. This result was unexpected, as individual deep learning studies such as ensemble CNN methods are known to perform well in detecting lung cancer on CT chest imaging. The results are attributed to the high heterogeneity in this research design [11].
Sources of high heterogeneity include both methodologic and clinical. Methodologic heterogeneity is the risk of reporting bias related to incomplete retrieval of identified research. For example, only 62 and 83 studies out of 638 contained data for deep learning and classic computer vision methods including accuracy and sample size. Limiting factors that need refinement to improve further studies: 1) To extend the number of studies that provide data on sample size, 2) Include not only for accuracy but also for sensitivity, recall, AUC and other performance metrics, 3) Test other effect size metrics.
Clinical sources of heterogeneity are, the patients smokers or non-smokers status, current or prior history of malignancy are not identified in this study population. Lastly, training models for each study can be different from the patient's clinical care groups at hand.
Further analysis can be done by segmenting the studies into various groups and then finding similarity among their results. Segmenting can be done based on population sizes of study images or concerning the method of data collection [12].
Conclusion
Physician assist intelligence systems can improve patient flow through the hospital and aid in the medical decision-making process during patient care; both important especially in times of high financial pressure.
References
- Barta JA, Powell CA, Wisnivesky JP. Global epidemiology of lung cancer. Ann Glob Health. 2019;85(1):8.
[Crossref] [Google Scholar] [PubMed]
- Sheehan DF, Criss SD, Chen Y, Eckel A, Palazzo L, Tramontano AC, et al. Lung cancer costs by treatment strategy and phase of care among patients enrolled in medicare. Cancer Med. 2019;8(1):94-103.
[Crossref] [Google Scholar] [PubMed]
- Awai K, Murao K, Ozawa A, Komi M, Hayakawa H, Hori S, et al. Pulmonary nodules at chest CT: Effect of computer-aided diagnosis on radiologists’ detection performance. Radiology. 2004;230(2):347-352.
[Crossref] [Google Scholar] [PubMed]
- Ausweger C, Burgschwaiger E, Kugler A, Schmidbauer R, Steinek I, Todorov Y, et al. Economic concerns about global healthcare in lung, head and neck cancer: Meeting the economic challenge of predictive, preventive and personalized medicine. EPMA J. 2010;1:627-631.
[Crossref] [Google Scholar] [PubMed]
- Avanzo M, Stancanello J, Pirrone G, Sartor G. Radiomics and deep learning in lung cancer. Strahlenther Onkol. 2020;196:879-887.
[Crossref] [Google Scholar] [PubMed]
- Gu Y, Chi J, Liu J, Yang L, Zhang B, Yu D, et al. A survey of computer-aided diagnosis of lung nodules from CT scans using deep learning. Comput Biol Med. 2021;137:104806.
[Crossref] [Google Scholar] [PubMed]
- Gugulothu VK, Balaji S. An early prediction and classification of lung nodule diagnosis on CT images based on hybrid deep learning techniques. Multimed Tools Appl. 2024;83(1):1041-1061.
[Crossref] [Google Scholar] [PubMed]
- Murugesan M, Kaliannan K, Balraj S, Singaram K, Kaliannan T, Albert JR. A hybrid deep learning model for effective segmentation and classification of lung nodules from CT images. J Intel Fuzzy Syst. 2022;42(3):2667-2679.
- de Margerie-Mellon C, Chassagnon G. Artificial intelligence: A critical review of applications for lung nodule and lung cancer. Diagn Interv Imaging. 2023;104(1):11-17.
[Crossref] [Google Scholar] [PubMed]
- Mohamed TI, Oyelade ON, Ezugwu AE. Automatic detection and classification of lung cancer CT scans based on deep learning and ebola optimization search algorithm. Plos One. 2023;18(8):e0285796.
[Crossref] [Google Scholar] [PubMed]
- Coudray N, Ocampo PS, Sakellaropoulos T, Narula N, Snuderl M, Fenyo D, et al. Classification and mutation prediction from non-small cell lung cancer histopathology images using deep learning. Nat Med. 2018;24(10):1559-1567.
[Crossref] [Google Scholar] [PubMed]
- Chiu HY, Chao HS, Chen YM. Application of artificial intelligence in lung cancer. Cancers. 2022;14(6):1370.
[Crossref] [Google Scholar] [PubMed]
Citation: Babu BA (2024) Classic versus Deep Learning Computer Vision Methods CT Scan Lung Cancer Detection: Meta-Analysis. J Vasc Surg. 12:567.
Copyright: © 2024 Babu BA. This is an open-access article distributed under the terms of the Creative Commons Attribution License, which permits unrestricted use, distribution, and reproduction in any medium, provided the original author and source are credited.
